
DIpil Das
We discuss select findings from our US consumer survey and compare them to findings from January 11, 2021, January 4, 2021, and our previous surveys in 2020: December 28, December 21, December 15, December 8, December 1, November 24, November 17, November 10, November 3, October 27, October 20, October 13, October 6, September 29, September 22, September 15, September 9, September 2, August 26, August 19, August 12, August 5, July 29, July 22, July 15, July 8, July 1, June 24, June 17, June 10, June 3, May 27, May 20, May 13, May 6, April 29, April 22, April 15, April 8, April 1, March 25 and March 17–18.
1. More Consumers Return To In-Store Shopping
Consumers’ in-store purchases in the past two weeks slightly bounced back after the declines recorded in last week’s survey.
Figure 1. All Respondents: Proportions of Respondents That Had Bought Clothing, Footwear or Accessories In-Store and Online in the Past Two Weeks (% of Respondents) [caption id="attachment_122146" align="aligncenter" width="725"]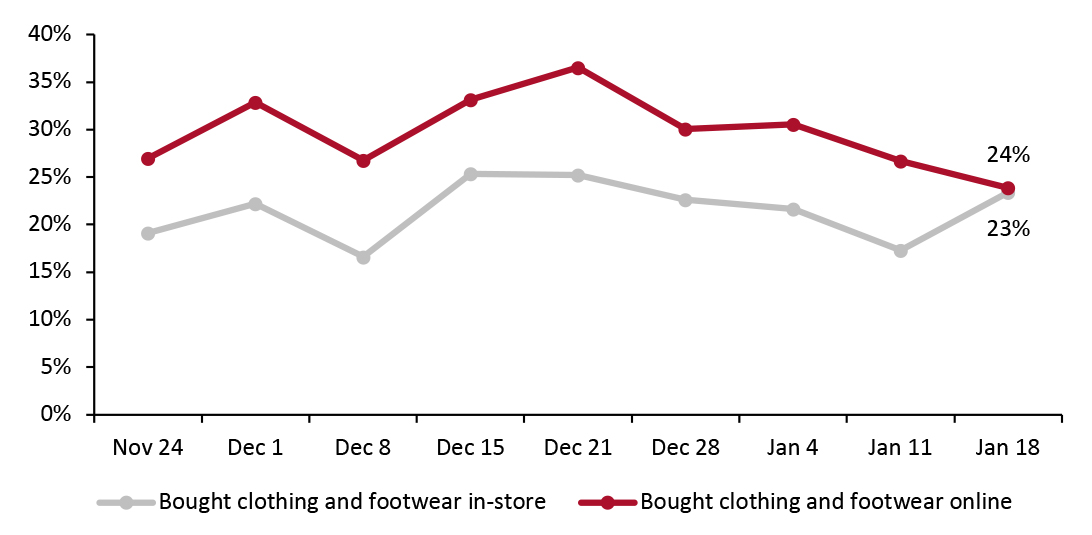 Base: US respondents aged 18+
Source: Coresight Research [/caption] 2. Slight Declines in Avoidance Rates of Shopping Centers and Shops in General This week, the avoidance rate of any type of public place stood at 80%, compared to 82% last week and 84% two weeks ago.
Figure 2. All Respondents: Proportion That Are Currently Avoiding Shopping Centers/Malls (% of Respondents) [caption id="attachment_122147" align="aligncenter" width="725"]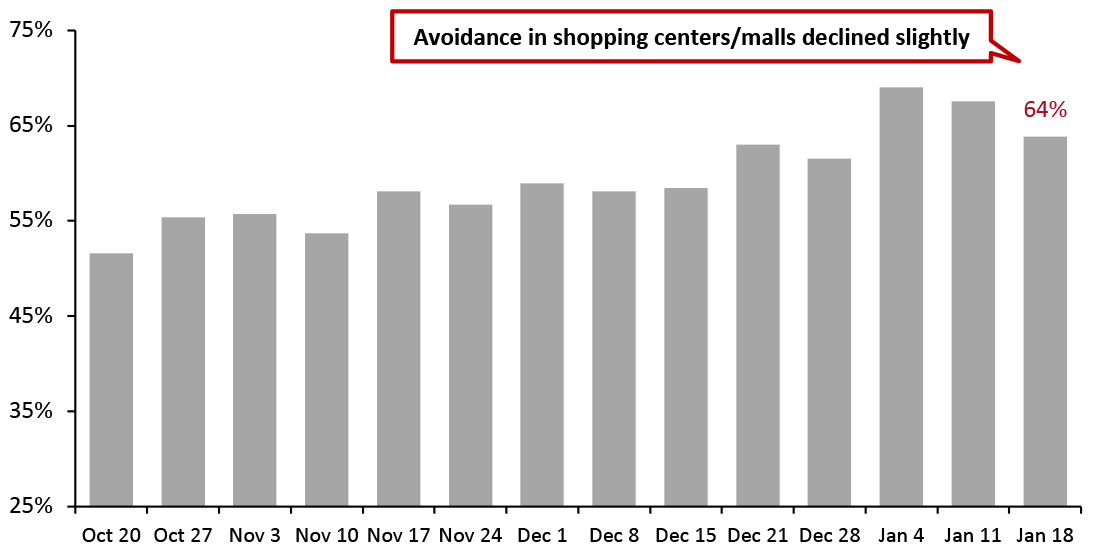 Base: US respondents aged 18+
Source: Coresight Research [/caption] 3. Retailers: Where Consumers Shopped Each week, we ask respondents which retailers they bought food and nonfood products from over the two weeks preceding the survey date. For food purchases, market leader Walmart gained more shoppers this week—some 49% had shopped at Walmart, seven percentage points higher than the proportion last week and the highest level we have seen for this question. We also saw an increase in consumers reporting that they had bought food from Costco, with a week-over-week increase of five percentage points, putting it ahead of Amazon and Target this week. The proportions of consumers shopping for nonfood products slightly recovered from the substantial declines last week, but still remained below the levels we saw in late December when purchases were supported by holiday season shopping. Department store retailers continued to see shopper numbers slide post-holiday, with declining trends in the proportions that had bought nonfood products from Kohl’s and Macy’s over the past few weeks.
- In-store purchases of clothing and footwear rebounded by six percentage points this week, to 23%—very close to the 24% that had bought apparel online. This is the first time the ratio of in-store to online for clothing and footwear has reached 1.0, reflecting consumers’ return to stores to buy apparel in the US.
- Consumers also shifted some grocery purchases from online to offline this week. The proportion of consumers that had recently bought food and beverages in-store reached a record-high of 78%, while online demand fell from 28% last week to 24%. As a result, the ratio of in-store to online shoppers increased to the highest level ever recorded in our US consumer surveys.
- Other essential items such as health, household and personal care products all saw an uptick in in-store purchases. Pet products witnessed the largest week-over-week increase, of almost nine percentage points.
Figure 1. All Respondents: Proportions of Respondents That Had Bought Clothing, Footwear or Accessories In-Store and Online in the Past Two Weeks (% of Respondents) [caption id="attachment_122146" align="aligncenter" width="725"]
Source: Coresight Research [/caption] 2. Slight Declines in Avoidance Rates of Shopping Centers and Shops in General This week, the avoidance rate of any type of public place stood at 80%, compared to 82% last week and 84% two weeks ago.
- The proportion of respondents that are currently avoiding shopping centers/malls decreased by five percentage points to 64%, from the peak of 69% two weeks ago.
- Avoidance of shops in general came in at 49%, down seven percentage points from the record level of 56% two weeks ago.
- Grooming services saw the largest week-over-week decline in avoidance, of 10 percentage points.
Figure 2. All Respondents: Proportion That Are Currently Avoiding Shopping Centers/Malls (% of Respondents) [caption id="attachment_122147" align="aligncenter" width="725"]
Source: Coresight Research [/caption] 3. Retailers: Where Consumers Shopped Each week, we ask respondents which retailers they bought food and nonfood products from over the two weeks preceding the survey date. For food purchases, market leader Walmart gained more shoppers this week—some 49% had shopped at Walmart, seven percentage points higher than the proportion last week and the highest level we have seen for this question. We also saw an increase in consumers reporting that they had bought food from Costco, with a week-over-week increase of five percentage points, putting it ahead of Amazon and Target this week. The proportions of consumers shopping for nonfood products slightly recovered from the substantial declines last week, but still remained below the levels we saw in late December when purchases were supported by holiday season shopping. Department store retailers continued to see shopper numbers slide post-holiday, with declining trends in the proportions that had bought nonfood products from Kohl’s and Macy’s over the past few weeks.