albert Chan
We discuss select findings from our US consumer survey and compare them to findings from previous weekly surveys.
1. More Consumers Purchase Apparel In Stores Than OnlineThis week, in-store apparel purchases increased substantially, returning close to the level we saw during the holiday season last year. Moreover, some 13% of respondents reported buying more clothing and footwear than pre-crisis—the highest level in our survey so far this year. Meanwhile, the apparel category witnessed the largest decline, of almost six percentage points, in consumers that are buying less than pre-crisis. As a result, the ratio of the proportion of respondents buying less than pre-crisis to the proportion buying more fell to 1.9, from 3.1 last week.
In terms of shopping channels, for the first time in our survey, the proportion of consumers that purchased clothing and footwear in a store in the two weeks prior to the survey surpassed the proportion that bought apparel online. We have seen a downward trend in online apparel shopping in our survey: Some 18% of respondents had done so this week, down 11 percentage points from four weeks ago.
- Broken down by age, the youngest consumer group drove the uptick in in-store apparel shopping, while online apparel shopping witnessed the steepest week-over-week decline among those aged 30–44.
Figure 1. Proportion of Respondents That Had Bought Clothing and Footwear In-Store and Online (% of Respondents)
[caption id="attachment_123860" align="aligncenter" width="700"]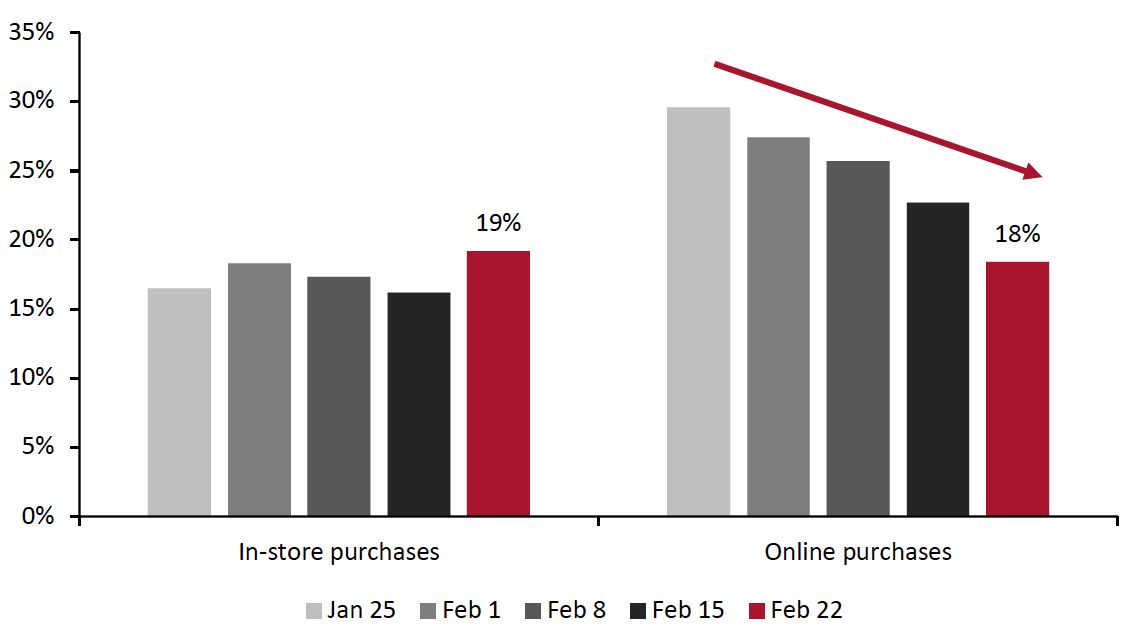 Base: US respondents aged 18+
Source: Coresight Research[/caption]
2. Fewer Than Eight In 10 Are Avoiding Public Places
In this week’s survey, the avoidance rate of any type of public area stood at 79%, down almost eight percentage points from the peak last week.
- The proportion of consumers avoiding shopping malls/centers dropped to the lowest level recorded in our survey, at 49%—almost 10 percentage points lower than the 59% seen last week. In a separate survey question, we also saw the proportion of consumers that had visited an enclosed shopping center increase to a high this week.
- The avoidance rate of shops in general decreased by seven percentage points to 37%, the lowest since November 2020—another positive indicator for US retail.
- Avoidance of food locations saw the largest week-over-week decline, of 11 percentage points. Half of consumers are currently avoiding restaurants, bars and coffee shops—the lowest proportion we have seen in our survey since October 2020.
- Respondents also appeared to be less concerned about returning to recreational events this week. The proportion of consumers avoiding sporting events decreased by nine percentage points week over week, and those avoiding entertainment and leisure venues fell again this week by eight percentage points.
Figure 2. Proportions of Respondents That Are Currently Avoiding Shopping Centers/Malls and Shops In General (% of Respondents)
[caption id="attachment_123862" align="aligncenter" width="700"]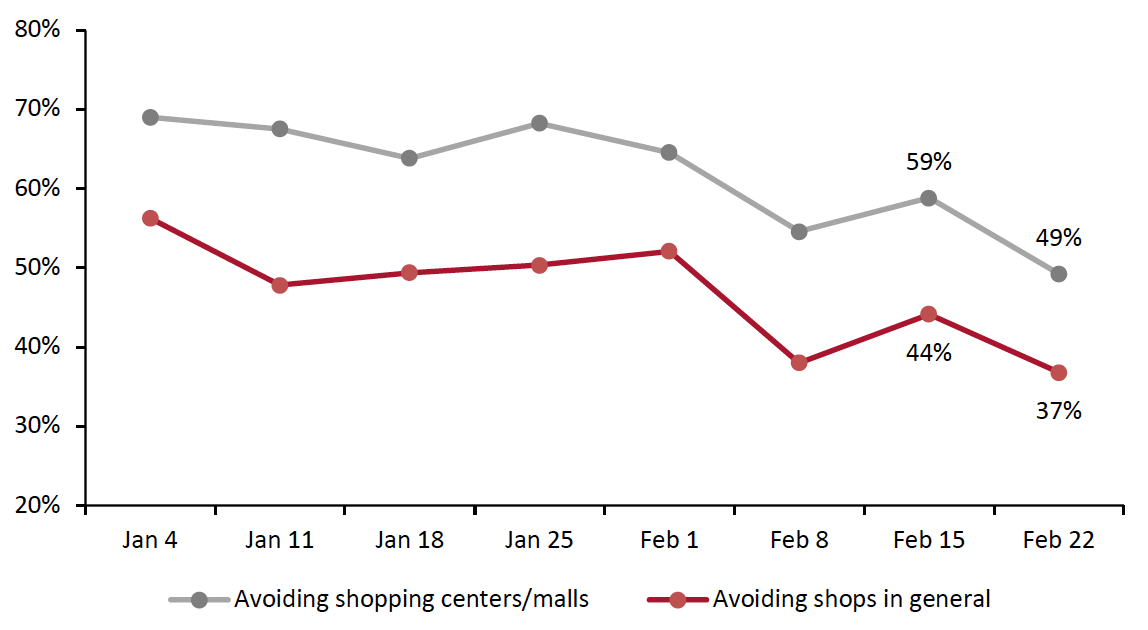 Base: US respondents aged 18+
Source: Coresight Research[/caption]
3. Where Consumers Shopped
Since December 21, 2020, we have asked consumers which retailers they bought from in the two-week period preceding the survey, for both food and nonfood products.
For food purchases:
- Some 51% of respondents reported buying food from Walmart in the past two weeks, down six percentage points from the peak last week.
- An increasing proportion of respondents have reported buying food from Target in the past few weeks. This week, some 23% purchased food at the retailer, up seven percentage points from three weeks ago, marking a new high. Target overtook Kroger banners as the second ranking retailer for food purchases in our survey this week.
- For the second time in our survey, more consumers reported making food purchases at Amazon than at Kroger banners.
For nonfood purchases:
- For the second week in a row, more consumers reported buying nonfood products from Walmart than from Amazon, despite the survey indicating that fewer had bought from Walmart this week.
- The proportion of consumers shopping at Target reached a post-holiday high, at 26%—some five percentage points higher than last week’s survey.
- More consumers purchased nonfood products from eBay this week, at 12.9%, up from 6.7% three weeks ago.