
albert Chan
What’s the Story?
This report presents the results of Coresight Research’s latest weekly survey of US consumers, undertaken on February 22. The report includes analysis of new questions on shopper behaviors and the impacts of the coronavirus outbreak. We explore the trends we are seeing from week to week, following previous weekly surveys.
What Shoppers Are Buying and Which Retailers They Are Buying From
What Consumers Bought In-Store and Online
This week, we saw slight declines in purchases of essentials, particularly of food and household products. For a few discretionary categories, consumers appeared to shift some purchases from online to offline.
- For the first time since we started asking the question, the proportion of consumers that reported purchasing clothing and footwear in-store outpaced those buying online this week. After declining for the past two weeks, the proportion that had bought clothing and footwear in-store rebounded to 19.2%. Some 18.4% of respondents had done so online in the two-week period prior to the survey, down 11 percentage points from 29.6% reported in our survey four weeks ago and representing the fourth consecutive week of slowing numbers.
- Analyzing the results by age group, the youngest consumer group drove the uptick in in-store apparel shopping, as shown in Figure 2. Online apparel shopping witnessed the steepest week-over-week decline among those aged 30–44.
- Overall, the proportion of consumers that bought food and beverages fell significantly. Some 67.4% had done so in-store, down six percentage points from 73.6% last week and the lowest level we have seen this year. Online food and beverage purchases dropped sharply, by almost nine percentage points, to the lowest level since we started asking this question on November 24, 2020. Roughly one-fifth reported that they bought food and beverages online, from 28.2% last week.
- For other essentials, in-store and online purchases of household products both also declined, although the changes were within the margin of error. Some 47.5% had bought household products in-store and 15.9% had done so online this week—the two-month nadir for both.
- The proportion of consumers reporting that they had purchased home-improvement products slid over the past month: This week, some 9.7% reported buying home-improvement products in-store in the two weeks preceding the survey, down by around 10 percentage points from four weeks ago. Moreover, the proportion that had bought such products online fell almost six percentage points compared to a month ago—like apparel, this represented the fourth consecutive week of lower online shopper numbers. Home improvement has been one of the strongest retail categories throughout the pandemic, but our recent survey data may indicate the start of a slowdown in the category.
Figure 1. All Respondents: What They Have Bought In-Store and Online in the Past Two Weeks (% of Respondents)
[caption id="attachment_123848" align="aligncenter" width="700"]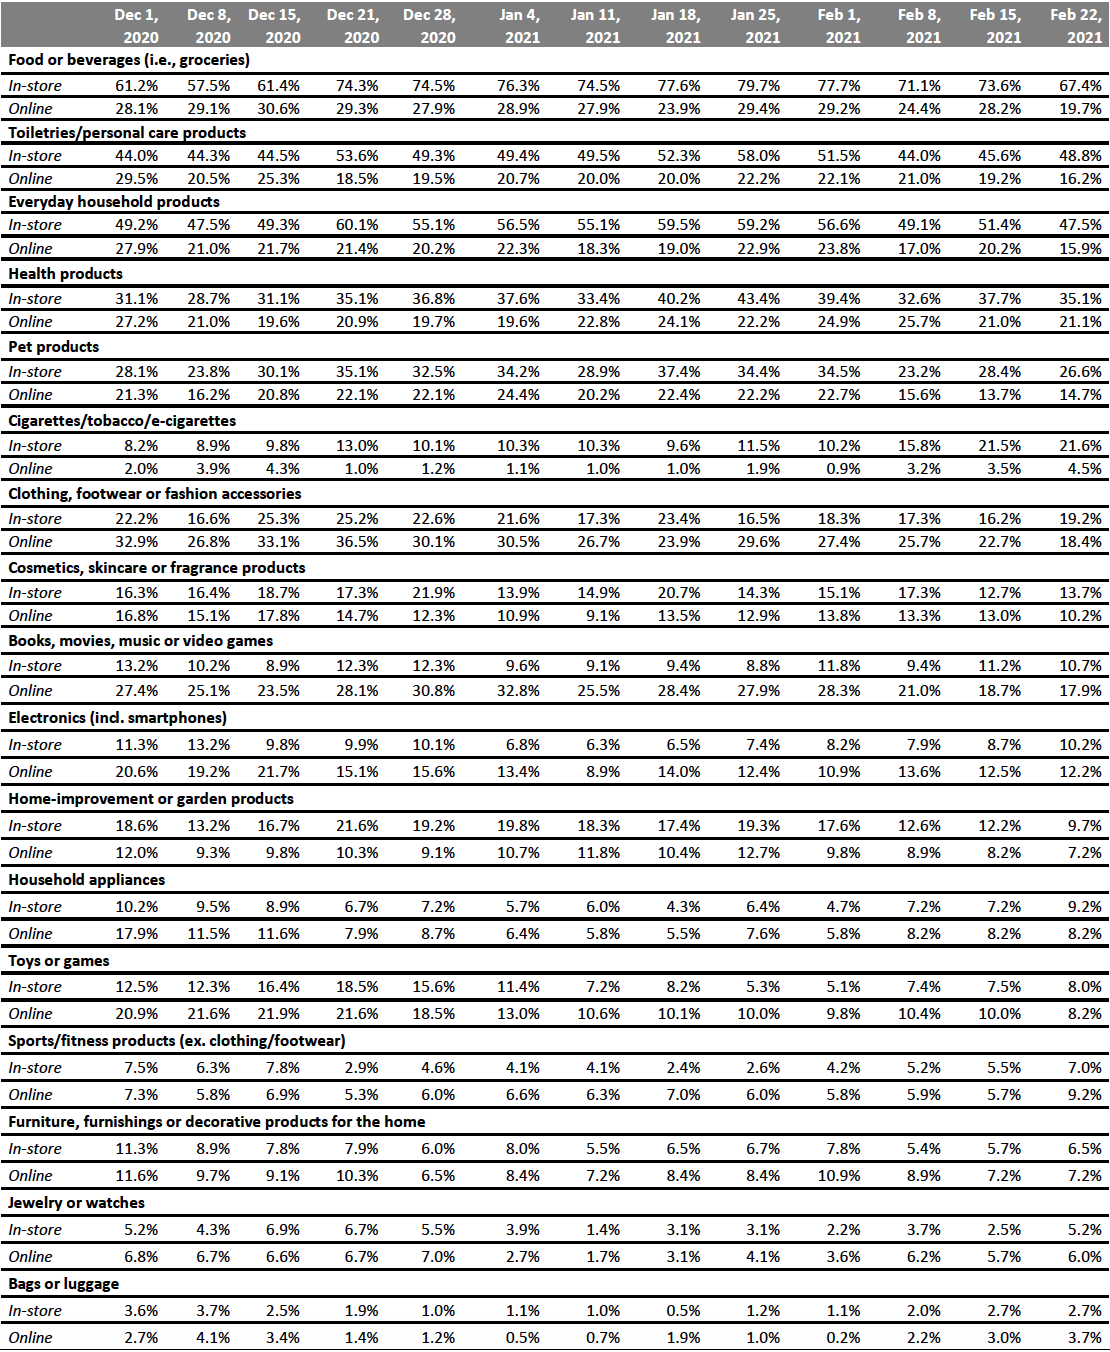 Respondents could select multiple options
Base: US respondents aged 18+
Source: Coresight Research[/caption]
Figure 2. All Respondents: Proportions of Respondents That Had Bought Clothing and Footwear In-Store (Left) And Online (Right) In The Past Two Weeks, by Age (% Of Respondents)
[caption id="attachment_123850" align="aligncenter" width="700"]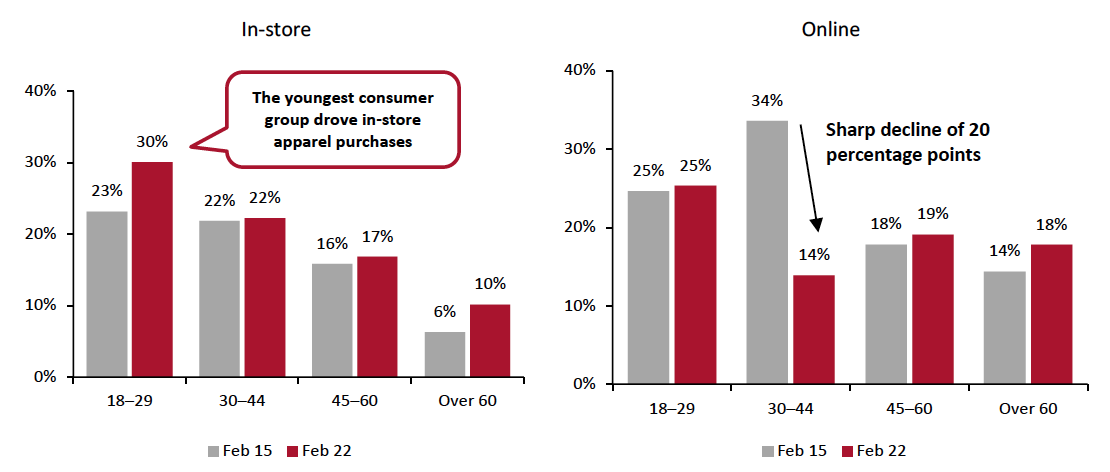 Base: US respondents aged 18+
Source: Coresight Research[/caption]
Which Retailers Consumers Purchased Food and Nonfood Products From
Since December 21, 2020, we have asked consumers which retailers they bought from in the two-week period preceding the survey, for both food and nonfood products.
For food purchases:
- Some 51.2% of consumers reported buying food from Walmart in the past two weeks, down six percentage points from the peak of 57.6% last week.
- An increasing proportion of respondents have reported buying food from Target in the past few weeks. This week, some 23.4% purchased food at the retailer, up seven percentage points from three weeks ago, marking a new high. Target overtook Kroger banners as the second most popular retailer for food purchases in our survey this week. As noted below, we recorded an increase in nonfood shopper numbers at Target, too.
- For the second time in our survey, more consumers reported making food purchases at Amazon than at Kroger banners.
For nonfood purchases:
- For the second week in a row, more consumers reported buying nonfood products from Walmart than from Amazon, despite the survey indicating that fewer had bought from Walmart this week.
- The proportion of consumers shopping at Target reached a post-holiday high at 25.9%, five percentage points higher than the proportion reported in last week’s survey. eBay and Kohl’s saw week-over-week increases, too.
Figure 3. All Respondents: Which Retailers They Have Bought Food Products From and Which Retailers They Have Bought Nonfood Products From in the Past Two Weeks (% of Respondents)
[caption id="attachment_123851" align="aligncenter" width="700"]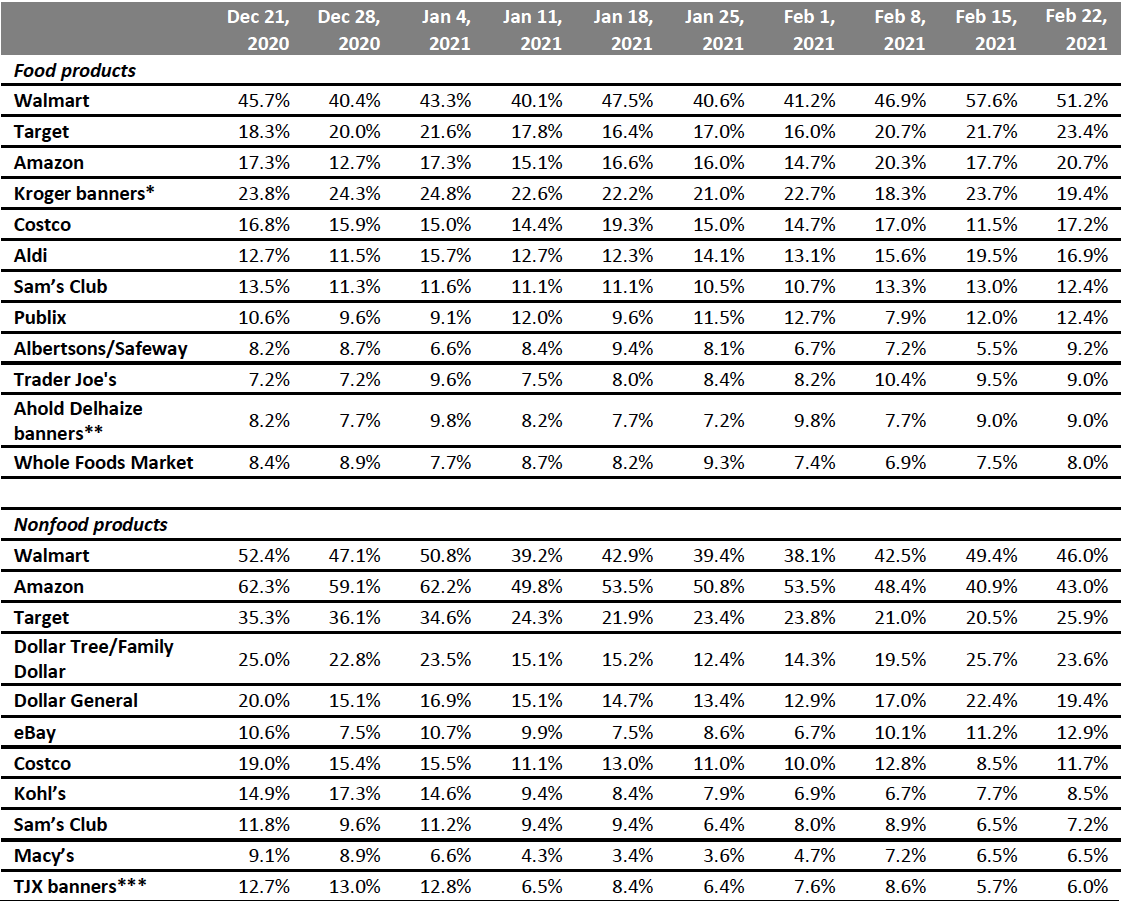 Respondents could select multiple options
Base: US Internet users aged 18+
*Kroger banners include City Market, Fred Meyer, Harris Teeter, King Soopers, Kroger, Ralphs and Smith’s Food & Drug
**Ahold Delhaize banners include Food Lion, Giant, Hannaford and Stop & Shop
***TJX banners include HomeGoods, HomeSense, Marshalls, Sierra and T.J. Maxx
Source: Coresight Research[/caption]
What Shoppers Are Doing and Where They Are Going
Consumers Visiting Enclosed Shopping Centers Reaches New High
Complementing our questions about purchases in the past two weeks, each week, we ask consumers what activities they have done in the past two weeks. This week, the proportion of respondents rose for 10 of the twelve activities we asked about.
- The proportion of consumers that had visited an enclosed shopping center reached a high this week, even compared to holiday season levels. One-fifth of respondents reported going to an enclosed shopping center, up five percentage points from 15.0% last week. Visits to an open-air shopping center stood at 16.7%, versus 18.0% last week.
- The proportion of consumers that reported going to food-service locations increased slightly this week. Some 28.6% had dined in a restaurant, up from 24.9% two weeks ago. The proportion that had gone to a coffee shop reached the highest level we have seen this year, at 17.9%, from 12.6% two weeks ago.
Figure 4. All Respondents: What Activities They Have Done in the Past Two Weeks (% of Respondents)
[caption id="attachment_123853" align="aligncenter" width="700"]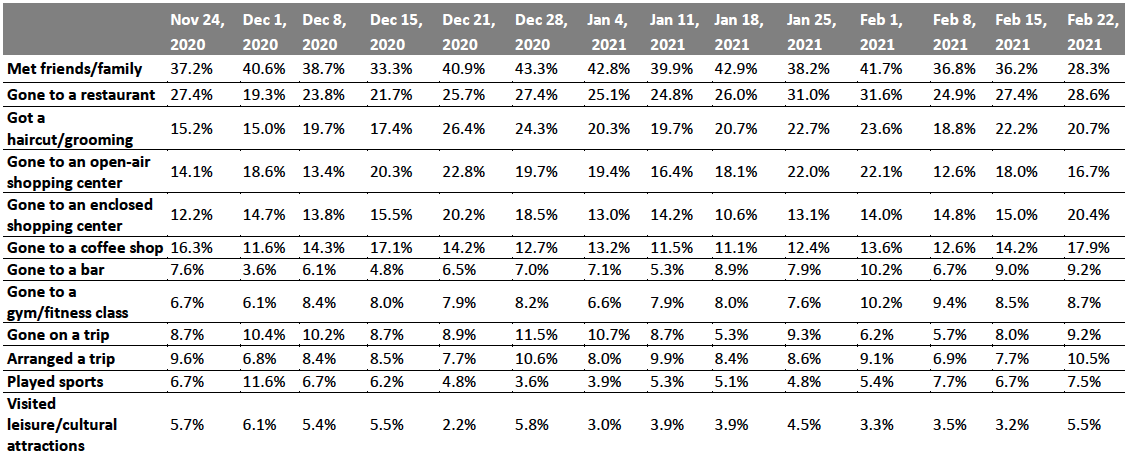 Respondents could select multiple options
Base: US respondents aged 18+
Source: Coresight Research[/caption]
Fewer than Eight In 10 Are Avoiding Public Places
Encouragingly, the avoidance rate of any type of public area in this week’s survey fell below 80% for the first time this year. Some 78.6% are avoiding any public place, down almost eight percentage points from the peak of 86.3% last week. For 10 of the 13 location options provided, rates of avoidance decreased this week, although some changes were within the margin of error.
- The proportion of consumers avoiding shopping malls/centers dropped to the lowest level seen in our survey, at 49.3%—almost 10 percentage points lower than the 58.9% seen last week. This is aligned with increased consumer visits to enclosed shopping centers, as discussed in the previous section.
- Another positive indicator for retail—avoidance rate of shops in general also decreased by seven percentage points to 36.8% from 44.1% last week, the lowest level recorded in our survey since November 2020.
- Avoidance in food locations saw the largest week-over-week decline, of 11 percentage points. Half of consumers are currently avoiding restaurants, bars and coffee shops—the lowest proportion we have seen in our survey since October 2020.
- Consumers also appeared to be less concerned by attending recreational events. The proportion of consumers avoiding sport events decreased by nine percentage points, and those avoiding entertainment and leisure venues fell again this week, to a low of 30.1%.
Figure 5. All Respondents: Public Places That Respondents Are Currently Avoiding (% of Respondents)
[caption id="attachment_123854" align="aligncenter" width="700"]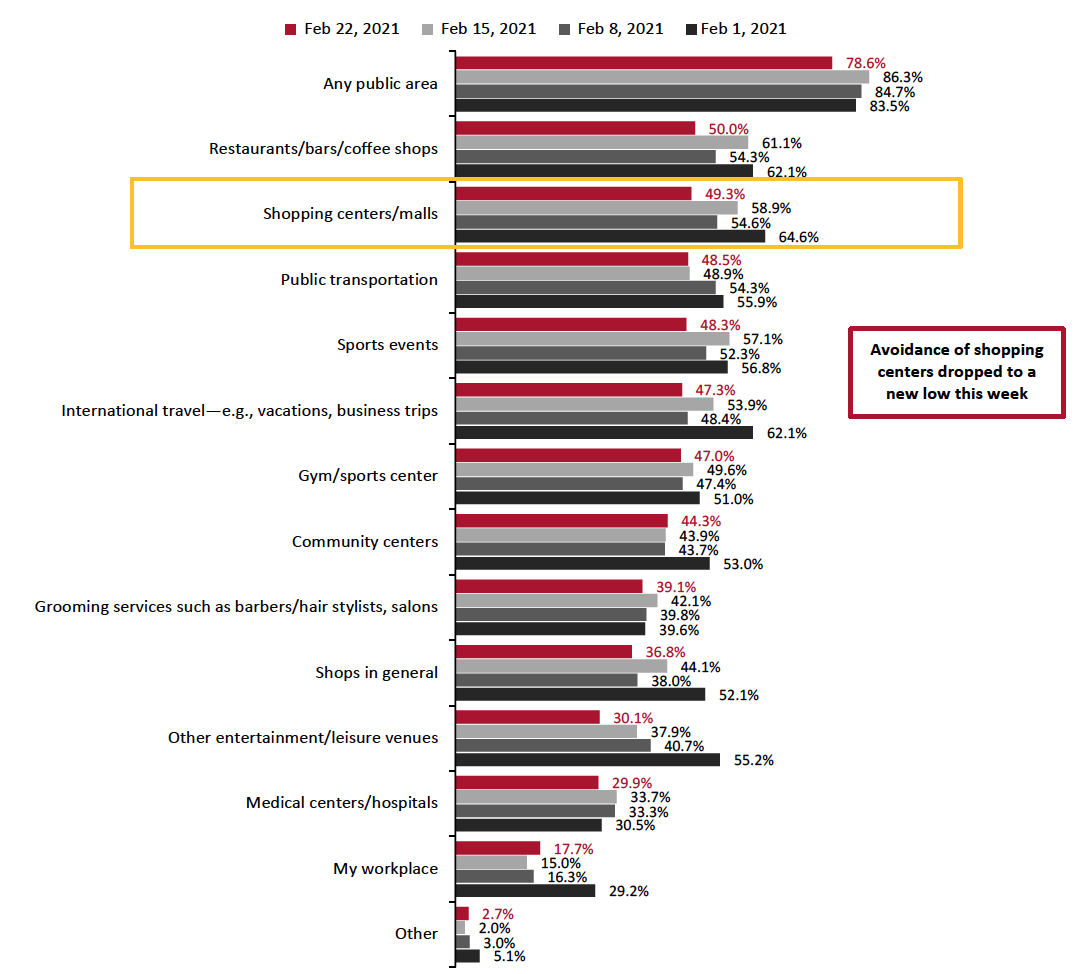 Respondents could select multiple options
Base: US respondents aged 18+
Source: Coresight Research[/caption]
Reviewing Trend Data in Current Purchasing Behavior
What Consumers Are Currently Buying More Of and Less Of
The proportion of consumers buying more of any product due to the coronavirus crisis remained at an elevated level after rising sharply in the past two weeks. This week, 65.9% of consumers reported purchasing more of any product. The proportion of consumers reporting buying less of any product for the same reason decreased very slightly to 46.0%.
- Buying more in any category and buying less in any category were not mutually exclusive options, so respondents could answer yes to both.
Buying more:
This week, despite sliding by seven percentage points week over week, household products maintained the lead in categories that consumers are buying more in than pre-crisis. The proportion of consumers buying more in other essential categories, including food, personal care and health products broadly leveled off.
For discretionary products, some 12.9% of respondents reported buying more clothing and footwear than pre-crisis—the highest level this year. The proportion of consumers buying more electronics increased by five percentage points week over week. Beauty and home have both seen an upward trend since February 1, which continued this week.
Buying less:
We again saw improvements in discretionary purchases, with lower proportions of consumers reported buying less in categories including apparel, beauty, electronics and home. Clothing and footwear, in particular, witnessed the largest decline, of almost six percentage points, in consumers that are buying less than pre-crisis. Some 15.2% reported purchasing less in the beauty product category, while 14.2% said they are purchasing fewer electronics.
Ratio of less to more: The ratios of the proportion of respondents buying less to the proportion buying more fell in six of the 14 options we surveyed this week, mostly in discretionary categories.
- The ratio for clothing and footwear returned to the ratio we saw during the holiday season in 2020, at 1.9, down from 3.1 last week.
- The ratio of buying less to more for electronics came in at 1.2, down from 2.4 last week.
- The ratio for beauty stood at 1.3, versus 2.1 last week and 2.3 two weeks ago. This is the lowest ratio we have seen since we started asking the question in April 2020.
- The ratio for home categories came in at 1.8, down from 2.6 last week and 2.7 two weeks ago.
Figure 6. All Respondents: What They Are Currently Buying More/Less Of Due to the Coronavirus Outbreak (% of Respondents)
[caption id="attachment_123856" align="aligncenter" width="700"]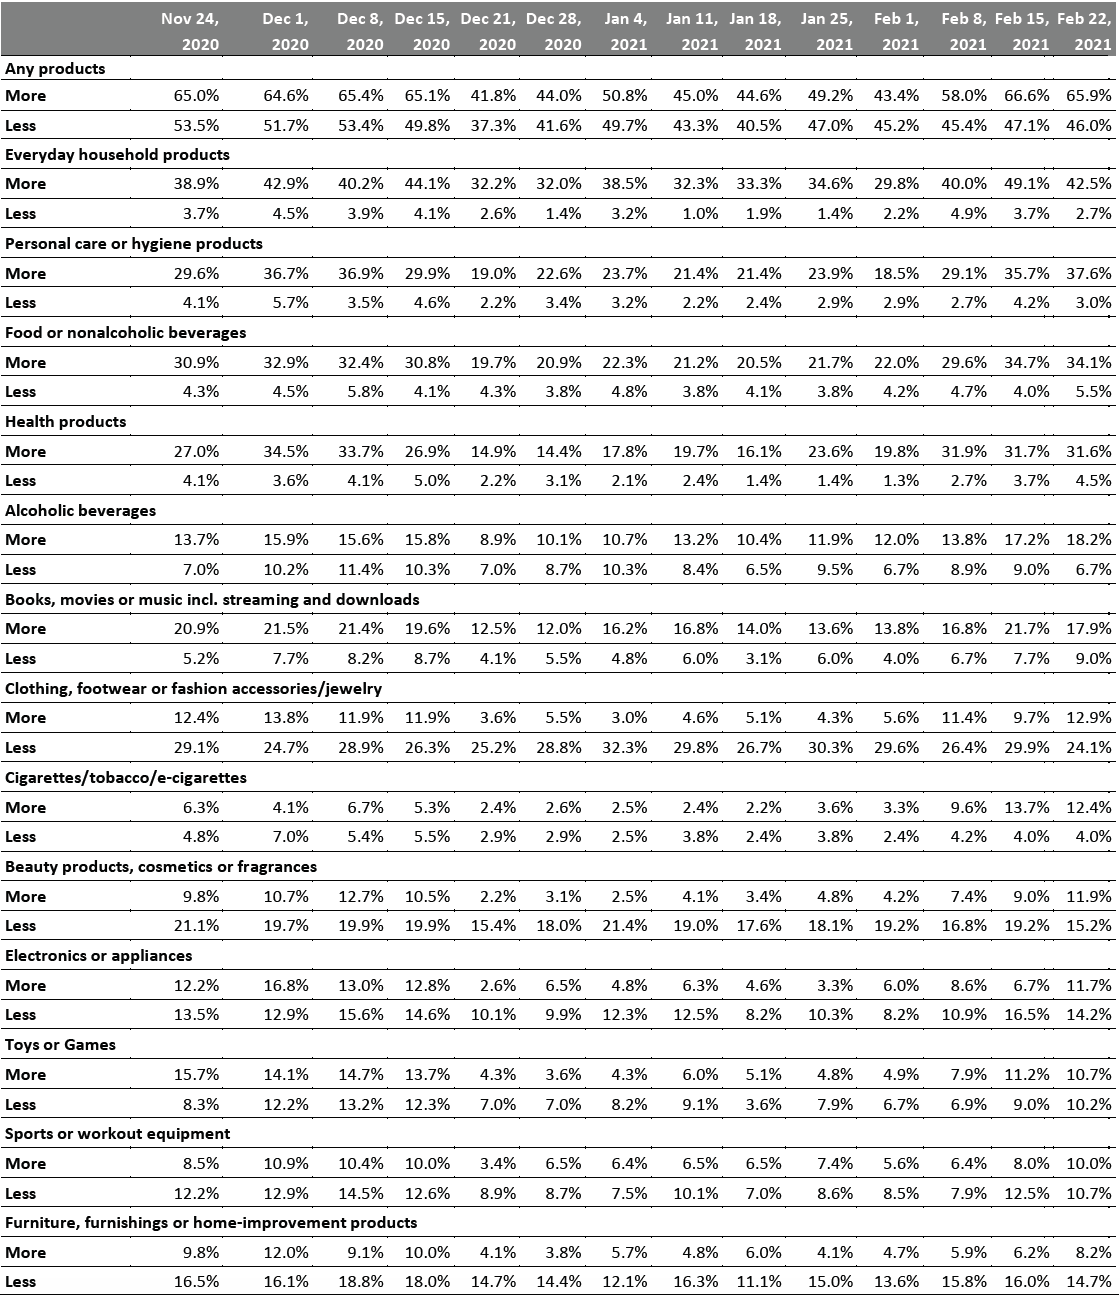 Base: US respondents aged 18+
Source: Coresight Research[/caption]
What We Think
This week, multiple metrics indicated that consumers are not only becoming slightly less concerned about returning to regular activities but are also beginning to be more willing to shop in stores. This likely reflects an increase in consumer confidence, possibly thanks to continued Covid-19 vaccine rollouts.
Our recurring weekly questions indicated the following:
- Avoidance of Public Places: The proportion of consumers avoiding public places of any kind fell below 80% for the first time this year, to 78.6% this week. Our survey results indicate positive signs for retailers—the proportion of consumers that reported avoiding shopping centers/malls and shops in general declined significantly week over week for both categories. In addition, one-fifth of consumers reported visiting an enclosed shopping center, the highest level recorded in our survey.
- Apparel: This week, in-store apparel purchases returned close to the level we saw during the holiday season last year. For the first time, at 19.2%, the proportion of consumers that had bought clothing and footwear in-store surpassed the proportion of respondents that had done so online, at 18.4%. Broken down by age, the uptick in in-store shopping was driven by the youngest consumer group.
- Grocery: Consumers reported buying less food and beverages, both in-store and online, this week. The proportion that reported buying groceries in-store dropped by six percentage points to a low this week. Moreover, the proportion of respondents that had bought groceries online fell by almost nine percentage points to one-fifth, compared to levels of around 30% that we have seen consistently across December 2020 and in January this year. This could be due to consumers being more willing to return to food-service locations—the proportion of consumers that reported dining in a restaurant increased slightly for the second consecutive weeks. The avoidance rate of food-service locations plunged substantially to half of respondents, the lowest level we have seen in our survey since October 2020.
Methodology
We surveyed respondents online on February 22 (402 respondents), February 15 (401 respondents), February 8 (405 respondents), February 1 (449 respondents), January 25 (419 respondents), January 18 (415 respondents), January 11 (416 respondents), January 4 (439 respondents), December 28 (416 respondents), December 21 (416 respondents), December 15 (438 respondents), December 8 (463 respondents), December 1 (441 respondents), November 24 (460 respondents), November 17 (425 respondents), November 10 (447 respondents), November 3 (418 respondents), October 27 (419 respondents), October 20 (409 respondents), October 13 (401 respondents), October 6 (416 respondents), September 29 (412 respondents), September 22 (422 respondents), September 15 (408 respondents), September 9 (406 respondents), September 2 (402 respondents), August 26 (414 respondents), August 19 (416 respondents), August 12 (400 respondents), August 5 (449 respondents), July 29 (403 respondents), July 22 (404 respondents), July 15 (454 respondents), July 8 (410 respondents), July 1 (444 respondents), June 24 (411 respondents), June 17 (432 respondents), June 10 (423 respondents), June 3 (464 respondents), May 27 (422 respondents), May 20 (439 respondents), May 13 (431 respondents), May 6 (446 respondents), April 29 (479 respondents), April 22 (418 respondents), April 15 (410 respondents), April 8 (450 respondents), April 1 (477 respondents), March 25 (495 respondents) and March 17–18 (1,152 respondents). The results have a margin of error of +/- 5%, with a 95% confidence interval. Not all charted week-over-week differences may be statistically significant.