DIpil Das
What’s the Story?
We present findings from our latest weekly US consumer survey, undertaken on February 14, 2022. This report provides an update on overall consumer behavior and shopping trends. Read our previous US Consumer Tracker reports for more on the trends we are seeing from week to week.What Consumers Are Doing and Where They Are Going
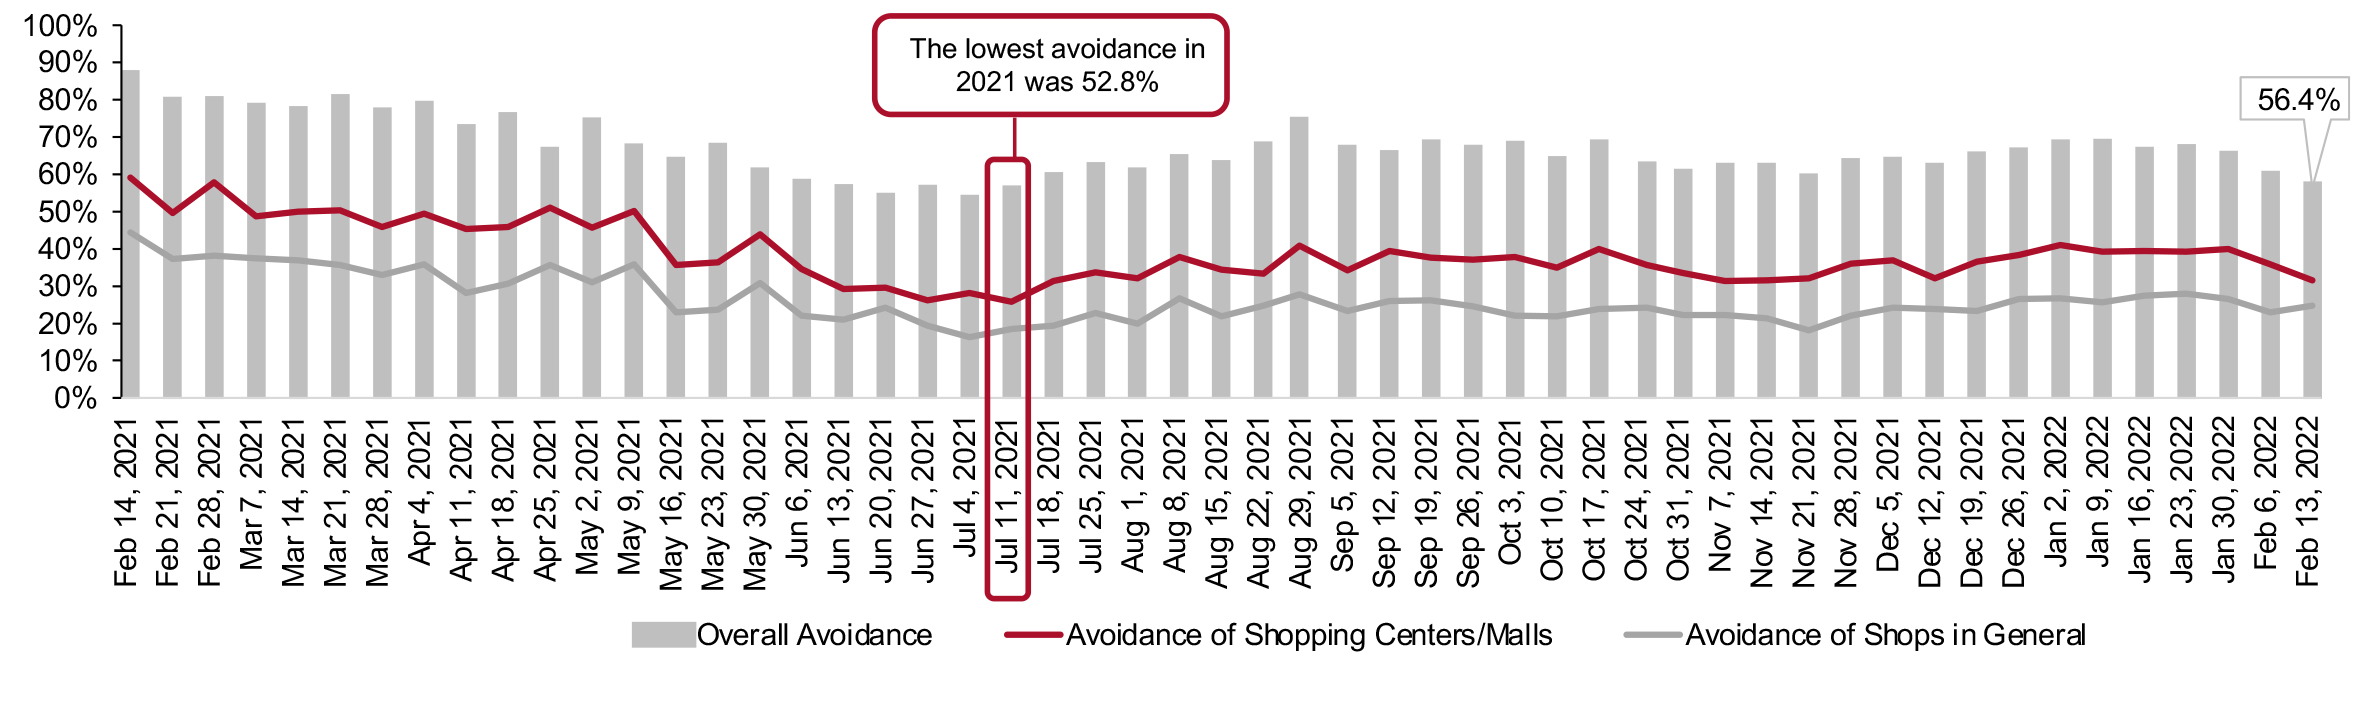
Avoidance of Public PlacesFigure 1. All Respondents: Avoidance of Public Places (% of Respondents) [caption id="attachment_142053" align="aligncenter" width="700"]
 Base: US respondents aged 18+
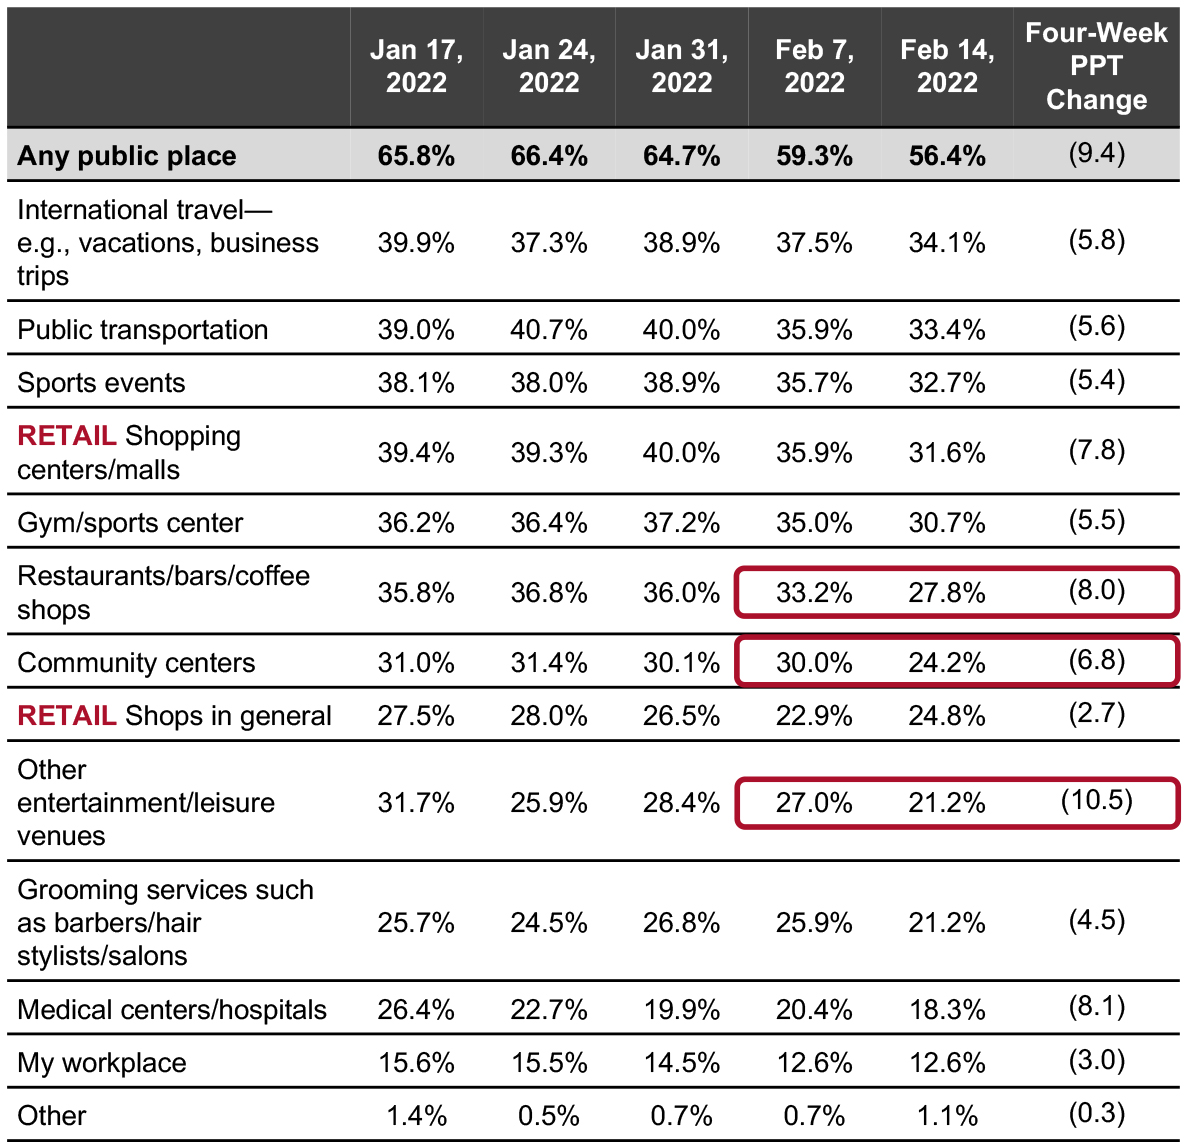
 Source: Coresight Research [/caption] Each week, we ask consumers if they are avoiding public places due to the pandemic. Figure 1 charts the long-term overall avoidance and avoidance of retail spaces every week for the preceding 12 months. This week, the overall avoidance rate continued to exhibit downward movement after a significant decline last week. Consumer behavior is currently in a transition period as consumers return to public places with the worst effects of the Omicron variant fading. We will continue to monitor the overall avoidance rate as it moderates at a new, post-Omicron level. Consumers are returning to shopping centers/malls as the overall avoidance rate declines. Over the past four weeks, avoidance of shopping centers/malls has declined by 7.8 PPTs. Meanwhile, avoidance of shops in general has changed only marginally, exhibiting upward movement this week although the change was not significant. This week’s full data on consumer avoidance of public places is presented in Figure 2. With the overall avoidance rate declining, several public places saw significant week-over-week declines in avoidance.
- Avoidance of restaurants, bars, and coffee shops declined by 5.4 PPTs this week. Over the course of four weeks, avoidance has declined by 8.0 PPTs as consumers are gathering more frequently at these places to socialize.
- Meanwhile, avoidance of community centers and entertainment/leisure venues both declined by 5.8 PPTs, week over week.
Figure 2. All Respondents: Public Places That They Are Currently Avoiding (% of Respondents) [caption id="attachment_142054" align="aligncenter" width="700"]
 PPT changes may not sum due to rounding
 Base: US respondents aged 18+
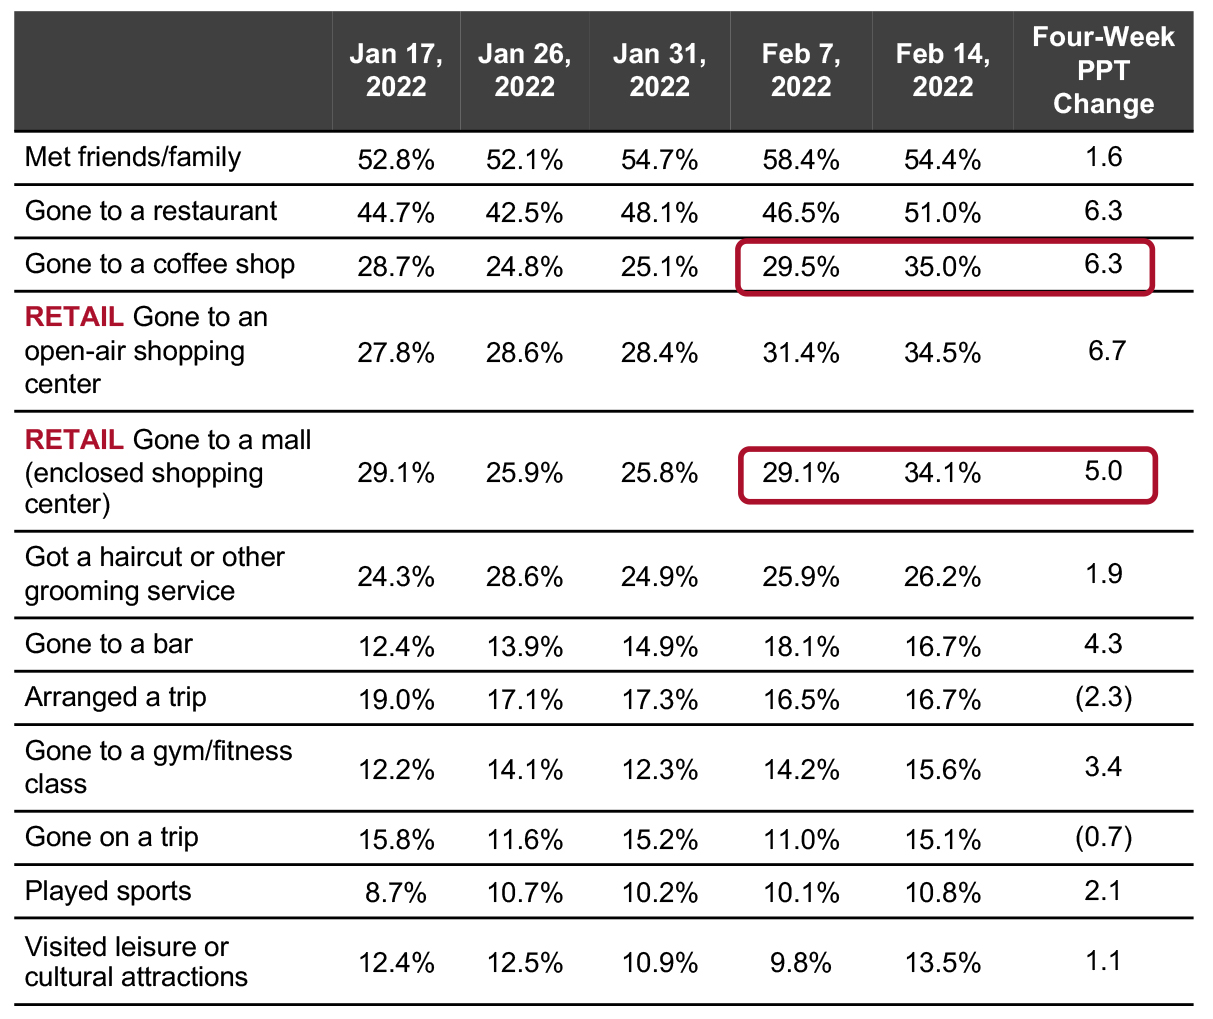
Source: Coresight Research [/caption] Activities in the Past Two Weeks Each week, we ask consumers where they have visited and what they have done in the past two weeks. This week, two activities saw significant increases.
- Coinciding with the previously mentioned decline in avoidance of coffee shops, the proportion of consumers having gone to a coffee shop in the past week increased by 5.5 PPTs and is 6.3 PPTs higher than it was four weeks ago
- In a positive sign for brick-and-mortar retail, the proportion of consumers having gone to a mall increased by 5.0 PPTs week over week. Visits to malls were likely boosted by Valentine’s Day shopping, in combination with declining new Covid-19 Omicron cases.
Figure 3. All Respondents: What Activities They Have Done in the Past Two Weeks (% of Respondents) [caption id="attachment_142055" align="aligncenter" width="700"]
 PPT changes may not sum due to rounding
 Base: US respondents aged 18+
Source: Coresight Research [/caption]
Which Retailers Consumers Are Buying From
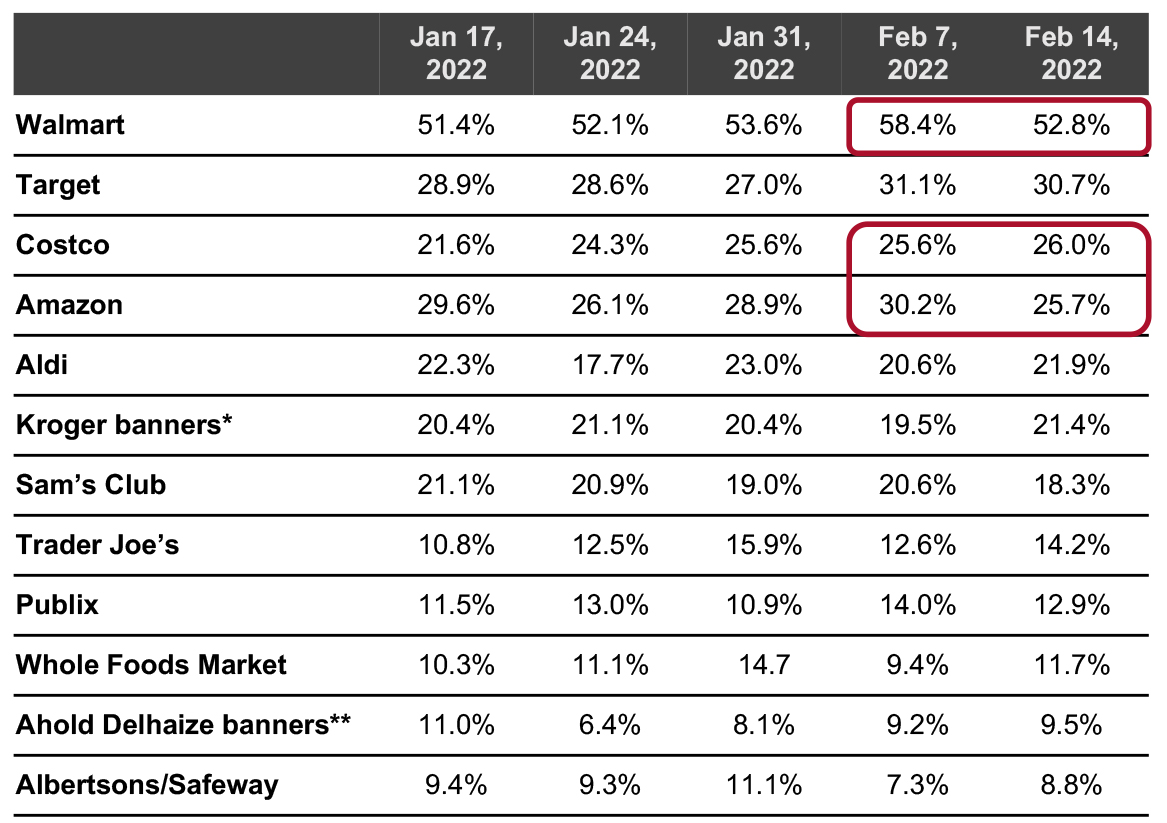
Food Retail One major retailer saw a significant decrease in food shoppers this week, while movement elsewhere led to some changes.- Walmart exhibited a 5.6-PPT decline in food shoppers, week over week, but has consolidated its position as the most popular food retailer. The proportion of consumers making food purchases from the retailer remains above 50%.
- Elsewhere, Amazon saw downward movement in its share of food shoppers this week. Although the decline remained within our 5.0-PPT margin of error, it was large enough to allow Costco to surpass it in our food shopper penetration metric.
Figure 4. All Respondents: Which Retailers They Have Bought Food Products From in the Past Two Weeks (% of Respondents) [caption id="attachment_142056" align="aligncenter" width="700"]
 Base: US respondents aged 18+
 *Kroger banners include City Market, Fred Meyer, Harris Teeter, King Soopers, Kroger, Ralphs and Smith’s Food & Drug
**Ahold Delhaize banners include Food Lion, Giant, Hannaford and Stop & Shop
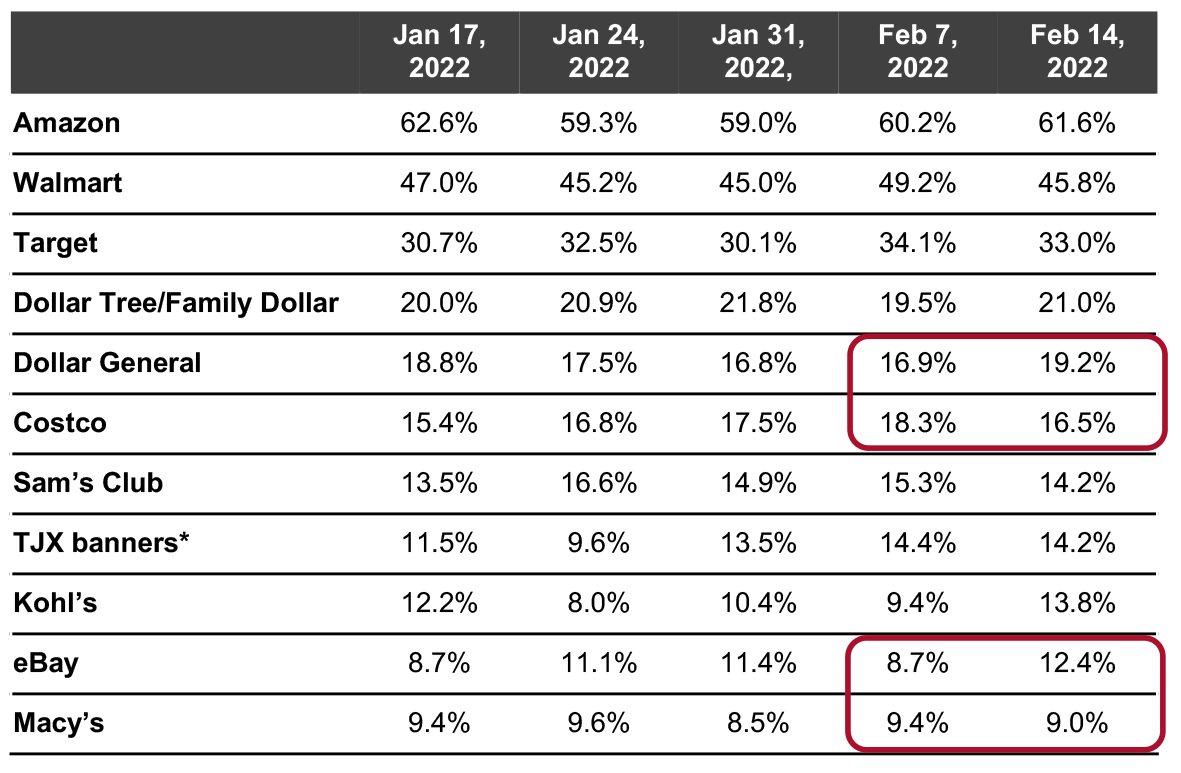
Source: Coresight Research [/caption] Nonfood Retail Trends in nonfood retail remain steady. No major retailer saw a significant change in nonfood shoppers, week over week. We examine recent trends below. Downward movement in nonfood shoppers at Costco and upward movement in nonfood shoppers at Dollar General resulted in the two retailers swapping places in our nonfood retail metric. Towards the bottom, upward movement in nonfood shoppers at eBay resulted in it swapping places with Macy’s.
Figure 5. All Respondents: Which Retailers They Have Bought Nonfood Products From in the Past Two Weeks (% of Respondents) [caption id="attachment_142057" align="aligncenter" width="700"]
 Base: US respondents aged 18+
 *TJX banners include HomeGoods, Homesense, Marshalls, Sierra and T.J. Maxx
Source: Coresight Research [/caption]
What Consumers Are Buying Buying In-Store/Online
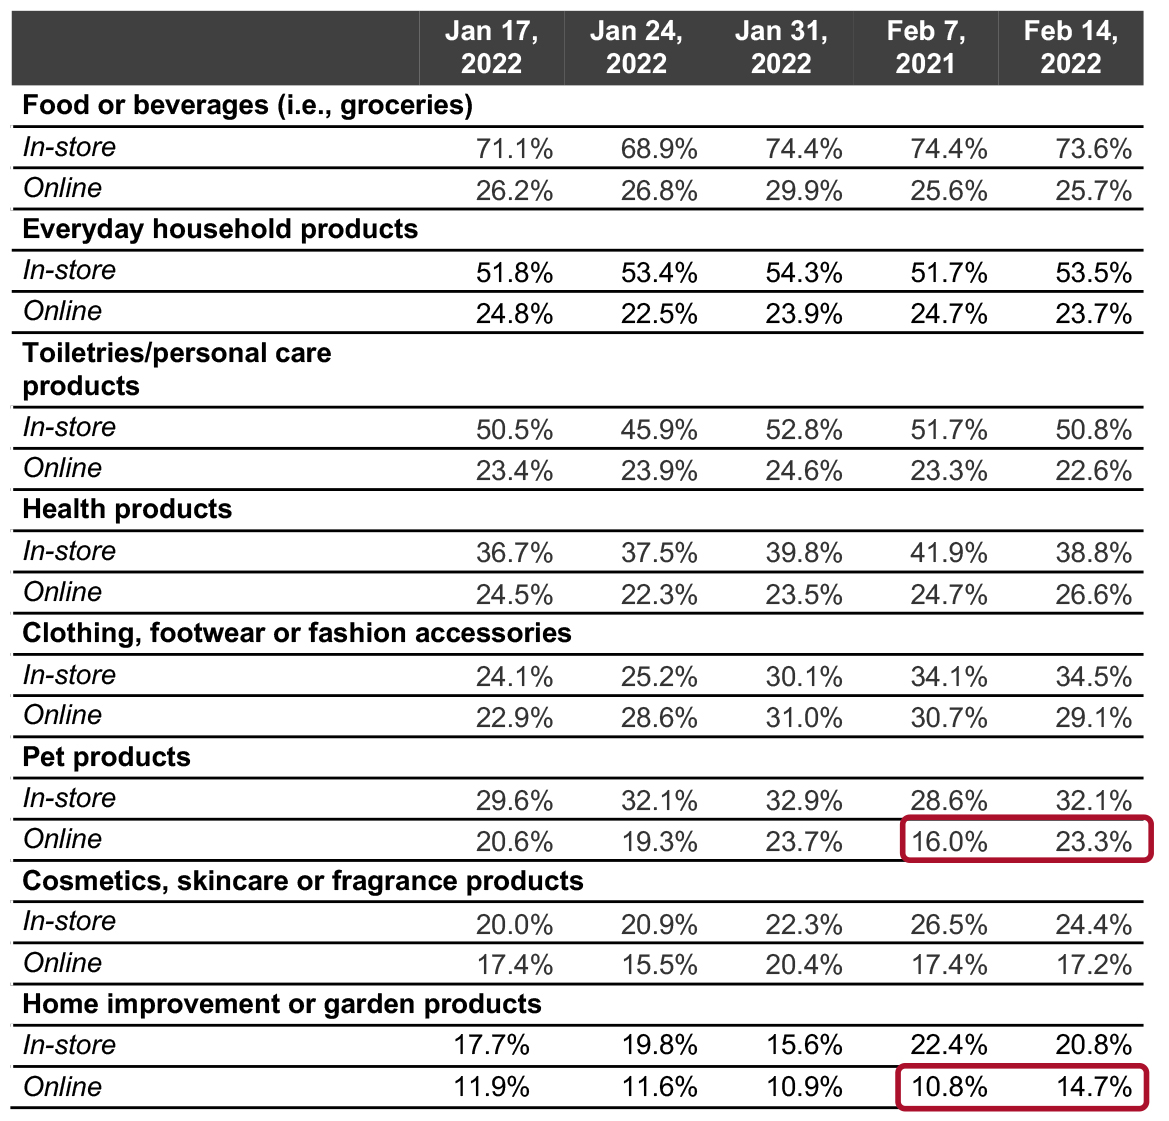
Each week, we ask respondents what they have bought online and in-store in the past two weeks. Our category data are split between Figures 6a and 6b. Among the more popular categories in Figure 6a, just one category saw significant change week over week.- Online purchases of pet products jumped back up after a substantial decline last week. This week, online purchases rose by 7.3 PPTs, in line with the level of online purchases seen two weeks prior.
- With overall avoidance declining, we will continue to monitor online purchases of food or beverages. Currently, the proportion making food purchases online is 4.2 PPTs lower from its month-long peak on January 31. If online purchases of food continue to remain at their current level as consumers return to public spaces, it will indicate a more permanent shift to e-grocery by a significant proportion of consumers. This would contribute to the fast expansion of the instant-needs market.
Figure 6a. All Respondents: What They Have Bought In-Store and Online in the Past Two Weeks (% of Respondents) [caption id="attachment_142058" align="aligncenter" width="700"]
 Base: US respondents aged 18+
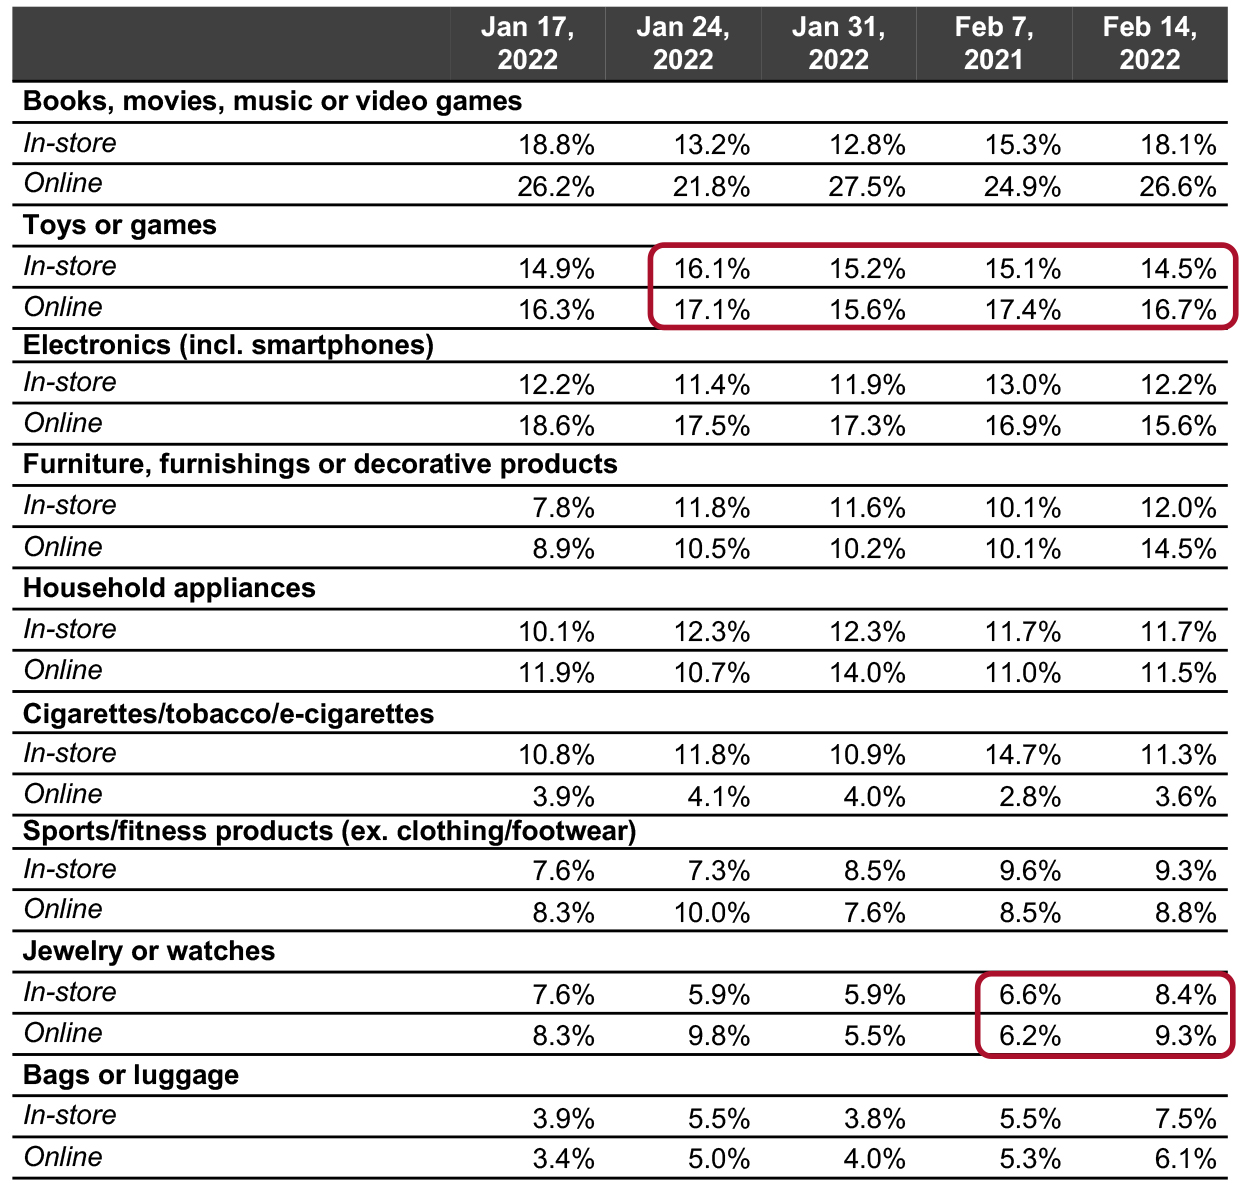
 Source: Coresight Research [/caption] For the less popular categories in Figure 6b, trends were generally steady. No category saw statistically significant change week over week.
- In-store purchases of toys or games have exhibited marginal downward movement for three consecutive weeks, while online purchases have shown fluctuations during that same time.
- Both online and in-store purchases of jewelry exhibited incremental increases this week in preparation for Valentine’s Day. This week, the online channel was the more favored channel through which consumers made purchases
Figure 6b. All Respondents: What They Have Bought In-Store and Online in the Past Two Weeks (% of Respondents) [caption id="attachment_142060" align="aligncenter" width="700"]
 Base: US respondents aged 18+
 Source: Coresight Research [/caption]
What We Think
Consumer behavior is currently in a transition period with the worst of the Omicron variant behind us. This week, overall avoidance continued its downward trend as it is in the process of moderating at a lower, post-Omicron level. With overall avoidance declining, consumers are returning to services. We recorded significant declines in the avoidance of restaurants, bars, and coffee shops as well as entertainment and leisure venues, In addition, according to our data, there was a significant return to shopping centers/malls this week, a positive for brick-and-mortar retail. As consumers return to public places and on-premises shopping, online purchases of food or beverages have not exhibited significant change, pointing towards a lasting consumer shift to e-grocery. We expect food e-commerce sales to climb by 32.4% in 2022, according to our estimates. We will continue to monitor online grocery sales throughout 2022. Read our recent Market Outlook on US grocery for more on this topic. Our weekly questions indicated the following:- What consumers are doing—This week, consumer avoidance of restaurants, bars and coffee shops, declined by 5.4 PPTs, while avoidance of entertainment and leisure venues and community centers both fell by 5.8 PPTs.
- Where consumers are shopping—Walmart saw food shoppers decline by 5.6 PPTs. Elsewhere, trends were steady in both food and nonfood retail.
- What consumers are buying—Online purchases of pet products increased by 7.3 PPTs, jumping back up to the levels of online purchases seen two weeks prior.