
albert Chan
What’s the Story?
This report presents the results of Coresight Research’s latest weekly survey of US consumers, undertaken on March 22. The report includes analysis of questions on shopper behaviors and the impacts of the coronavirus outbreak. We explore the trends we are seeing from week to week, following previous weekly surveys.
Consumers’ Easter Spending Plans
In this week’s survey, we asked consumers about their spending plans for Easter 2021. Compared to last year, a greater proportion of consumers expect to spend less in total on Easter than those that expect to spend more. The 2020 Easter holiday took place on April 12, amid lockdowns, and given recent strong retail sales trends, we think these expectations may prove more pessimistic than actual trends.
As we discuss later in this report, consumers appear to be socializing less and avoiding public places very slightly more as we head toward Easter.
In total, 76.4% of respondents plan to spend on Easter and 82.6% will celebrate even if they do not spend.
Figure 1. All Respondents: Expectations To Spend on Easter 2021 vs. 2020 (% of Respondents)
[caption id="attachment_125035" align="aligncenter" width="700"]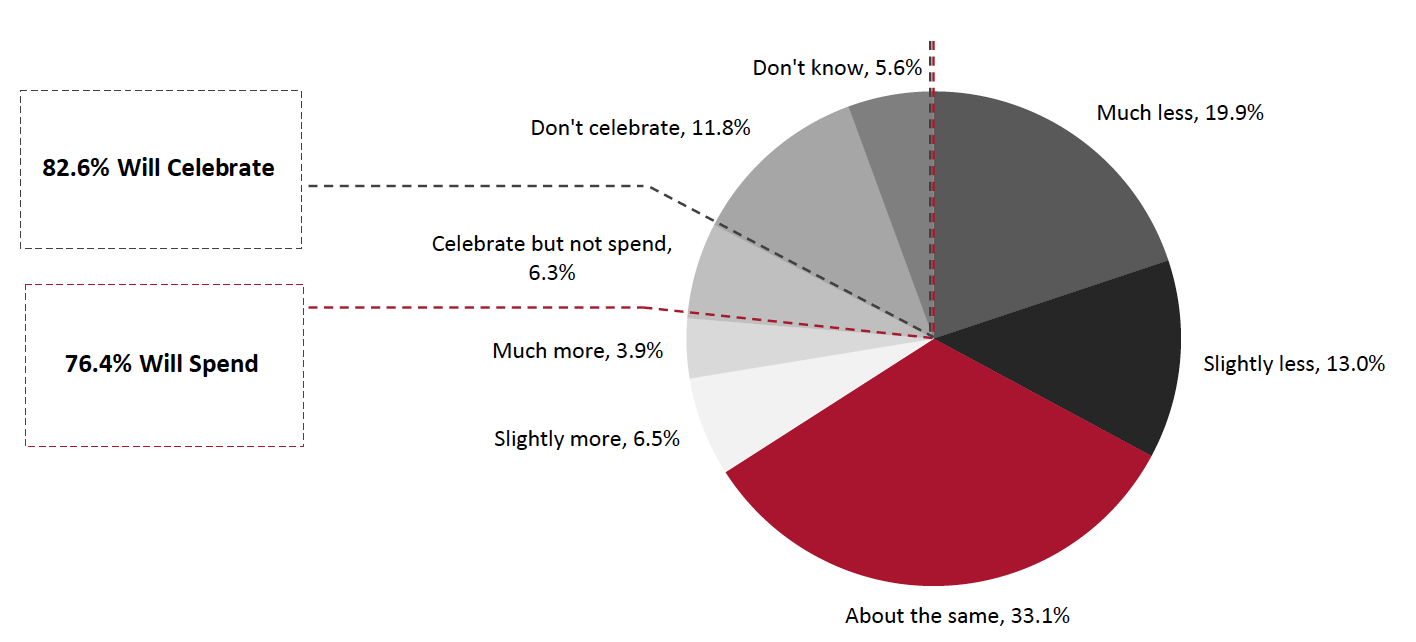 Base: 432 US respondents aged 18+, surveyed on March 22
Source: Coresight Research[/caption]
Consumers aged over 60 were the least likely to spend less on Easter this year, with just 8.0% planning to spend much less on Easter. Contrastingly, more than 20% of consumers in each of the three younger age groups we surveyed reported plans to spend much less on Easter this year.
Among all consumers who reported planning to spend on Easter this year, 10.0% reported plans to switch some or all of their spending from stores to e-commerce, while 7.1% expect to spend part of their third stimulus check on sEaster. For more coverage of Easter spending, see our upcoming US Easter Spending Preview report.
What Shoppers Are Doing and Where They Are Going
Consumer Activity Dips Slightly
Each week, we ask consumers what activities they have done in the past two weeks. This week, the proportion of respondents fell for 11 of the 12 activities we asked about, although most changes were within the margin of error.
- The only activity for which the proportion of consumers increased this week was getting a haircut or visiting a grooming service provider. This change was still within the margin of error, and continues a months-long trend of the proportion of consumers in this category hovering around one in five.
- Our three prior surveys show a high number of consumers reporting socializing with family and friends. This week, however, the proportion of consumers meeting up with friends and family in the past two weeks declined by nearly nine percentage points. While this is a substantial decline, we will watch the pattern over the coming weeks to determine whether this reflects a sustained return to more conservative socializing plans.
- The proportion of consumers that reported going to an enclosed shopping center fell for the second straight week, as consumers retain a slight preference for open-air shopping centers.
Figure 2. All Respondents: What Activities They Have Done in the Past Two Weeks (% of Respondents)
[caption id="attachment_125036" align="aligncenter" width="700"]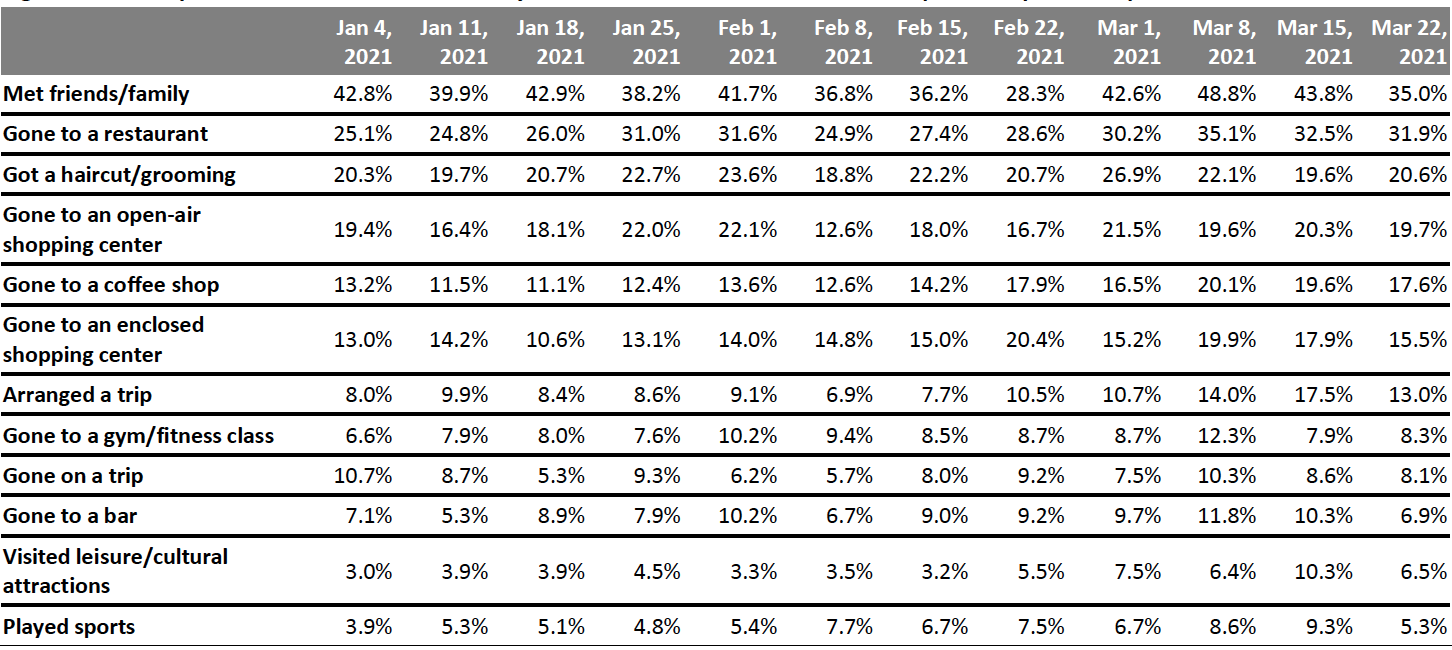 Respondents could select multiple options
Base: US respondents aged 18+
Source: Coresight Research[/caption]
Consumers’ Return to Public Places Stalls
This week, the avoidance rate of any type of public area came in at 79.6%, ticking up slightly after a period of sustained decline in avoidance. Despite this week’s slight rise, avoidance of public places remains nearly seven percentage points below the peak of 86.3% in February. For 11 of the 13 location options provided, rates of avoidance increased this week, although some changes were within the margin of error. Despite these recent upticks, avoidance of most public places remains down from the levels we saw earlier in the year.
- This week, avoidance of gyms and sports centers bounced back by nearly seven percentage points, after declining in our two prior surveys. This indicates that while consumers are slowly returning to regular activities, many remain reluctant to go back to these often crowded, enclosed areas.
- Public transportation was this week’s most avoided area, with just over half of all consumers reporting avoidance.
- Boding well for retailers, the proportion of consumers that reported avoiding shops declined for the third straight week—the only category in our survey to see a consistent decline over the past month. Consumers appear more reluctant to visit shopping centers than individual shops, with more than half of consumers avoiding centers and malls, although this week is the first time in three weeks that the proportion avoiding these locations surpassed 50%.
- This week, some 52.1% of consumers reported avoiding international travel, up nearly five percentage points after two weeks of steep decline. Travel restrictions on international destinations likely play a role in consumers’ continued avoidance of planning international trips.
Figure 3. All Respondents: Public Places That Respondents Are Currently Avoiding (% of Respondents)
[caption id="attachment_125063" align="aligncenter" width="700"]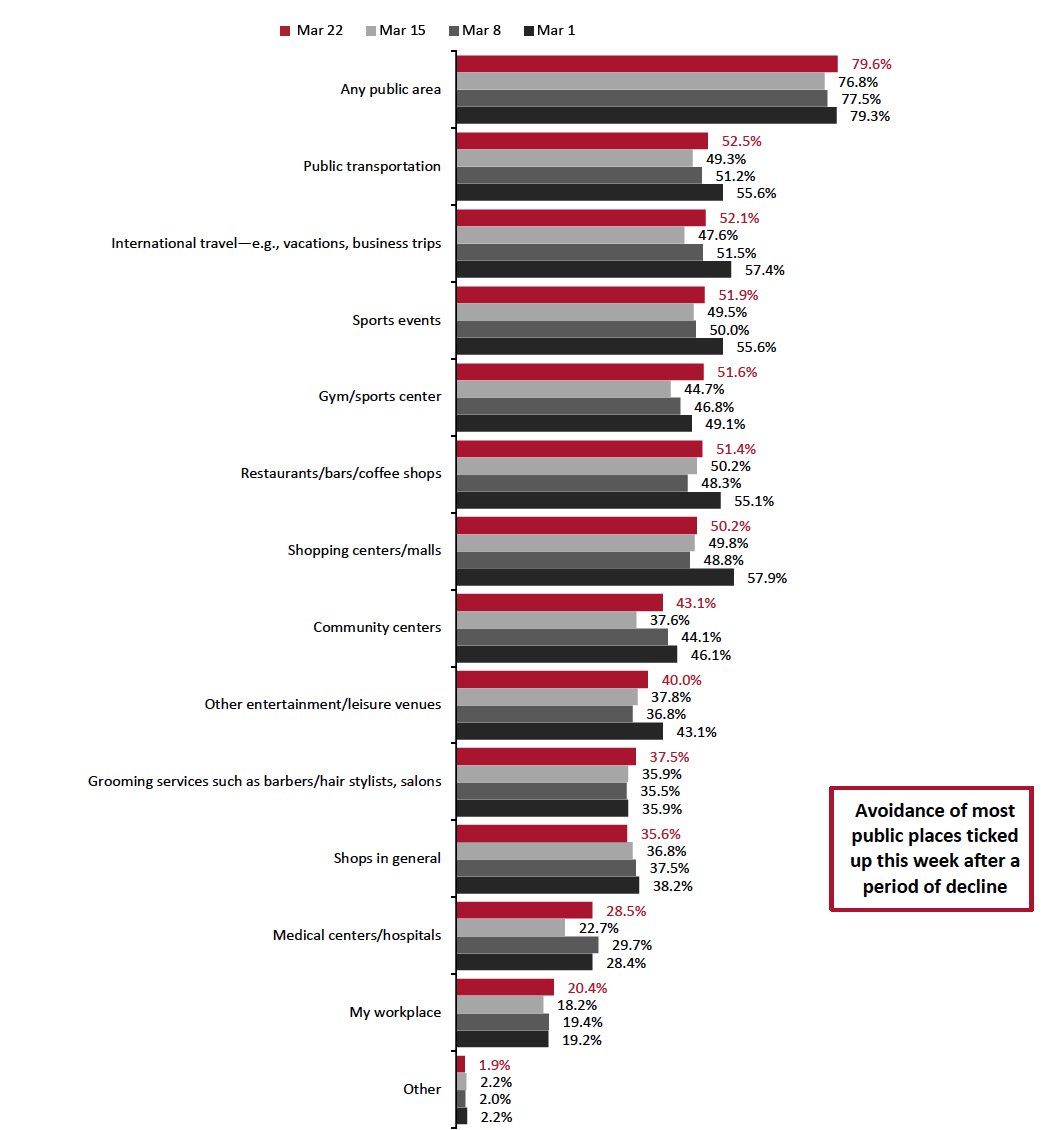 Respondents could select multiple options
Base: US respondents aged 18+
Source: Coresight Research[/caption]
What Shoppers Are Buying and Which Retailers They Are Buying From
What Consumers Bought In-Store and Online
This week, key findings in specific categories include the following:
- In-store purchases for food and beverage dropped for the second straight week. At 61.6%, the proportion of consumers purchasing groceries in a store is 18.1 percentage points lower than its peak on January 25. While the proportion of consumers purchasing food and beverage online did increase slightly this week, most of the decline in in-store spending from earlier in the year does not appear to have been redirected toward digital sales: Since January 25, the proportion of consumers purchasing food and beverage products online has decreased by nearly three percentage points.
- Approximately one in five consumers reported purchasing home-improvement products in a store this week. This is the fourth straight week of strong performance in this category after the proportion of consumers shopping in stores for home improvement products dipped substantially in early and mid-February.
- For the third straight week, more than one in five consumers reported purchasing clothing, footwear or fashion accessories in-store in the two weeks prior to our survey. The last such consecutive streak occurred between December 21 and January 4, amid the holiday season. The sustained improvement of in-store apparel sales numbers compared to late January and February suggests that a portion of consumers may have permanently shifted back to in-store apparel shopping.
Figure 4. All Respondents: What They Have Bought In-Store and Online in the Past Two Weeks (% of Respondents)
[caption id="attachment_125038" align="aligncenter" width="700"]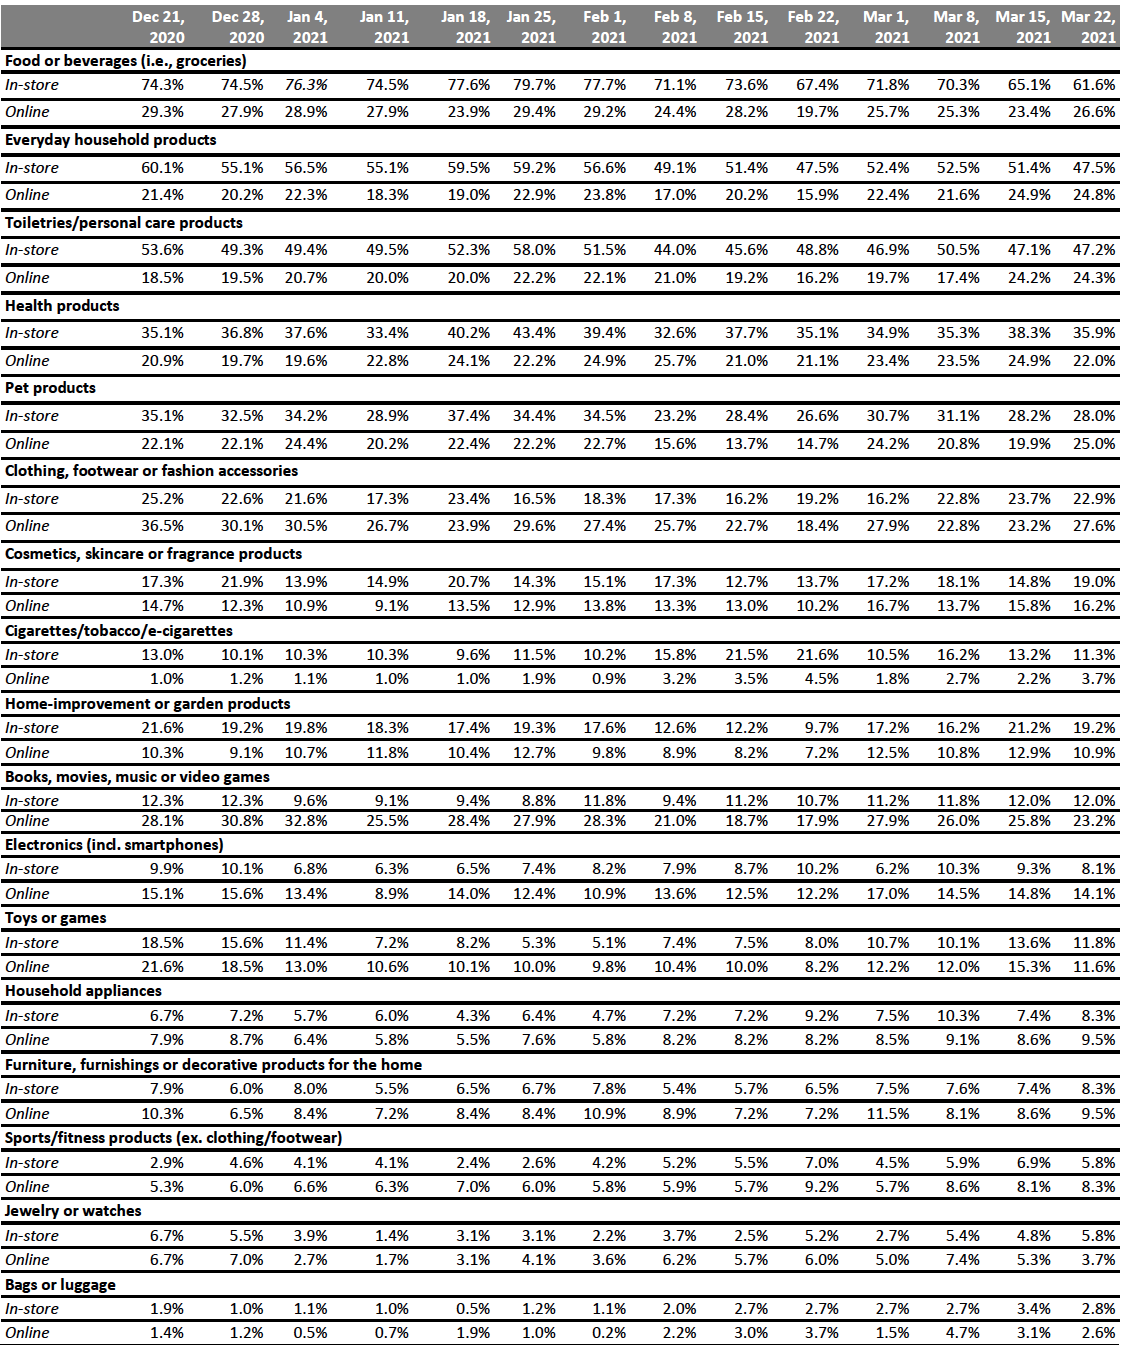 Respondents could select multiple options
Base: US respondents aged 18+
Source: Coresight Research[/caption]
Which Retailers Consumers Purchased Food and Nonfood Products From
Each week, we ask consumers which retailers they bought from in the two-week period preceding the survey, for both food and nonfood products.
For food purchases:
- Continuing the pattern of substantial fluctuation, the proportion of consumers shopping for food products at Walmart rose by 7.1 percentage points this week, after falling by 6.6 percentage points last week. While Walmart shopper numbers have varied substantially week to week, amalgamated results suggest that around half of shoppers tend to shop at Walmart for food products in any given two-week period.
- The proportion of consumers shopping at Kroger for food products fell to 14.8%, its lowest value this year. This was the second straight week of decline, putting the grocery giant behind Aldi in our survey ranking for the first time.
For nonfood purchases:
- For the first time since January 4, more than half of consumers surveyed reported shopping at Walmart for nonfood products. This week, the retailer saw a 7.1 jump in percentage points in respondents that purchased nonfood products. Walmart, nevertheless, remains behind Amazon in our survey—some 58.1% of consumers reported purchasing nonfood products from the e-commerce giant, the same proportion as last week. Amazon has been the top retailer in our survey for nonfood product purchases for all but one week since we began fielding this question.
- Both dollar stores saw declines in shoppers for the second straight week. Moreover, both are down more than five percentage points from their peak in our survey on February 15. Despite this decline, shopper numbers at these stores remained higher than values recorded in January.
Figure 5. All Respondents: Which Retailers They Have Bought Food Products From and Which Retailers They Have Bought Nonfood Products From in the Past Two Weeks (% of Respondents)
[caption id="attachment_125039" align="aligncenter" width="700"]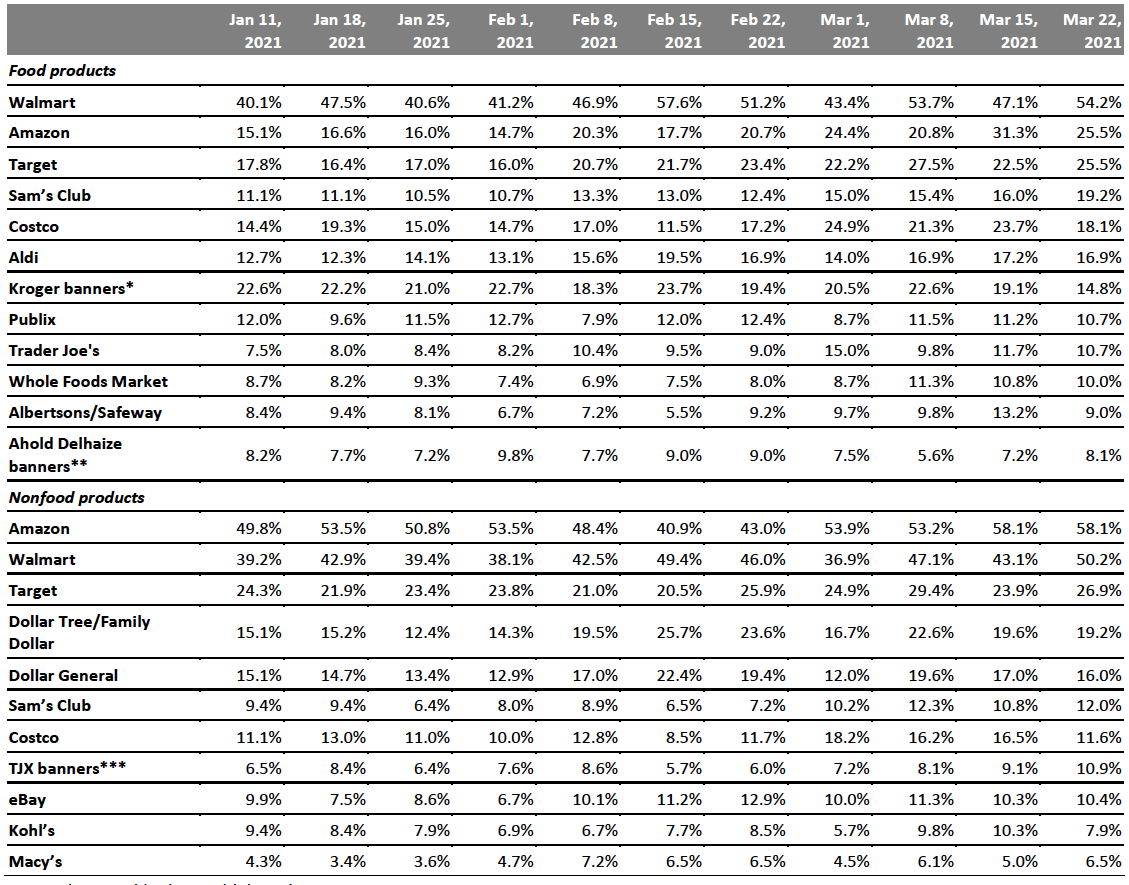 Respondents could select multiple options
Base: US Internet users aged 18+
*Kroger banners include City Market, Fred Meyer, Harris Teeter, King Soopers, Kroger, Ralphs and Smith’s Food & Drug
**Ahold Delhaize banners include Food Lion, Giant, Hannaford and Stop & Shop
***TJX banners include HomeGoods, HomeSense, Marshalls, Sierra and T.J. Maxx
Source: Coresight Research[/caption]
Reviewing Trend Data in Current Purchasing Behavior
What Consumers Are Currently Buying More Of and Less Of
The proportion of consumers buying more of any product due to the coronavirus remained mostly steady this week at 68.8%, compared to 67.9% last week and 61.5% the week before, but still rose to the highest value recorded this year. The proportion that are buying less of any products than pre-crisis increased by more than six percentage points this week to 54.2%, also the highest value recorded this year.
- Buying more in any category and buying less in any category were not mutually exclusive options, so respondents could answer yes to both.
Buying more:
The proportion of consumers buying more essentials due to the pandemic remained strong and stable: the top category consumers reported buying more of this week was once again everyday household products. Personal care and hygiene continued strong performance, with 35.6% of consumers reporting buying more in the category, up from 30.9% last week. The proportion of consumers purchasing more clothing fell this week, but still sits in the low double digits, more than double its value at its nadir in January.
For the third straight week, more consumers reported buying cigarettes and tobacco products. While these changes were all within the margin of error, the streak has not occurred before in this category, which usually shows volatile results.
Buying less:
This week, the highest proportion of consumers recorded so far this year reported buying less of any product due to the pandemic. Some 54.2% of consumers said that they are buying less of any product, up from 47.9% in the prior week. The proportion of consumers reporting buying less due to the pandemic rose in 10 of the 13 categories we surveyed, although these changes were all within the margin of error. Clothing remained the most common category that consumers reported purchasing less of, while the proportion of consumers spending less on beauty products rose above 20% for the first time since January 4.
Ratio of less to more: The ratios of the proportion of respondents buying less to the proportion buying more rose in eight of the 13 options we surveyed this week.
- The ratio of buying less to more for beauty products rose for the second straight week to 2.0. Only clothing had a higher ratio of buying less to more, of 2.7.
- The ratio of buying less to more for furniture fell for the second straight week to 1.6, down from 1.9 last week and 2.0 the week before.
- The ratio of buying less to more for toys and games rose slightly this week, but remained far below the levels we recorded two weeks ago. This week’s ratio came in at 0.6, compared to 0.4 last week and 1.5 the week before.
Figure 6. All Respondents: What They Are Currently Buying More/Less Of Due to the Coronavirus Outbreak (% of Respondents)
[caption id="attachment_125040" align="aligncenter" width="700"]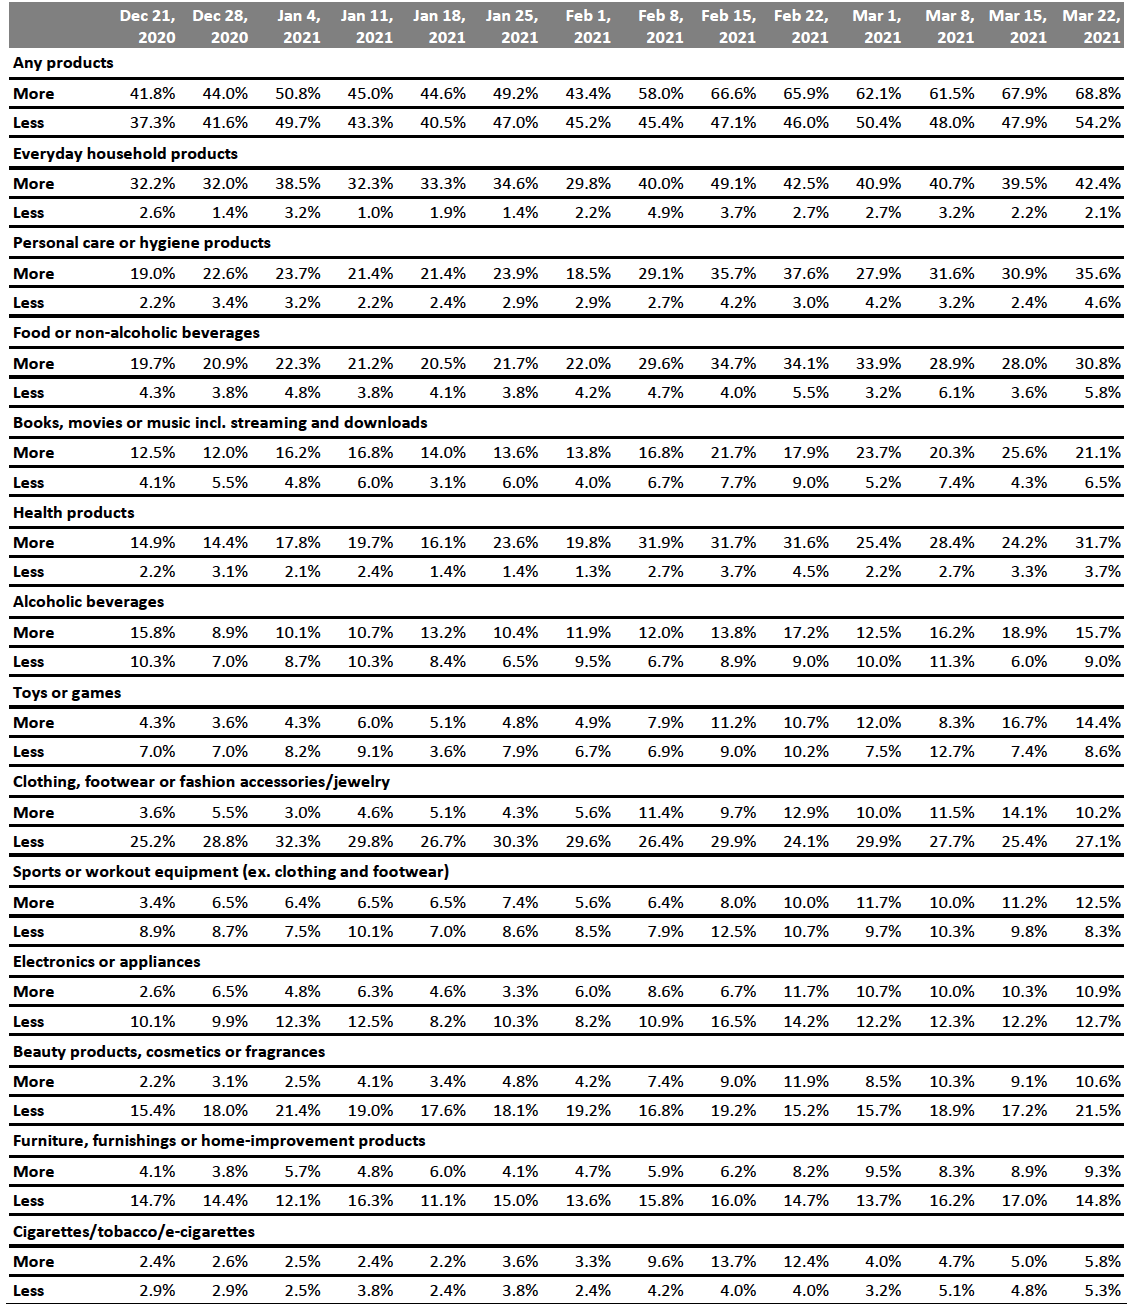 Base: US respondents aged 18+
Source: Coresight Research[/caption]
What We Think
Over several of our recent surveys, we have seen a strong trend toward a return to activities outside of the home as vaccinations continue to roll out across the US. This week, this positive trend stalled, with fewer consumers meeting up with friends and family and more avoiding most types of public areas. Overall, we expect that consumers will continue to return to normal activities, but this week’s survey provides an important reality check on the rate and mode of recovery. Even as more than one in four Americans has now received at least one shot of a Covid-19 vaccine, many of those who have not had the vaccine remain cautious about returning to more normal ways of living and spending, with new daily cases still coming in at more than 70,000. Furthermore, psychological barriers to going back to crowded places, pivots toward online shopping, and simple force of habit are factors that are likely to slow the transition.
Our recurring weekly questions indicated the following:
- Avoidance of Public Places: The proportion of consumers avoiding public places rose slightly this week to 79.6%, a change well within the margin of error. While this does indicate that recovery in consumer behavior will not be a speedy one, retailers can take heart in the fact that the proportion of consumers avoiding shops declined for the third straight week, and more than one in five consumers continued to report buying clothing in-store, far higher than the proportion recorded early in the winter.
- Where Consumers are Shopping: For the first time this week, Aldi overtook Kroger in our rankings of retailers that consumers purchased food products from. Moreover, despite a decline, Dollar Tree and Dollar General continued to see strong shopper numbers. While recovery from the economic damage of the pandemic is certainly underway, the strong performance of these discount retailers indicates that many consumers are still focused on saving on essentials.
- Socializing: Over our three prior surveys, we have seen consumers report socializing at holiday-season levels. This week’s decline came as something of a surprise considering the warming weather and growing rates of vaccination. Despite this week’s results, we expect that consumers are likely to trend back toward socializing and expect to see stronger numbers in this category next week.
Methodology
We surveyed respondents online this year on March 22 (432 respondents), March 15 (418 respondents), March 8, (408 respondents), March 1 (401 respondents), February 22 (402 respondents), February 15 (401 respondents), February 8 (405 respondents), February 1 (449 respondents), January 25 (419 respondents), January 18 (415 respondents), January 11 (416 respondents), January 4 (439 respondents), and last year on December 28 (416 respondents), December 21 (416 respondents), December 15 (438 respondents), December 8 (463 respondents), December 1 (441 respondents), November 24 (460 respondents), November 17 (425 respondents), November 10 (447 respondents), November 3 (418 respondents), October 27 (419 respondents), October 20 (409 respondents), October 13 (401 respondents), October 6 (416 respondents), September 29 (412 respondents), September 22 (422 respondents), September 15 (408 respondents), September 9 (406 respondents), September 2 (402 respondents), August 26 (414 respondents), August 19 (416 respondents), August 12 (400 respondents), August 5 (449 respondents), July 29 (403 respondents), July 22 (404 respondents), July 15 (454 respondents), July 8 (410 respondents), July 1 (444 respondents), June 24 (411 respondents), June 17 (432 respondents), June 10 (423 respondents), June 3 (464 respondents), May 27 (422 respondents), May 20 (439 respondents), May 13 (431 respondents), May 6 (446 respondents), April 29 (479 respondents), April 22 (418 respondents), April 15 (410 respondents), April 8 (450 respondents), April 1 (477 respondents), March 25 (495 respondents) and March 17–18 (1,152 respondents). The results have a margin of error of +/- 5%, with a 95% confidence interval. Not all charted week-over-week differences may be statistically significant.