
albert Chan
What’s the Story?
We present findings from our latest weekly survey of US consumers, undertaken on April 12, 2021. This report includes analysis of the impacts of the Covid-19 pandemic on shopper behaviors. We explore the trends we are seeing from week to week. Click here to read our previous US Consumer Tracker reports.What Consumers Are Buying
- Although essentials including household, personal care, food and health products remained the top categories in which consumers are purchasing more, the proportions of respondents reporting this declined week over week. Notably, the everyday household product category saw a decline of over 10 percentage points.
- After dropping last week, the proportion of consumers buying more electronics climbed again to almost the peak that we saw two weeks ago.
Figure 1a. All Respondents: What They Are Currently Buying More/Less Of Than Before the Coronavirus Outbreak (% of Respondents) [caption id="attachment_126003" align="aligncenter" width="550"]
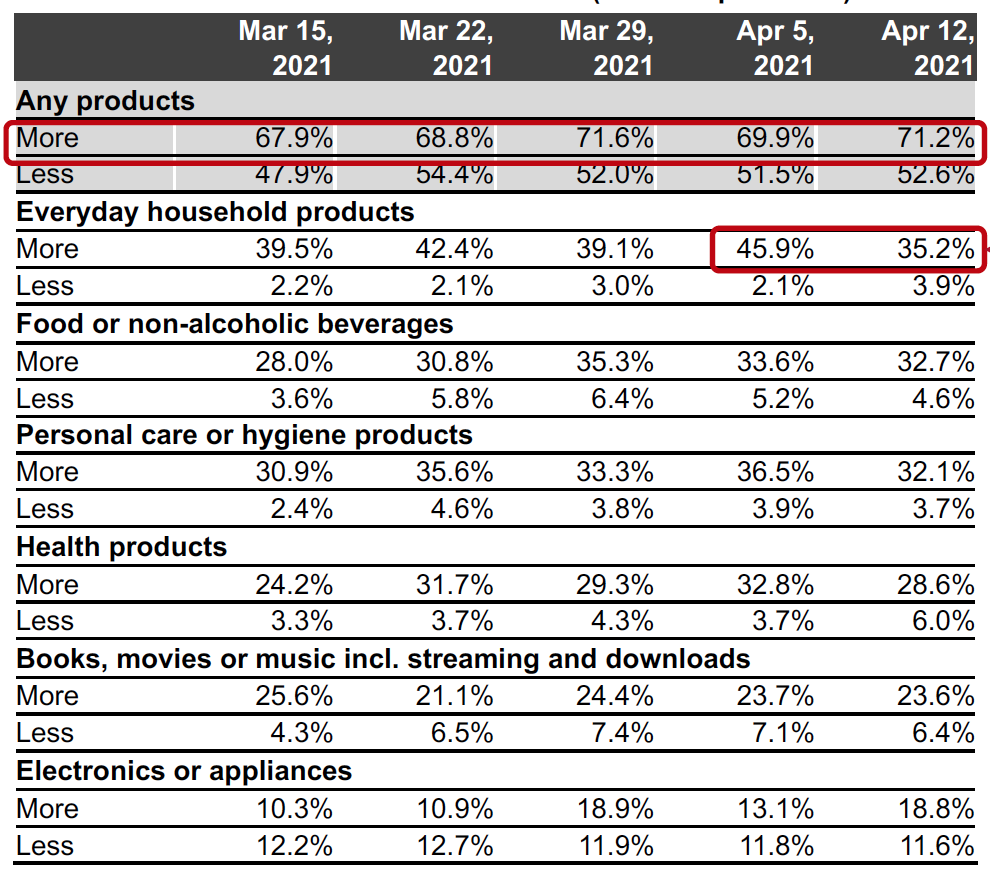 Base: US respondents aged 18+
Source: Coresight Research[/caption]
- Some 17.4% of respondents reported buying more clothing and footwear than before the crisis began—the highest level on record. However, this category also remained the one in which the highest proportion of consumers reported buying less.
- Other discretionary categories, including sports or workout equipment, home and beauty products all saw record-high proportions of consumers reporting buying more this week.
Figure 1b. All Respondents: What They Are Currently Buying More/Less Of Than Before the Coronavirus Outbreak (% of Respondents)
[caption id="attachment_126004" align="aligncenter" width="550"]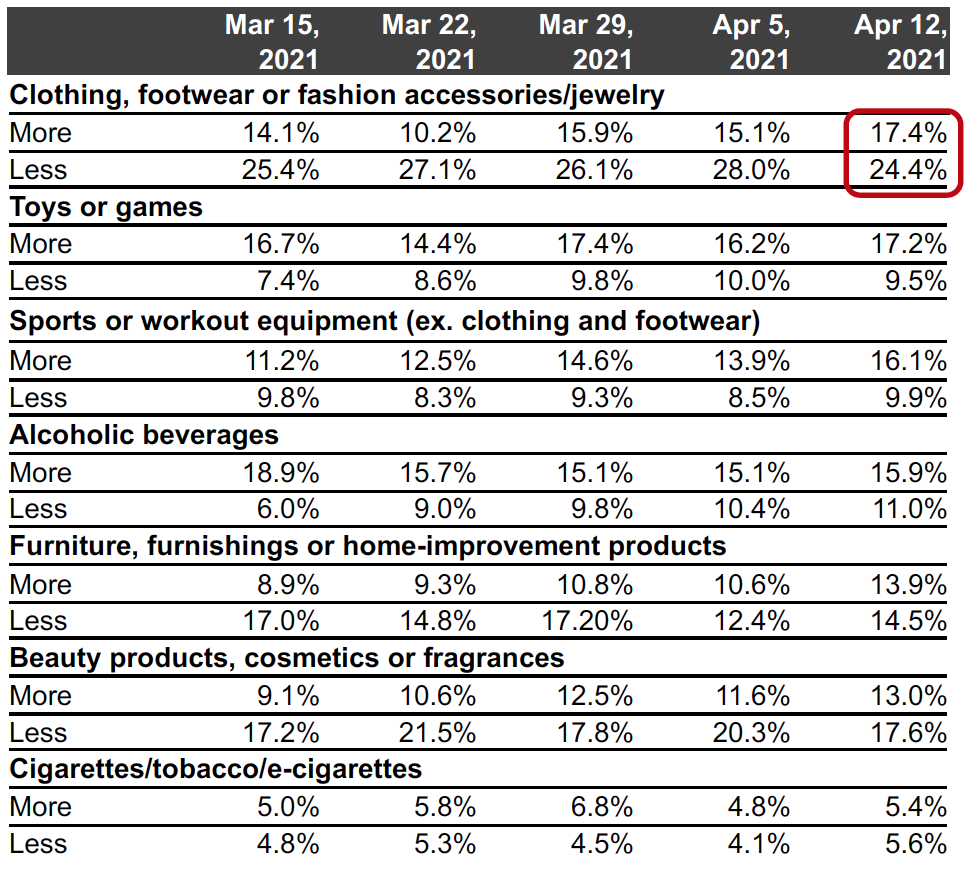 Base: US respondents aged 18+
Source: Coresight Research[/caption]
Ratio of buying less to more: The ratio of the proportion of respondents buying less to the proportion buying more fell in six of the 14 categories.
- The ratio of buying less to more for clothing and footwear went down to a historic low of 1.4.
- We saw a downward trend in the ratio for home products, to a new low of 1.0 this week.
- Electronics purchases remained solid. The ratio for electronics has been below 1.0 for three consecutive weeks.
Figure 2. All Respondents: Selected Ratios of Those Currently Buying Less to Those Currently Buying More Than Before the Coronavirus Outbreak (% of Respondents)
[caption id="attachment_126005" align="aligncenter" width="550"]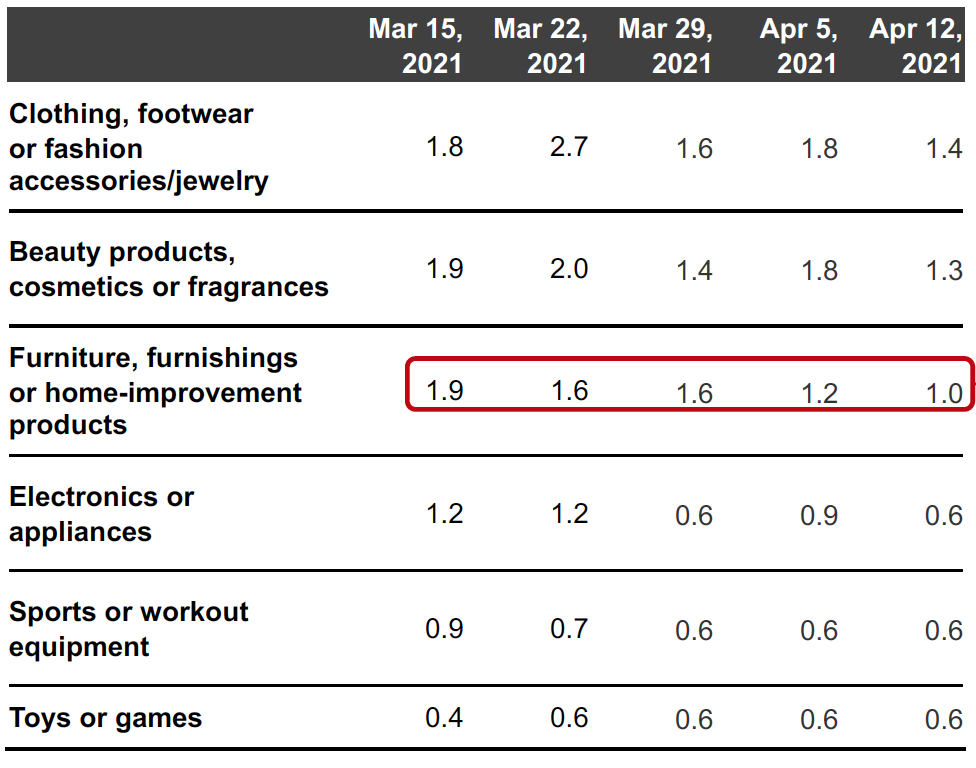 Base: US respondents aged 18+
Source: Coresight Research[/caption]
- In-store purchases of household and personal care products saw week-over-week declines. Some 47.6% had bought household products in-store, down five percentage points from last week. Consumers that had bought personal care products also dropped by seven percentage points, week over week, to 45.1%.
Seven out of the 11 discretionary categories witnessed week-over-week improvements in in-store purchases, although changes were within the margin of error.
- The proportion of consumers reporting buying clothing and footwear in a store reached an all-time high this week, at 25.9%. While online apparel shopping decreased by 5.5 percentage points to 26.7%, the proportion is still higher than the level we saw a month ago.
- We are seeing a near-consistent upward trend in in-store beauty purchases. One-fifth of respondents had bought beauty products in-store in the past two weeks—five percentage points higher than the proportion who made online purchases in the category.
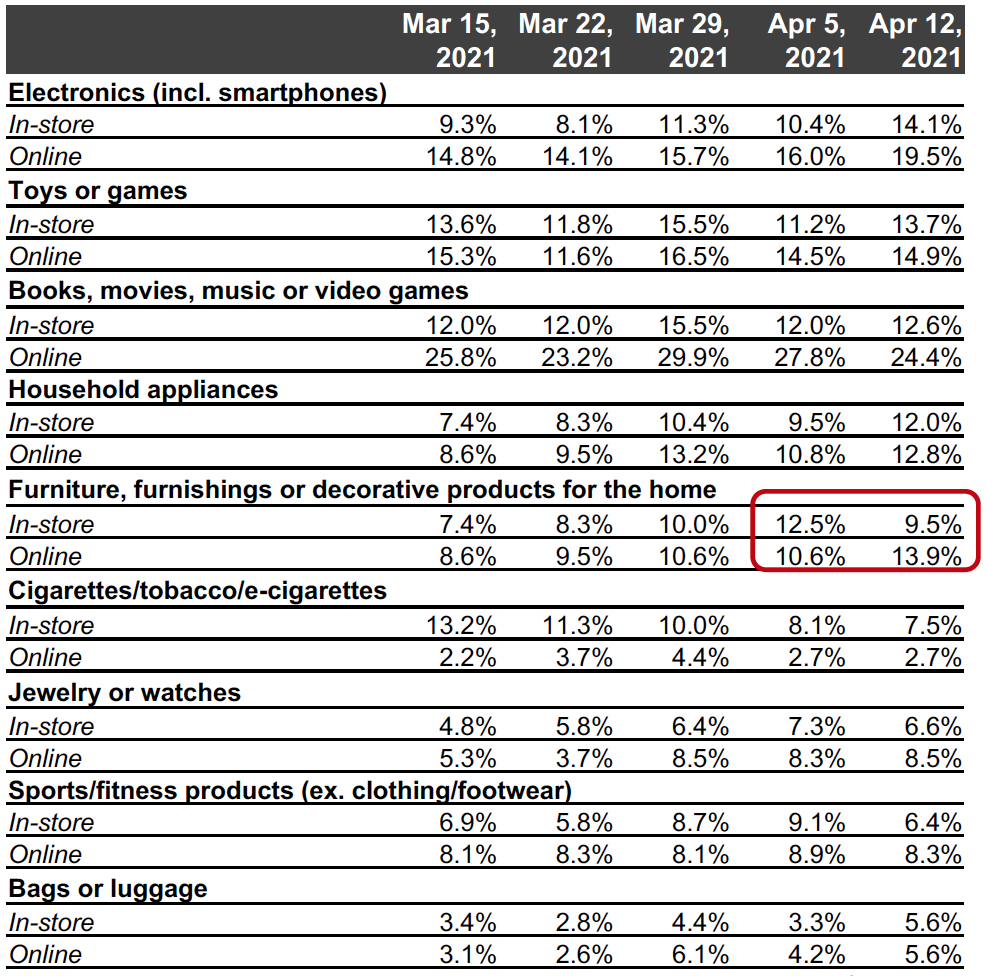
Figure 3a. All Respondents: What They Have Bought In-Store and Online in the Past Two Weeks (% of Respondents)
[caption id="attachment_126006" align="aligncenter" width="550"]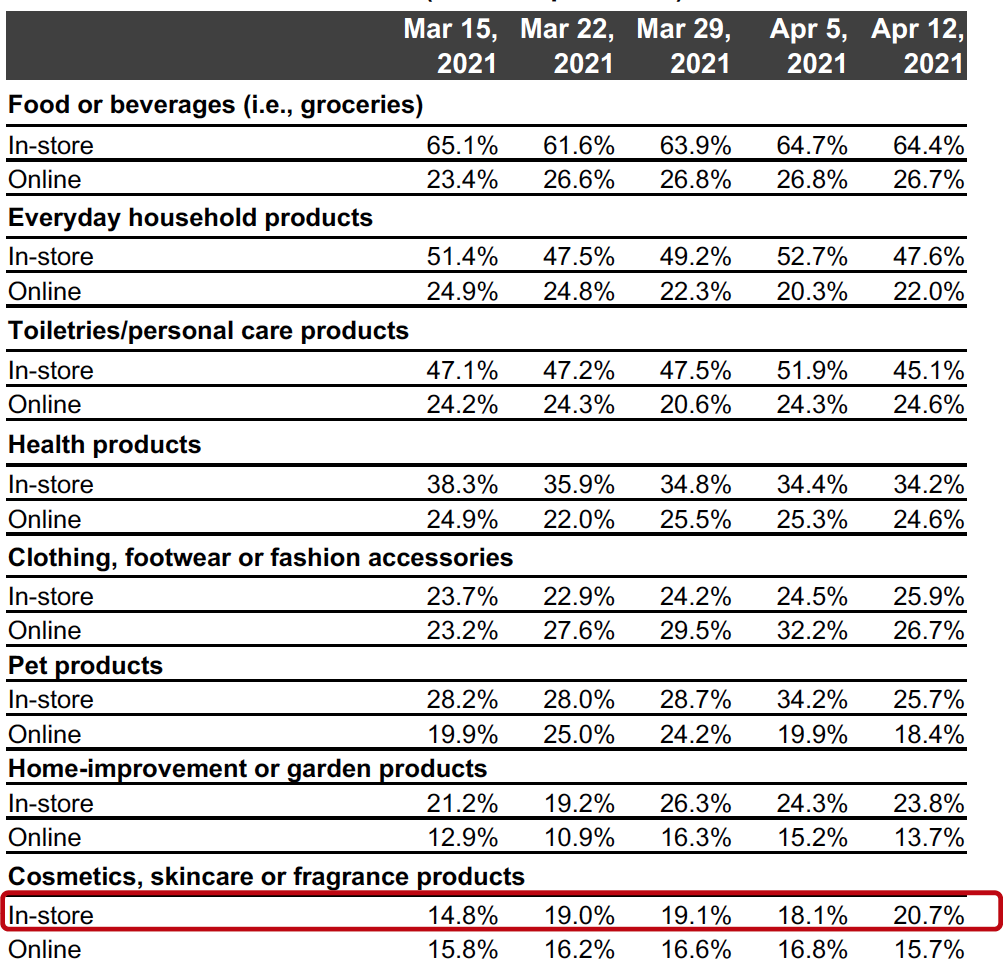 Base: US respondents aged 18+
Source: Coresight Research[/caption]
- Aligned with what we saw from Figure 1a, in-store and online purchases of electronics both surged to record highs this year. Some 14.1% of respondents had bought electronics in-store, and roughly one-fifth had done so online. Compared to the level a month ago, both proportions have increased by almost five percentage points.
- Online purchases for home products increased to the highest level we have ever seen this week, at 13.9%, at the expense of in-store shopping, which declined slightly to 9.5%.
Figure 3b. All Respondents: What They Have Bought In-Store and Online in the Past Two Weeks (% of Respondents) [caption id="attachment_126007" align="aligncenter" width="550"]
 Base: US respondents aged 18+
Source: Coresight Research[/caption]
Which Retailers Consumers Are Buying From
- Seven of the 12 retailers saw slight week-over-week declines for food purchases.
- The proportion of consumers that reported buying food products from Costco reached the highest level since we started asking this question in mid-December last year.
- The proportion of consumers that had bought food products from Aldi returned to the level we saw two weeks ago after peaking last week.
Figure 4. All Respondents: Which Retailers They Have Bought Food Products From in the Past Two Weeks (% of Respondents) [caption id="attachment_126008" align="aligncenter" width="550"]
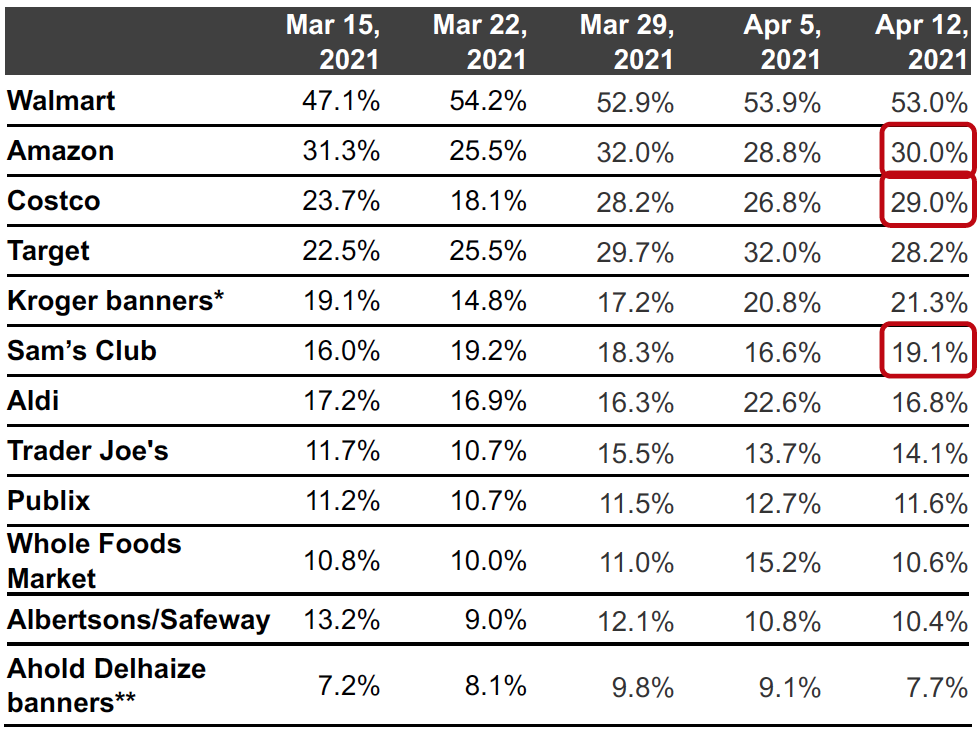 Respondents could select multiple options
Base: US respondents aged 18+
*Kroger banners include City Market, Fred Meyer, Harris Teeter, King Soopers, Kroger, Ralphs and Smith’s Food & Drug
**Ahold Delhaize banners include Food Lion, Giant, Hannaford and Stop & Shop
Source: Coresight Research[/caption]
- Warehouse clubs performed strongly in terms of nonfood products this week. The proportion of consumers that reported buying nonfood products from Costco increased to a record high this week, of 21.3%. The proportion that had bought from Sam’s Club also surged to a new high of 13.5%.
- The proportion of respondents that shopped from TJX banners maintained its peak of 13.7% this week, while purchases from Kohl’s and Macy’s fell slightly week over week.
Figure 5. All Respondents: Which Retailers They Have Bought Nonfood Products From in the Past Two Weeks (% of Respondents) [caption id="attachment_126009" align="aligncenter" width="550"]
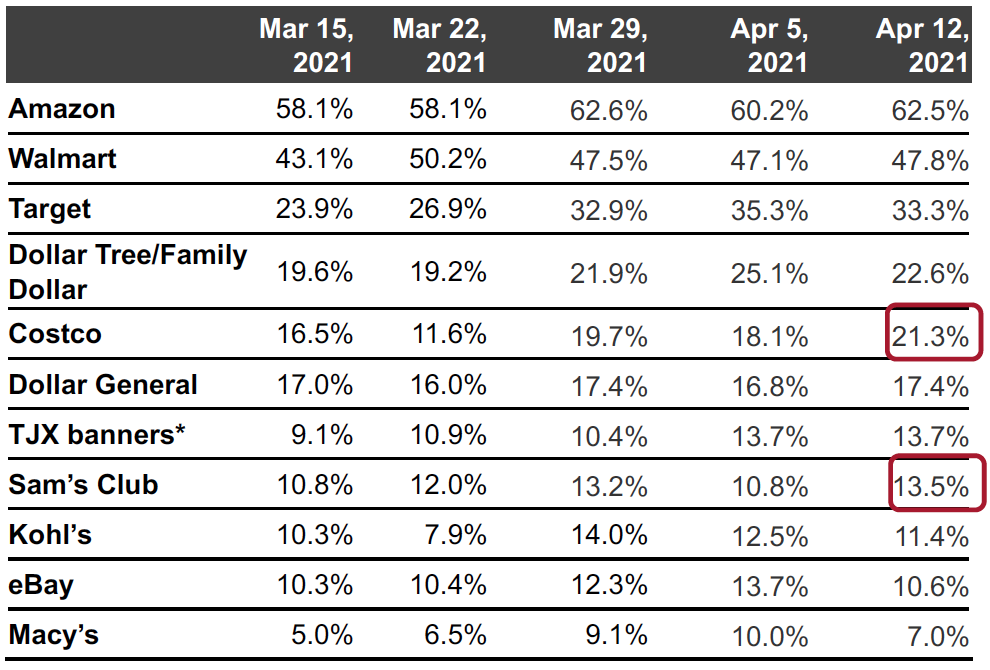 Respondents could select multiple options
Base: US respondents aged 18+
*TJX banners include HomeGoods, Homesense, Marshalls, Sierra and T.J. Maxx
Source: Coresight Research[/caption]
What Consumers Are Doing and Where They Are Going
- Avoidance of any public place tumbled by six percentage points this week to 71.8%—the lowest we have seen in the past 10 months, suggesting that consumers are gradually returning to regular activities. Avoidance decreased in 11 of the 12 options we surveyed.
- International travel saw the highest avoidance rate, of 45.5%.
- Avoidance of shopping locations, including shopping centers/malls and shops in general both declined to historic lows this week. Shops in general saw the largest week-over-week decline of almost eight percentage points.
- Some 43.7% are avoiding foodservice locations—the lowest rate on record for this option.
Figure 6. All Respondents: Public Places That Respondents Are Currently Avoiding (% of Respondents)
[caption id="attachment_126010" align="aligncenter" width="700"]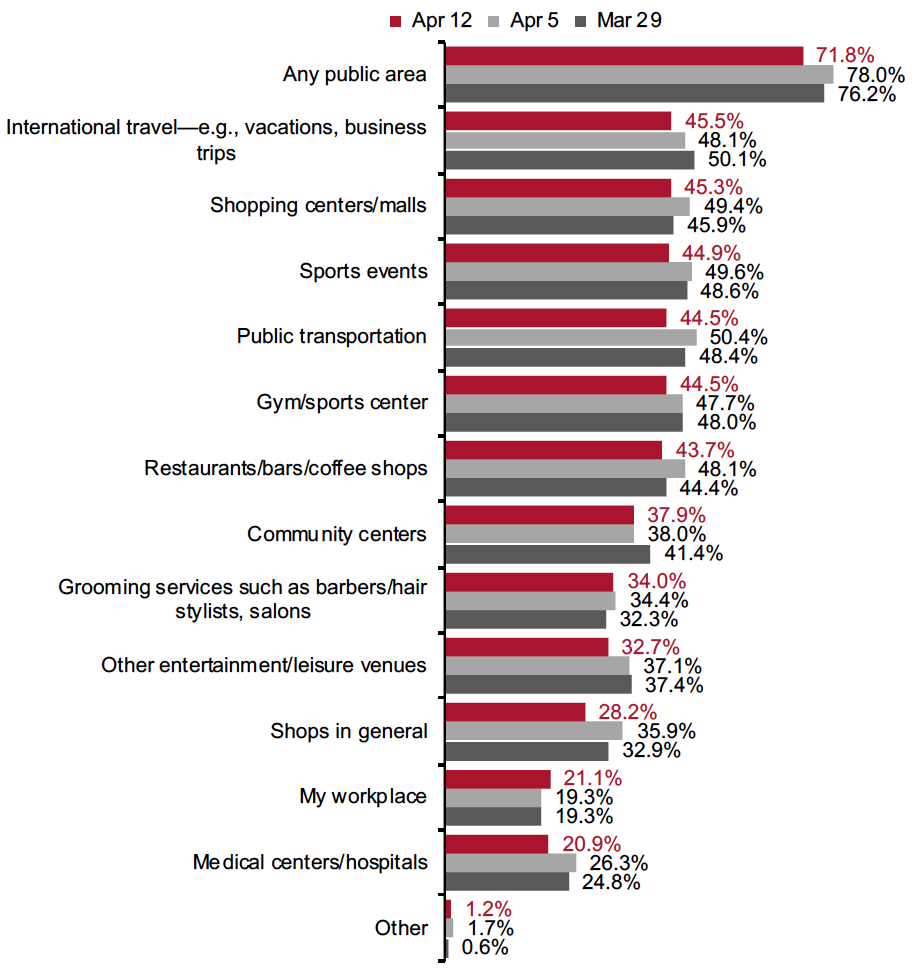 Base: US respondents aged 18+
Source: Coresight Research[/caption]
- The proportion of respondents increased for half of the 12 activities covered, although most changes were within the margin of error.
- In line with the decline of avoidance of foodservice locations (see previous slide), the proportions of consumers that had visited restaurants and coffee shops in the prior two weeks increased slightly to new highs in our latest survey. Compared to a month ago, the proportion that had dined in a restaurant rose 9.5 percentage points.
- Travel has rebounded significantly in the past month. The proportion that had gone on a trip almost doubled from 8.6% on March 15 to 16.8% this week.
Figure 7. All Respondents: What Activities They Have Done in the Past Two Weeks (% of Respondents)
[caption id="attachment_126011" align="aligncenter" width="550"]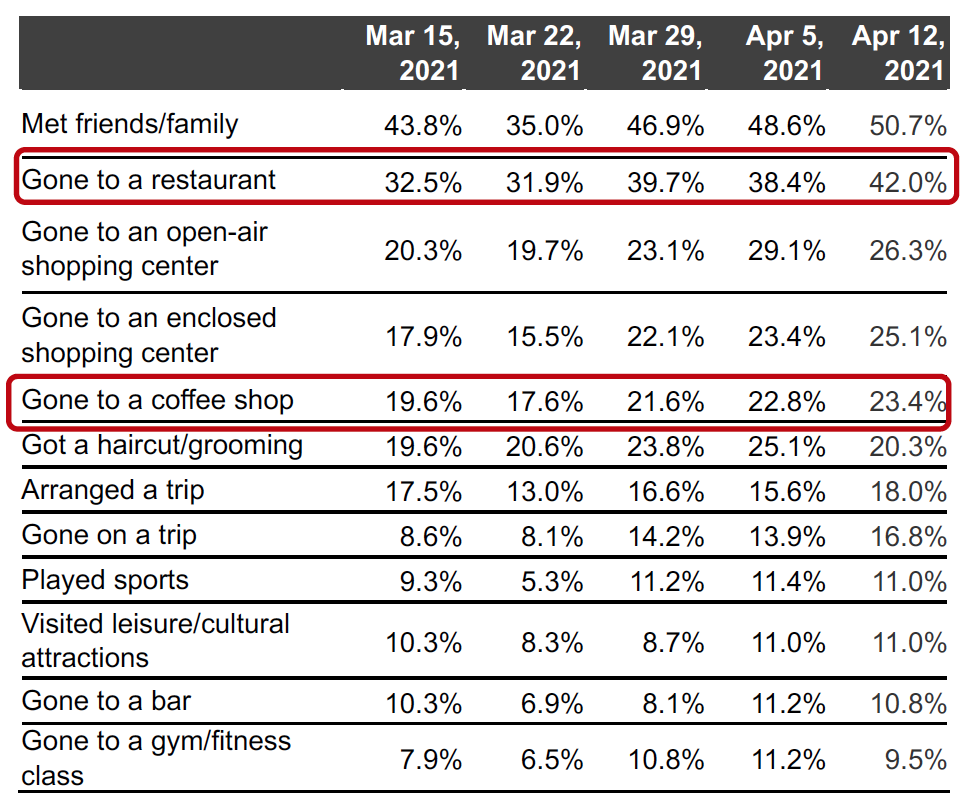 Base: US respondents aged 18+
Source: Coresight Research[/caption]
What We Think
The current Covid-19 situation in the US seems mixed: The pace of vaccinations is accelerating—on average, 3.3 million doses of vaccines are being administered per day, according to the Centers for Disease Control and Prevention—but new Covid-19 cases and hospitalizations have been rising in the country for several weeks.
Despite the mixed state of the current health environment, our latest survey results show a gradual return to normal activities. Notably, consumers are increasingly returning to stores to shop discretionary categories: seven of the 11 discretionary categories witnessed week-over-week improvements in in-store purchases, and the avoidance rates of shopping centers/malls and shops in general dropped to new lows.
The distribution of the third round of stimulus checks has also fueled consumer spending, resulting in solid retail sales growth in March. In addition, weekly jobless claims dived to a new low for the week ended April 10, driving economic recovery.
Our weekly questions indicated the following:
- Avoidance of public places—The proportion of consumers avoiding public places fell to 71.8% this week, the lowest level we have recorded over the last 10 months. Avoidance of shopping centers/malls, shops in general and foodservice locations all dropped to new lows.
- Apparel—Purchases in the apparel category continue to improve. The ratio of buying less to more for clothing and footwear went down to a historic low of 1.4. Apparel is also the top discretionary category in terms of the proportion of consumers reporting that they made purchases in the two weeks prior to our survey. The proportion of respondents that had bought apparel and footwear in a store reached an all-time high of 25.9%, and some 26.7% had made online purchases in this category.
- Online grocery—After fluctuating in February and the first half of March, the proportion of consumers that had bought grocery online has remained at a consistent proportion of 27% in recent weeks.
Methodology
In 2021, we have surveyed US consumers online on April 12 (483 respondents), April 5 (482 respondents), March 29 (529 respondents), March 22 (432 respondents), March 15 (418 respondents), March 8, (408 respondents), March 1 (401 respondents), February 22 (402 respondents), February 15 (401 respondents), February 8 (405 respondents), February 1 (449 respondents), January 25 (419 respondents), January 18 (415 respondents), January 11 (416 respondents) and January 4 (439 respondents).
In 2020, we surveyed US consumers on December 28 (416 respondents), December 21 (416 respondents), December 15 (438 respondents), December 8 (463 respondents), December 1 (441 respondents), November 24 (460 respondents), November 17 (425 respondents), November 10 (447 respondents), November 3 (418 respondents), October 27 (419 respondents), October 20 (409 respondents), October 13 (401 respondents), October 6 (416 respondents), September 29 (412 respondents), September 22 (422 respondents), September 15 (408 respondents), September 9 (406 respondents), September 2 (402 respondents), August 26 (414 respondents), August 19 (416 respondents), August 12 (400 respondents), August 5 (449 respondents), July 29 (403 respondents), July 22 (404 respondents), July 15 (454 respondents), July 8 (410 respondents), July 1 (444 respondents), June 24 (411 respondents), June 17 (432 respondents), June 10 (423 respondents), June 3 (464 respondents), May 27 (422 respondents), May 20 (439 respondents), May 13 (431 respondents), May 6 (446 respondents), April 29 (479 respondents), April 22 (418 respondents), April 15 (410 respondents), April 8 (450 respondents), April 1 (477 respondents), March 25 (495 respondents) and March 17–18 (1,152 respondents).
The results have a margin of error of +/- 5%, with a 95% confidence interval. Not all charted week-over-week differences may be statistically significant.