albert Chan
We discuss select findings from our US consumer survey and compare them to findings from previous weekly surveys.
1. Rebounds in Online Purchases of Some Discretionary CategoriesThe proportion of consumers that reported purchasing clothing and footwear online returned to the level we saw a month ago at 28% this week, up from 18% last week. Contrastingly, in-store purchases of clothing and footwear among respondents fell slightly to 16%.
Some 17% of consumers reported buying cosmetics, skincare or fragrance products online, up seven percentage points from last week. The proportion is very close to the in-store purchase level for such products.
Home-improvement products saw significant upticks in both online and in-store purchases. Some 17% had bought home-improvement products in-store, and 13% had done so in a store.
- See our full report for complete results on what consumers have bought in-store and online in the past two weeks.
Figure 1. Proportion of Respondents That Had Bought Beauty, Clothing and Footwear, Electronics and Home-Improvement Products Online in the Past Two Weeks (% of Respondents)
[caption id="attachment_124255" align="aligncenter" width="770"]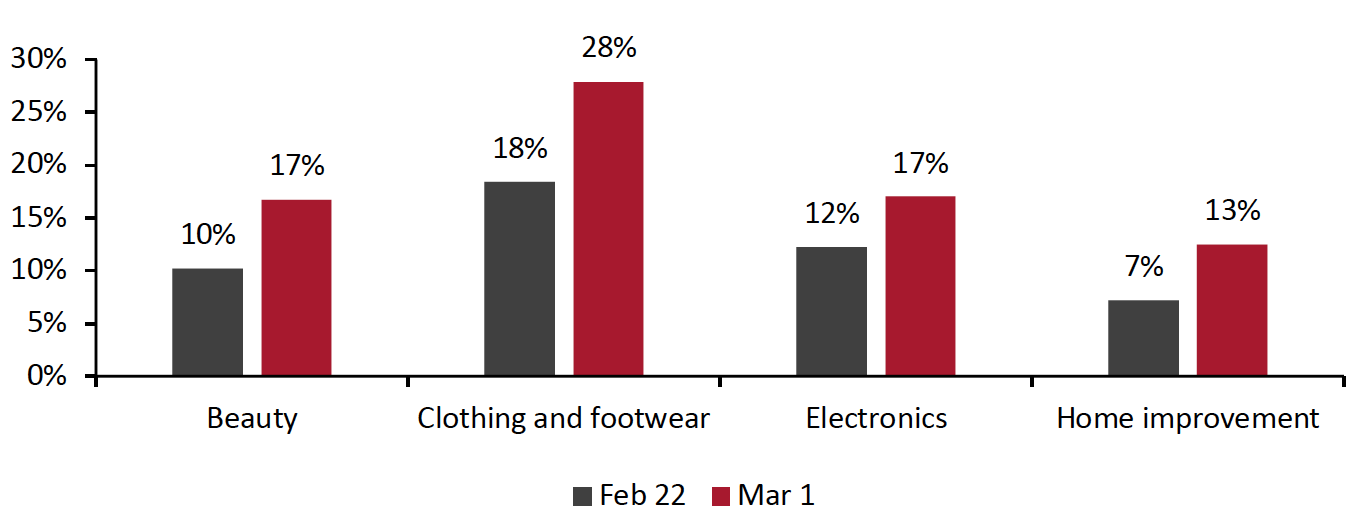 Base: US respondents aged 18+
Source: Coresight Research[/caption]
2. Almost Eight In 10 Are Avoiding Public Places
In this week’s survey, the avoidance rate of any type of public area stood at 79%, broadly level with last week.
- The proportion of consumers avoiding shopping malls/centers has fluctuated over the past few weeks. This week, the proportion bounced back by nine percentage points to 58%, from a low of 49% last week.
- The avoidance rate of shops in general came in at 38%, versus 37% last week. This week’s rate is still well below the average level we recorded in January and February.
- We saw significant increases in the avoidance rate of sporting events, international travel, and entertainment and leisure venues, after declines last week. Some 57% are avoiding international travel, making it the second-most-avoided option.
Figure 2. Proportions of Respondents That Are Currently Avoiding Shopping Centers/Malls and Shops In General (% of Respondents)
[caption id="attachment_124256" align="aligncenter" width="700"]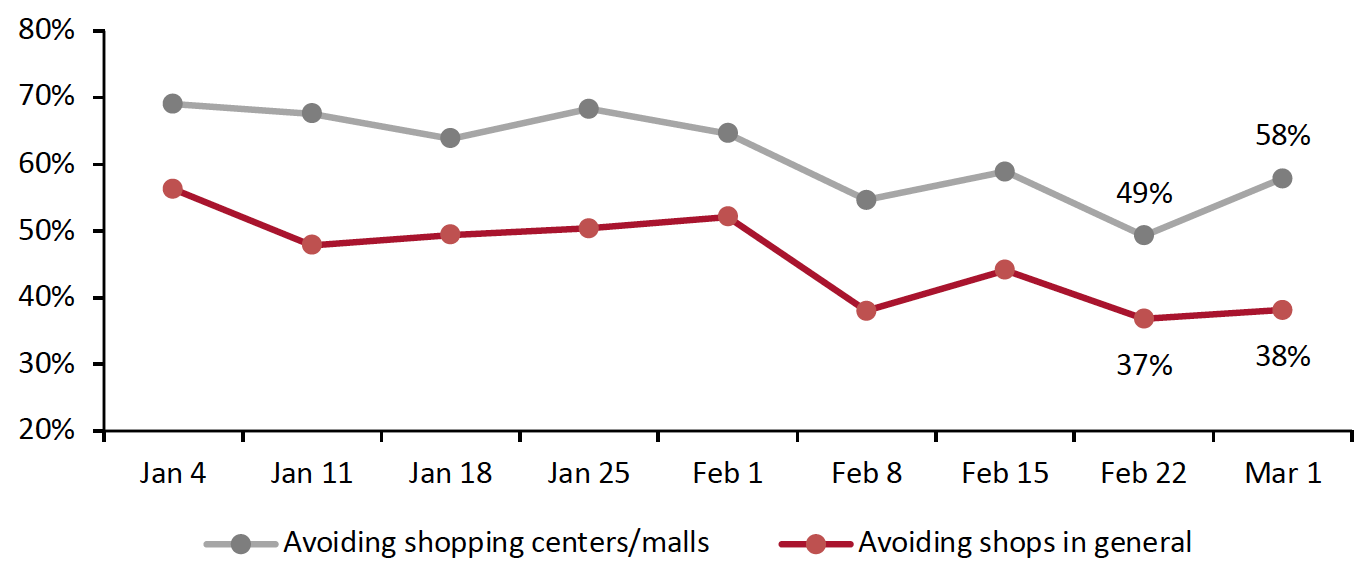 Base: US respondents aged 18+
Source: Coresight Research[/caption]
3. Where Consumers Shopped
Since December 21, 2020, we have asked consumers which retailers they bought from in the two-week period preceding the survey, for both food and nonfood products.
For food purchases:
- Some 43% of consumers reported buying food from Walmart in the past two weeks, down eight percentage points week over week, to roughly the average level we saw in January.
- For the first time in our survey, Costco became the second most-shopped retailer for food products, with one-quarter of consumers purchasing food from the retailer this week, compared to 17% last week. We also recorded an increase in shoppers purchasing nonfood items at Costco.
- Trader Joe’s, which is known for primarily selling its own private labels, saw a week-over-week increase of six percentage points in the proportion of shoppers purchasing food from the retailer week. Some 15% had bought food products there, the highest level we have recorded in our survey.
For nonfood purchases:
- Some 18% reported buying nonfood products from Costco, the highest recorded so far this year and roughly the level we saw over the 2020 holiday season.
- Department stores continue to see low traffic: the proportion of consumers who made nonfood purchases at Kohl’s fell to a new low of 6% this week. Moreover, only 5% of respondents had bought nonfood products from Macy’s.