
albert Chan
What’s the Story?
This report presents the results of Coresight Research’s latest weekly survey of US consumers, undertaken on March 1. The report includes analysis of new questions on shopper behaviors and the impacts of the coronavirus outbreak. We explore the trends we are seeing from week to week, following previous weekly surveys.
What Shoppers Are Buying and Which Retailers They Are Buying From
What Consumers Bought In-Store and Online
This week, we saw slight increases in purchases of essentials after a decline last week. Online purchases rebounded for a few discretionary categories, after falling last week.
- Overall, the proportion of consumers that bought food and beverages bounced back following a significant decline last week. Some 71.8% had done so in-store—roughly the level we saw three weeks ago—versus 67.4% last week. Online food and beverage purchases jumped back by six percentage points this week, to 25.7%. However, this is still lower than the average of almost three in 10 we saw in December 2020 and January this year.
- For other essentials, some 52.4% had bought household products in-store, up five percentage points from 47.5% last week. The proportion making online purchases in the category online also increased this week, to 22.4%—up 6.5 percentage points week over week. Online purchases for pet products surged by 9.5 percentage points to 24.2% this week, the highest proportion we have seen this year.
- The proportion of consumers that reported purchasing clothing and footwear online returned to the level we saw a month ago, at 27.9% this week, after declining for the past four weeks. On the other hand, in-store shopping for clothing and footwear fell slightly to 16.2%.
- Other discretionary categories saw an uptick in purchases this week: Some 17.2% had bought beauty products in-store and 16.7% had done so online, which is the highest level recorded this year in our survey. Moreover, after sliding for the past four weeks, the proportion of consumers reporting that they had purchased home-improvement products in-store rose by 7.5 percentage points to 17.2%, and the proportion that had bought such products online also increased, by five percentage points to 15.3%.
Figure 1. All Respondents: What They Have Bought In-Store and Online in the Past Two Weeks (% of Respondents)
[caption id="attachment_124235" align="aligncenter" width="700"]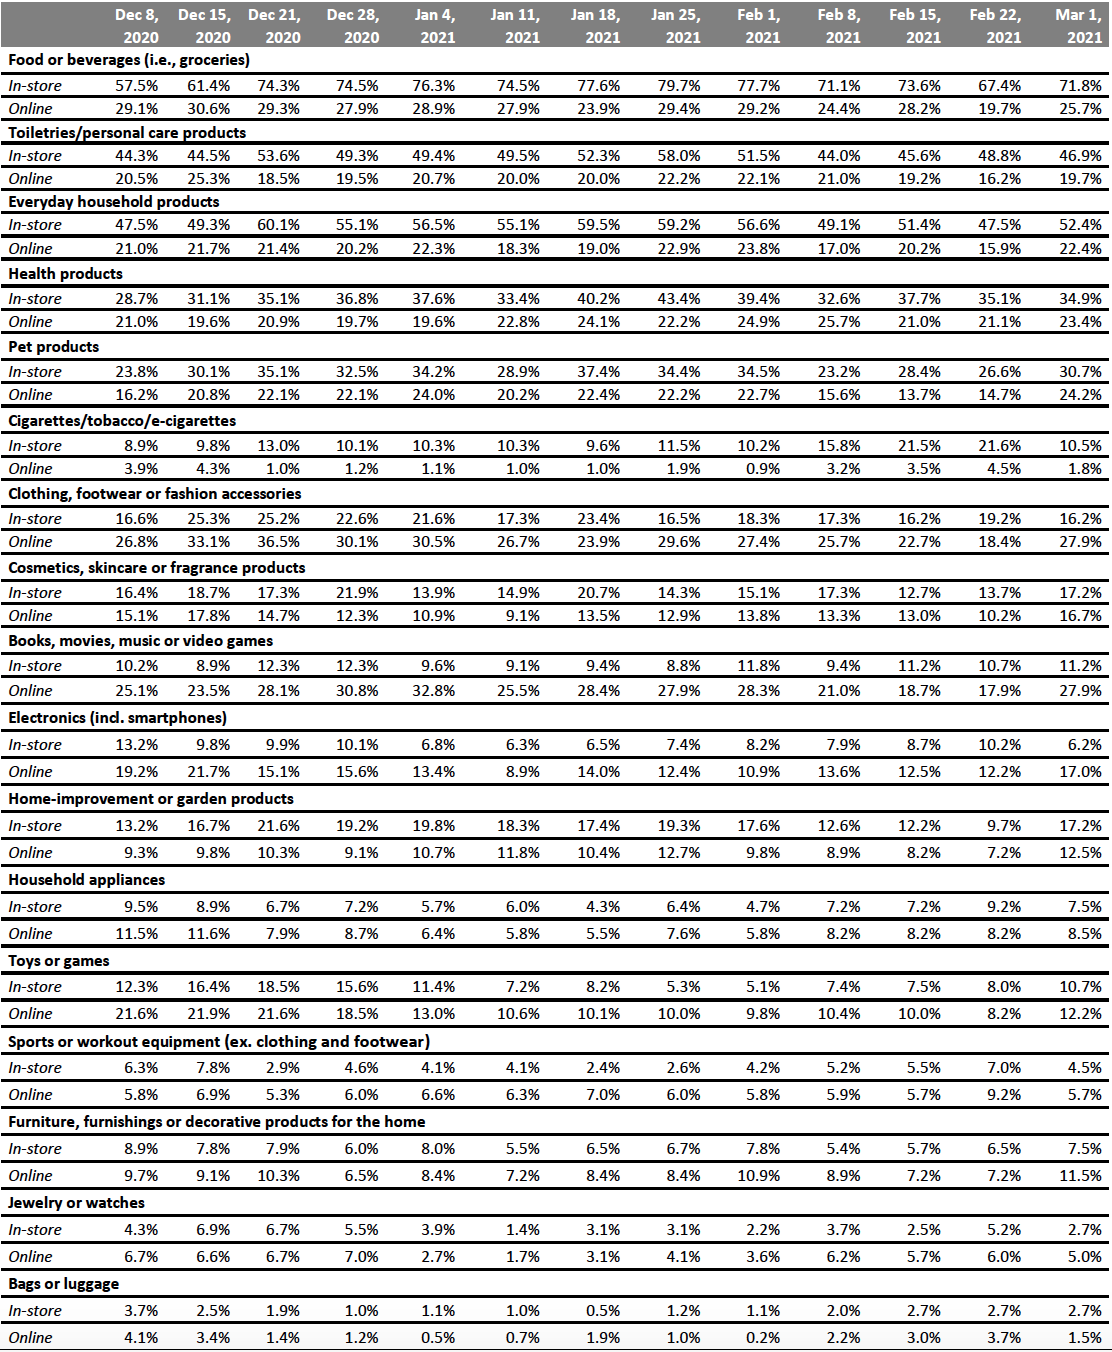 Respondents could select multiple options
Base: US respondents aged 18+
Source: Coresight Research[/caption]
Which Retailers Consumers Purchased Food and Nonfood Products From
Since December 21, 2020, we have asked consumers which retailers they bought from in the two-week period preceding the survey, for both food and nonfood products.
For food purchases:
- The proportion of consumers buying food from Walmart in the past two weeks dropped eight percentage points week over week to roughly the average level we saw in January.
- For the first time in our survey, Costco became the second-most-shopped retailer for food products, with one-quarter of consumers purchasing food products from the retailer this week. We also recorded an increase in nonfood shopper numbers at Costco as well, which we discuss below.
- Trader Joe’s, which is known for primarily selling its own private label products, saw a week-over-week increase of six percentage points in food products purchases among respondents—reaching the highest level recorded in our survey.
For nonfood purchases:
- Some 18.2% reported buying nonfood products from Costco, the highest proportion recorded this year and roughly the level we saw in the holiday season last year.
- Department stores continue to see low traffic: the proportion of consumers who shopped at Kohl’s fell to a low of 5.7% this week. Moreover, just 4.5% had bought nonfood products from Macy’s.
Figure 2. All Respondents: Which Retailers They Have Bought Food Products From and Which Retailers They Have Bought Nonfood Products From in the Past Two Weeks (% of Respondents)
[caption id="attachment_124236" align="aligncenter" width="700"]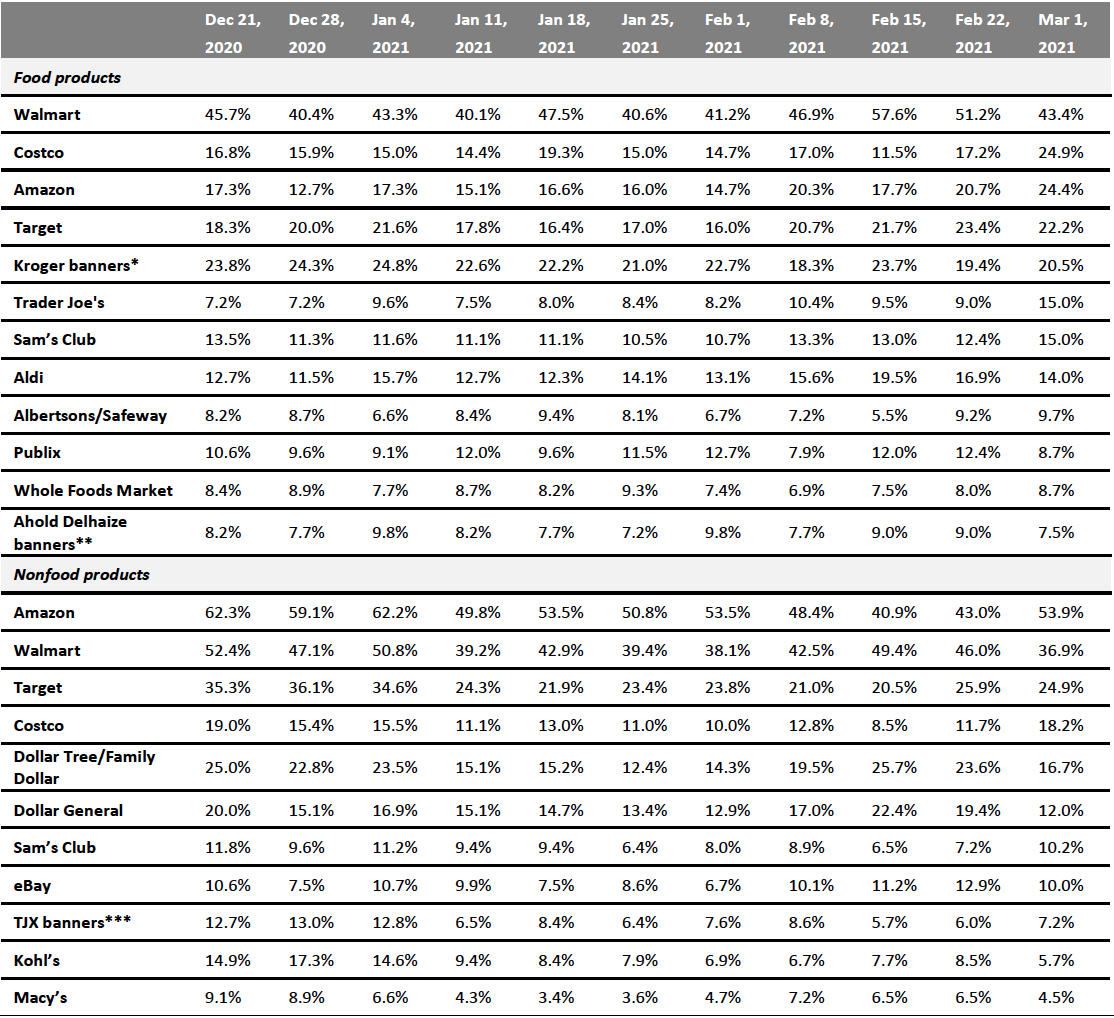 Respondents could select multiple options
Base: US Internet users aged 18+
*Kroger banners include City Market, Fred Meyer, Harris Teeter, King Soopers, Kroger, Ralphs and Smith’s Food & Drug
**Ahold Delhaize banners include Food Lion, Giant, Hannaford and Stop & Shop
***TJX banners include HomeGoods, HomeSense, Marshalls, Sierra and T.J. Maxx
Source: Coresight Research[/caption]
What Shoppers Are Doing and Where They Are Going
Consumers Getting a Haircut or Grooming Service Reaches New High
Complementing our questions about purchases in the past two weeks, each week, we ask consumers what activities they have done in the past two weeks. This week, the proportion of respondents rose for half of the twelve activities we asked about.
- The proportion of consumers that had visited an open-air shopping center jumped this week, after remaining below 20% over the past three weeks. Some 21.5% had visited such locations, up five percentage points from 16.7% last week. Contrastingly, visits to an enclosed shopping center dropped to around the level recorded two weeks ago, at 15.2%.
- The proportion of consumers that reported getting a haircut or grooming service spiked by six percentage points week over week, coming in at the highest level recorded in our survey this year. This is aligned with the declining trend we saw in avoidance of grooming services, which we discuss in the next section.
Figure 3. All Respondents: What Activities They Have Done in the Past Two Weeks (% of Respondents)
[caption id="attachment_124237" align="aligncenter" width="700"]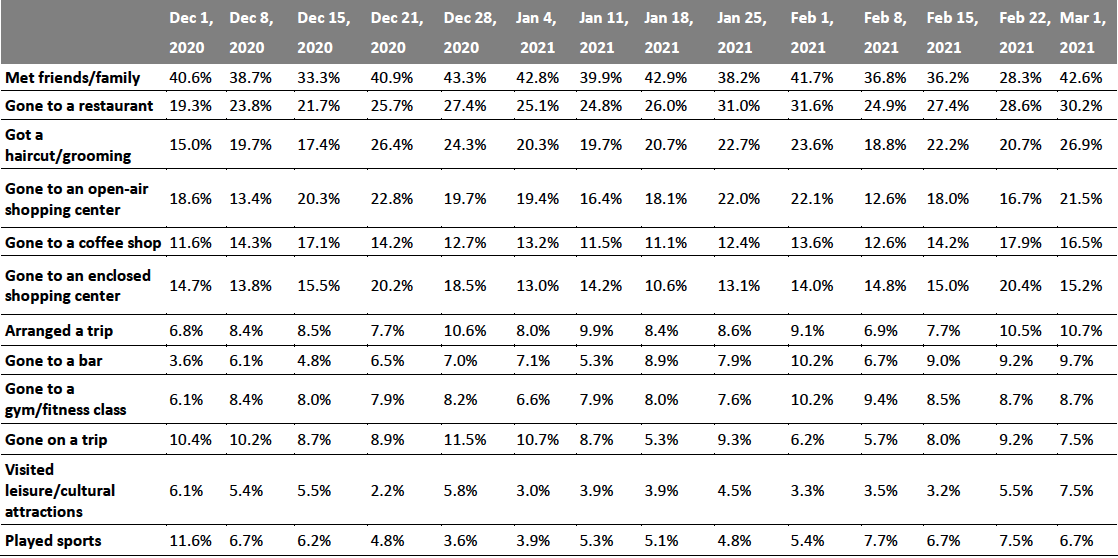 Respondents could select multiple options
Base: US respondents aged 18+
Source: Coresight Research[/caption]
Almost Eight in 10 Are Avoiding Public Places
This week, the avoidance rate of any type of public area came in at 79.3%, broadly level with last week. For 10 of the 13 location options provided, rates of avoidance increased this week, although some changes were within the margin of error.
- The proportion of consumers avoiding shopping malls/centers has fluctuated over the past few weeks. This week, the proportion bounced back by almost nine percentage points to 57.9%, from a low of 49.3% last week.
- At 38.2%, the avoidance rate of shops in general is still well below the average level we recorded in January and February.
- We saw significant increases in the avoidance rate of sports events, international travel and other entertainment and leisure venues, following declines last week.
Figure 4. All Respondents: Public Places That Respondents Are Currently Avoiding (% of Respondents) [caption id="attachment_124238" align="aligncenter" width="700"]
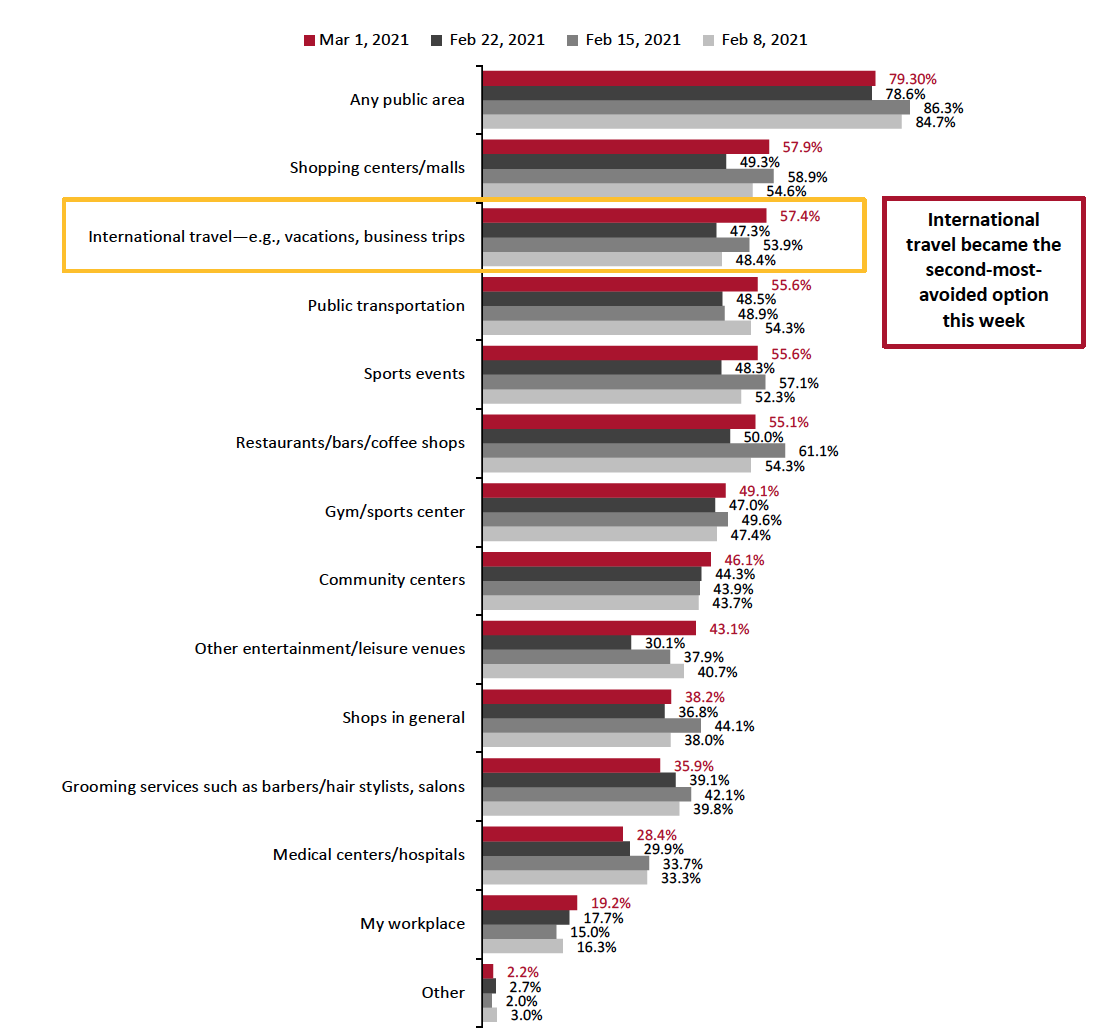 Respondents could select multiple options
Base: US respondents aged 18+
Source: Coresight Research[/caption]
Reviewing Trend Data in Current Purchasing Behavior
What Consumers Are Currently Buying More Of and Less Of
The proportion of consumers buying more of any product due to the coronavirus crisis has been declining in recent weeks, although it remains at an elevated level compared to January. This week, 62.1% of consumers reported purchasing more of any product and those buying less of any product for the same reason increased slightly to 50.4%.
- Buying more in any category and buying less in any category were not mutually exclusive options, so respondents could answer yes to both.
Buying more:
This week, fewer consumers reported that they are buying more for eight of the 13 category options. Essentials remained the most-purchased categories, although all except food witnessed week-over-week declines. Personal care saw the largest drop, of 10 percentage points.
For discretionary products, the proportion of consumers buying more books and music (including streaming and downloads) reached the highest level this year, at 23.7%. Beauty, clothing and footwear, and electronics all saw slight week-over-week declines.
The upward trend in consumers buying more sports or workout equipment is notable. Some 11.7% are buying more in such category—the highest proportion we have recorded this year, despite the week-over-week decline in the proportion of consumers that reported buying sports or workout equipment, as shown in Figure 1. Broken down by age group, the youngest consumer group are driving the purchases, with almost three in 10 buying more sports or workout equipment this week, as shown in Figure 6. We also saw an upward trend among Gen Z consumers (those aged 45–60), which could be fueled by their increasing interest in leading a healthy lifestyle.
Buying less:
The proportion of consumers making fewer discretionary purchases remained relatively high this week: Almost 30% are buying less in clothing and footwear than pre-crisis, down from 24.1% last week. This level is roughly the same as what our survey recorded in January. Other categories including electronics, home and toys all saw week-over-week improvements in purchases, although the changes were within the margin of error.
Ratio of less to more: The ratios of the proportion of respondents buying less to the proportion buying more fell in seven of the 13 options we surveyed this week, mostly in discretionary categories.
- The ratio for clothing and footwear returned to that of two weeks ago, at 3.0, from 1.9 last week.
- The ratio of buying less to more for electronics has been declining over recent weeks. This week, the ratio came in at 1.1, from 1.2 last week and 2.4 two weeks ago.
- The ratio for beauty stood at 1.9, up from the lowest ratio of 1.3 last week , but still below the 2.1 two weeks ago.
- The ratio for home categories reached the lowest level seen this year at 1.4 this week, compared to 1.8 last week and 2.6 two weeks ago.
- For the first time this year, the ratio for sports or workout equipment came in below 1, meaning that the proportion of consumers that are buying more in this category exceeds those that are buying less. The ratio fell to 0.8 this week, from 1.1 last week and 1.6 two weeks ago.
Figure 5. All Respondents: What They Are Currently Buying More/Less Of Due to the Coronavirus Outbreak (% of Respondents)
[caption id="" align="aligncenter" width="700"]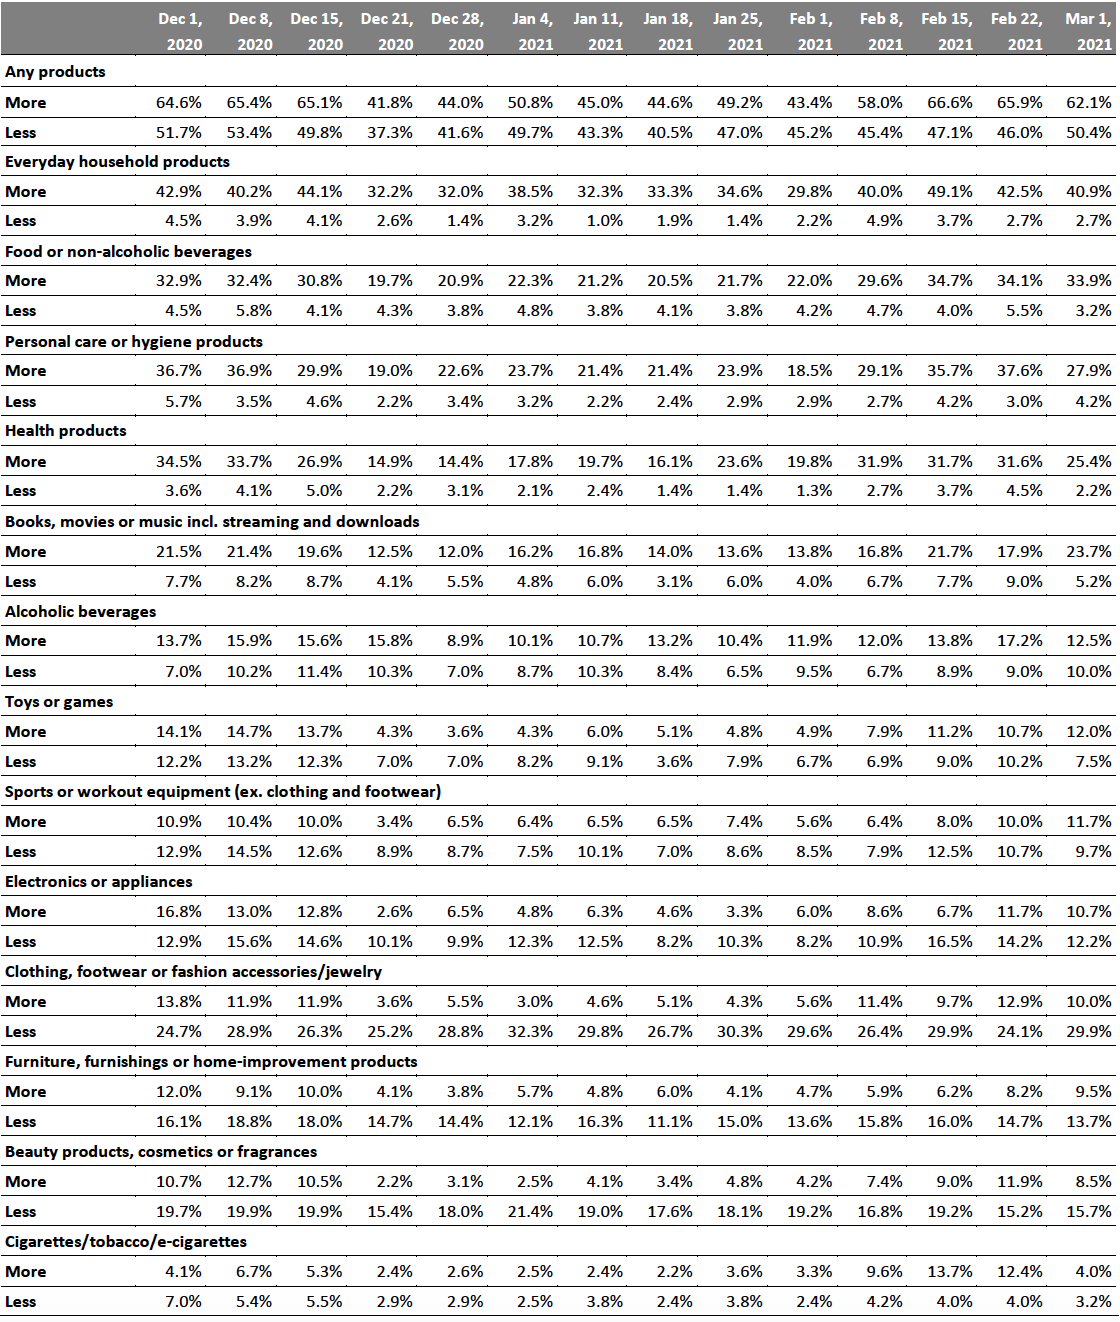 Base: US respondents aged 18+
Source: Coresight Research[/caption]
Figure 6. All Respondents: Proportions of Respondents That Are Buying More Sports or Workout Equipment Than They Used To, by Age Group (% Of Respondents)
[caption id="attachment_124240" align="aligncenter" width="550"]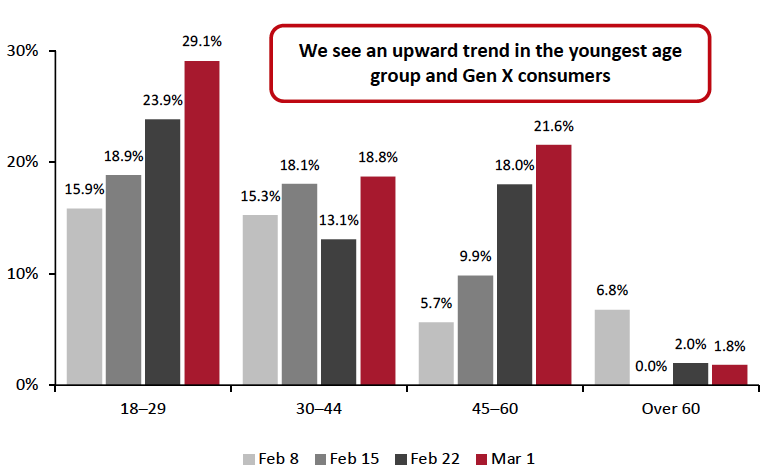 Base: US respondents aged 18+
Source: Coresight Research[/caption]
What We Think
In recent weeks, we have seen fluctuations in multiple metrics, but long-term trends still suggest that consumers are becoming more comfortable in returning to normal activities. Discretionary purchases have improved compared to the beginning of the year, but categories such as apparel remain weak.
On February 27, the US House of Representatives passed a third round of stimulus checks of up to $1,400 per person. At the time of writing, the Senate has not yet voted on the third stimulus checks, but if it passes in the Senate, consumers could receive the stimulus as early as the weekend of March 6. The third stimulus check may help to lift consumers’ discretionary spending in later weeks, although to a limited extent, as consumers appear to be prioritizing stimulus checks on essential spending, according to our February 8 survey.
Our recurring weekly questions indicated the following:
- Avoidance of Public Places: The proportion of consumers avoiding public places of any kind remained broadly level, at 79.3% this week. Shopping malls/centers remained the most-avoided public places, with 57.9% of consumers avoiding such locations. In a separate survey question, more consumers reported visiting an open-air shopping center, while fewer had gone to an enclosed shopping center. Although avoidance in shopping centers/malls returned to an elevated level this week, avoidance of shops in general is still relatively low, at 38.2%.
- Apparel: This week, in-store purchases of clothing and footwear fell slightly after the uptick last week. Moreover, the ratio of consumers buying less apparel to those buying more rose to 3.0 this week, from 1.9 last week. By channel, online apparel shopping reverted to the level we saw a month ago, at 27.9%, surpassing in-store apparel purchases, which dropped to 16.2%.
- Grocery: Purchases of food and beverages bounced back this week, both in-store and online. Some 71.8% reported buying food and beverages in-store and the proportion buying groceries online jumped six percentage points to roughly one-quarter. However, this is still below the level of almost 30% that we have seen consistently across December 2020 and in January this year.
Methodology
We surveyed respondents online on March 1 (401 respondents), February 22 (402 respondents), February 15 (401 respondents), February 8 (405 respondents), February 1 (449 respondents), January 25 (419 respondents), January 18 (415 respondents), January 11 (416 respondents), January 4 (439 respondents), December 28 (416 respondents), December 21 (416 respondents), December 15 (438 respondents), December 8 (463 respondents), December 1 (441 respondents), November 24 (460 respondents), November 17 (425 respondents), November 10 (447 respondents), November 3 (418 respondents), October 27 (419 respondents), October 20 (409 respondents), October 13 (401 respondents), October 6 (416 respondents), September 29 (412 respondents), September 22 (422 respondents), September 15 (408 respondents), September 9 (406 respondents), September 2 (402 respondents), August 26 (414 respondents), August 19 (416 respondents), August 12 (400 respondents), August 5 (449 respondents), July 29 (403 respondents), July 22 (404 respondents), July 15 (454 respondents), July 8 (410 respondents), July 1 (444 respondents), June 24 (411 respondents), June 17 (432 respondents), June 10 (423 respondents), June 3 (464 respondents), May 27 (422 respondents), May 20 (439 respondents), May 13 (431 respondents), May 6 (446 respondents), April 29 (479 respondents), April 22 (418 respondents), April 15 (410 respondents), April 8 (450 respondents), April 1 (477 respondents), March 25 (495 respondents) and March 17–18 (1,152 respondents). The results have a margin of error of +/- 5%, with a 95% confidence interval. Not all charted week-over-week differences may be statistically significant.