
albert Chan
What’s the Story?
This report presents the results of Coresight Research’s latest weekly survey of US consumers, undertaken on January 25. The report includes analysis of new questions on shopper behaviors and the impacts of the coronavirus outbreak. We explore the trends we are seeing from week to week, following previous weekly surveys.
What Shoppers Are Buying and Which Retailers They Are Buying From
For 2021, Coresight Research has introduced new questions on what shoppers are buying and what retailers they are buying from. Week by week, we will track:
- What product categories they had purchased in-store in the past two weeks.
- What product categories they had purchased online in the past two weeks.
- Which retailers they had bought any food products from in the past two weeks.
- Which retailers they had bought any nonfood products from in the past two weeks.
What Consumers Bought In-Store and Online
We recorded an increase in online shopper numbers for apparel and grocery categories this week.
- The proportion of respondents buying clothing online spiked more than five percentage points after falling last week.
- The proportion of respondents buying food and beverages online rebounded closer to holiday levels this week after declining last week, with a rise of 5.5 percentage points to 29.4%. We also saw week-over-week increases in online purchases of other grocery-store categories such as household products and personal care products (albeit those changes were within the margin of error).
- In-store purchases of clothing and footwear, and cosmetics, fragrance and skincare products fell sharply this week, dropping by more than six percentage points each—a disappointing reversal after last week’s survey saw the ratio of in-store to online purchases for clothing and footwear reach 1.0 for the first time.
- In-store purchases of toiletries and personal care products rose 5.7%, representing the second straight week of solid growth for the category. This week, 58.0% of consumers reported purchasing toiletries/personal care products in stores, more than 13 percentage points higher than the percentage reported in the December 15 survey.
Figure 1. All Respondents: What They Have Bought In-Store and Online in the Past Two Weeks (% of Respondents) [caption id="attachment_122548" align="aligncenter" width="700"]
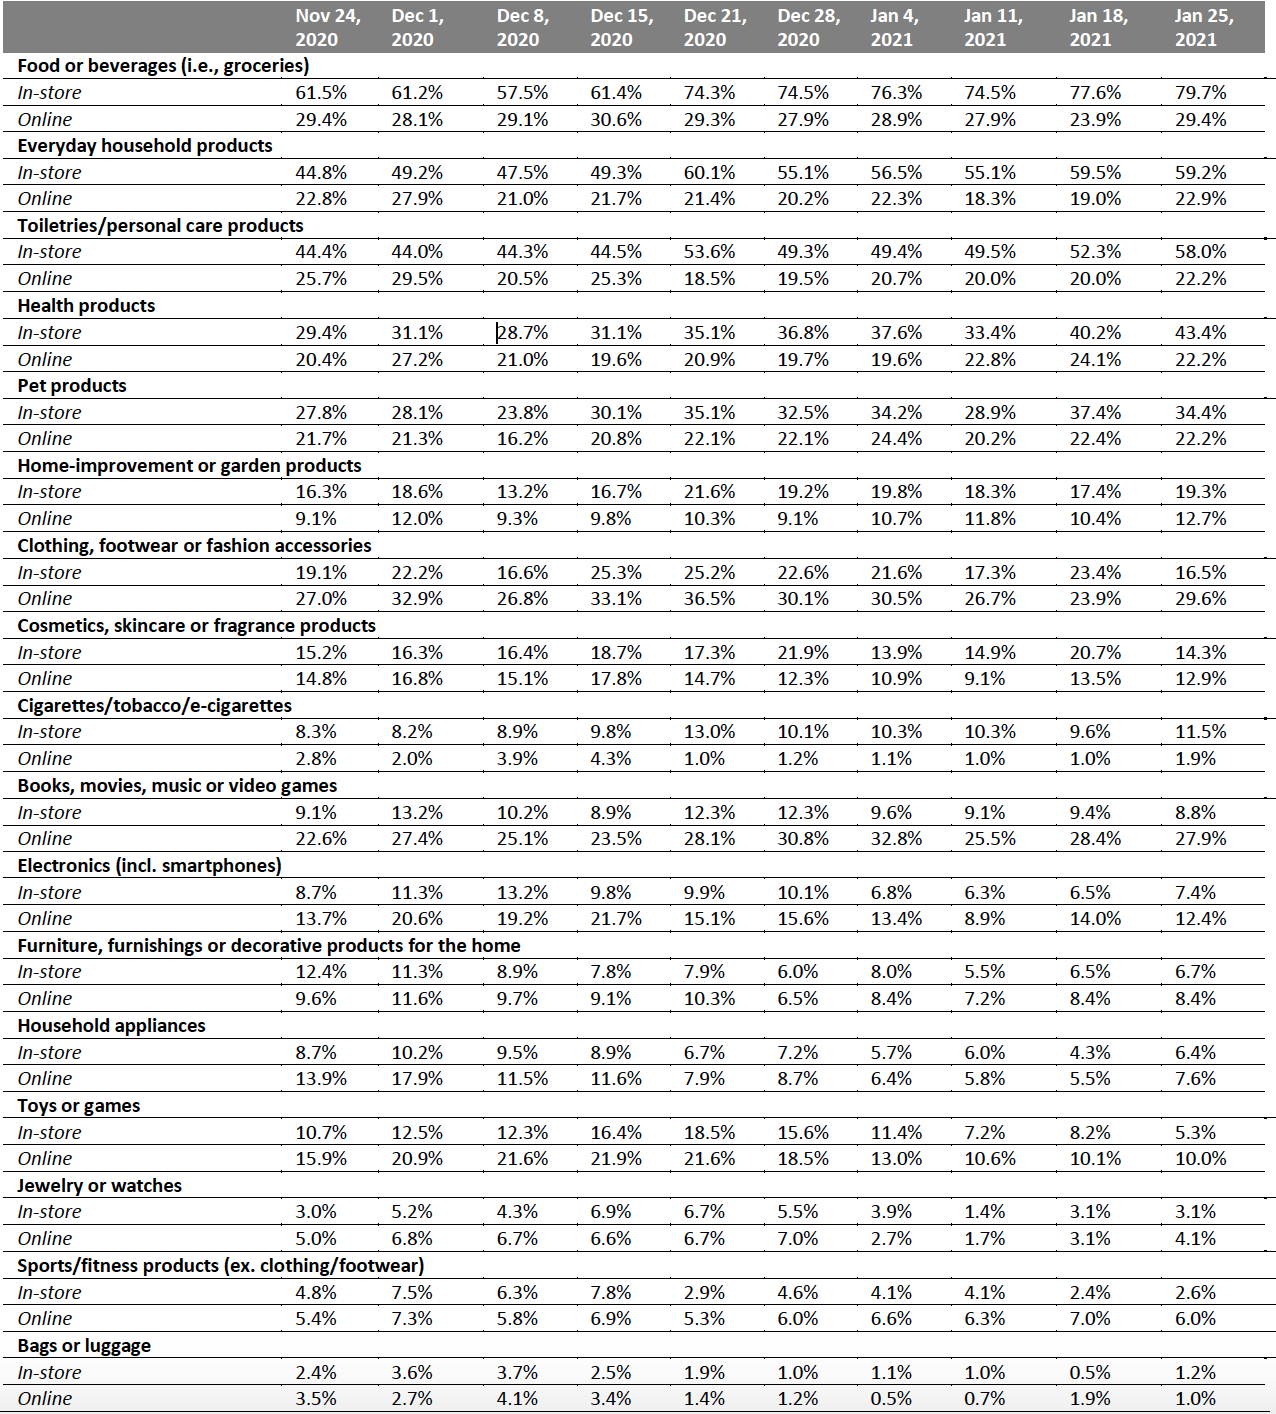 Respondents could select multiple options
Base: US respondents aged 18+
Source: Coresight Research[/caption]
Retailers: Where Consumers Shopped
Since December 21, we have asked consumers which retailers they bought from in the two-week period preceding the survey, for both food and nonfood products.
The proportion of consumers shopping for nonfood products declined after a slight bounce back last week, with demand, unsurprisingly, substantially below holiday levels. Eight of the eleven retailers we asked consumers about saw their proportion of shoppers for nonfood products decline, and seven of the twelve food retailers saw a decrease in the proportion of shoppers.
For food purchases:
- While it is unsurprisingly apparent that demand remains below its holiday levels, clear trends in shoppers’ changing preferences for different food retailers is yet to emerge—of the twelve retailers we ask respondents about, only two have seen the proportion of consumers shopping there move in the same direction over the past two weeks.
- After a jump in recorded food shopper numbers last week, Walmart reverted to the kind of levels seen in previous weeks. At 40.6%, this remained more than double the number of shoppers compared to its closest grocery competitor.
For nonfood purchases:
- After a slight bounce back last week, Amazon and Walmart both saw shopper numbers drop this week, keeping levels around ten percentage points lower than holiday rates for both retailers.
- Kohl’s saw shopper numbers decline for the fourth straight week, indicating that department stores remain unable to draw people back to physical stores: the proportion of consumers shopping at Kohl’s is now less than half the proportion reported on December 28.
Figure 2. All Respondents: Which Retailers They Have Bought Food Products From and Which Retailers They Have Bought Nonfood Products From in the Past Two Weeks (% of Respondents)
[caption id="attachment_122549" align="aligncenter" width="700"]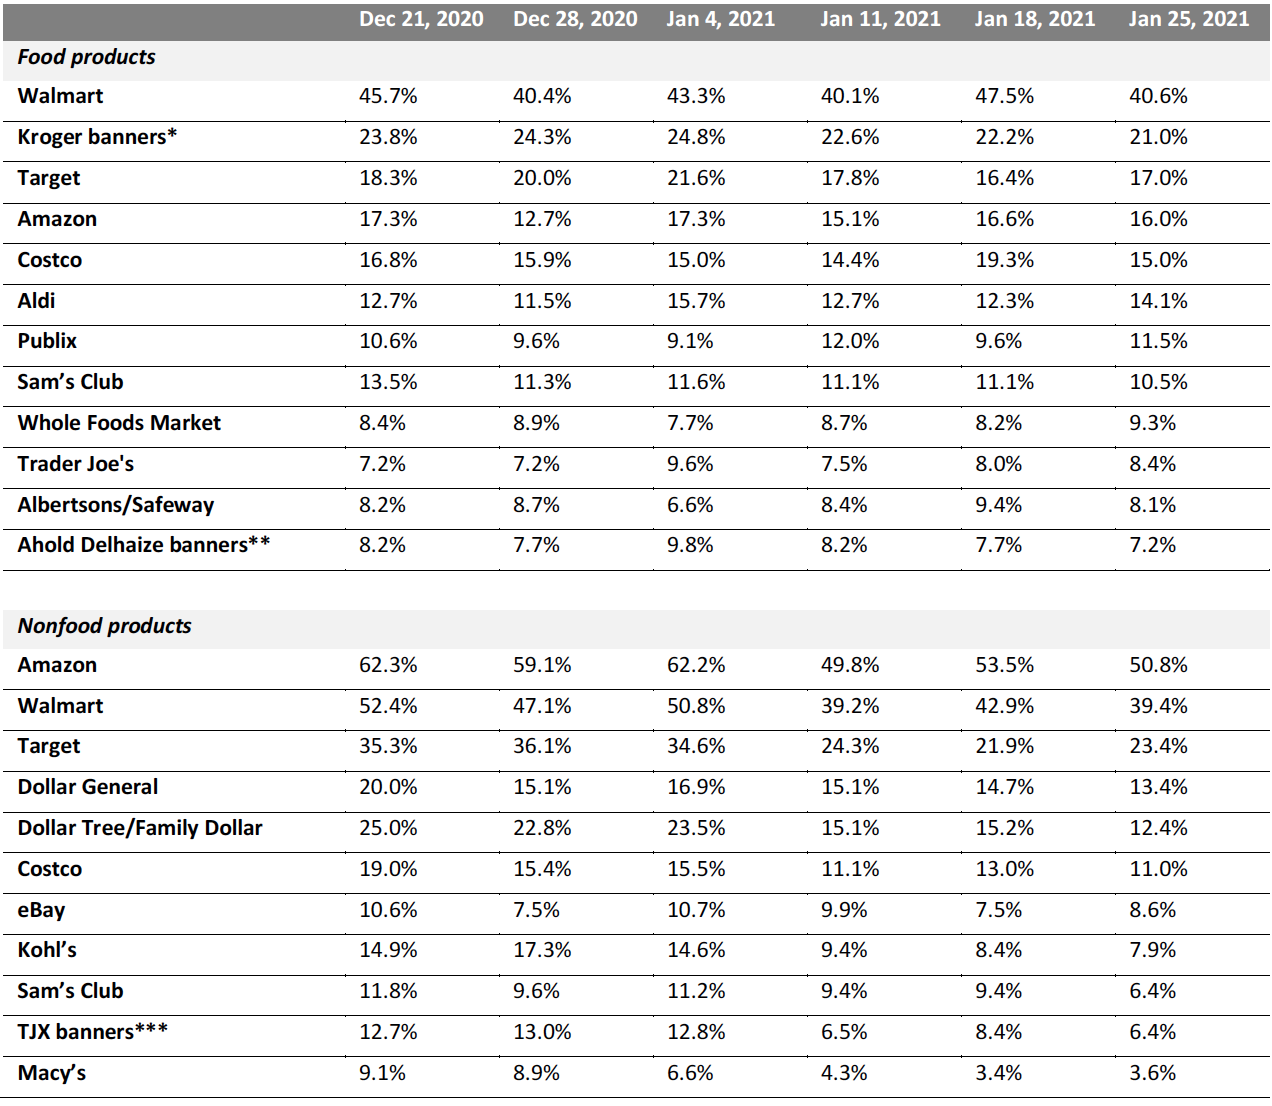 Respondents could select multiple options
Base: US Internet users aged 18+
*Kroger banners include City Market, Fred Meyer, Harris Teeter, King Soopers, Kroger, Ralphs and Smith’s Food & Drug
**Ahold Delhaize banners include Food Lion, Giant, Hannaford and Stop & Shop
***TJX banners include HomeGoods, HomeSense, Marshalls, Sierra and T.J. Maxx
Source: Coresight Research[/caption]
What Shoppers Are Doing and Where They Are Going
Consumers Get Slightly More Adventurous
Complementing our questions about purchases in the past two weeks, each week, we ask consumers what activities they have done in the past two weeks. This week, the proportion of respondents increased for three-quarters of the options we provided for recent activities, although most of the week-over-week changes were within the margin of error.
- Consumers appear slightly more willing to visit food service places: The proportion of consumers that have recently gone to a restaurant rose by five percentage points this week, the second straight week of growth.
- A greater proportion of consumers also reported getting haircuts for the second straight week, while the proportion of consumers reporting that they had met with friends and family dropped to its lowest value since December 15.
- The proportion of consumers that had recently gone to open-air or enclosed shopping centers rose this week.
Figure 3. All Respondents: What Activities They Have Done in the Past Two Weeks (% of Respondents)
[caption id="attachment_122550" align="aligncenter" width="700"]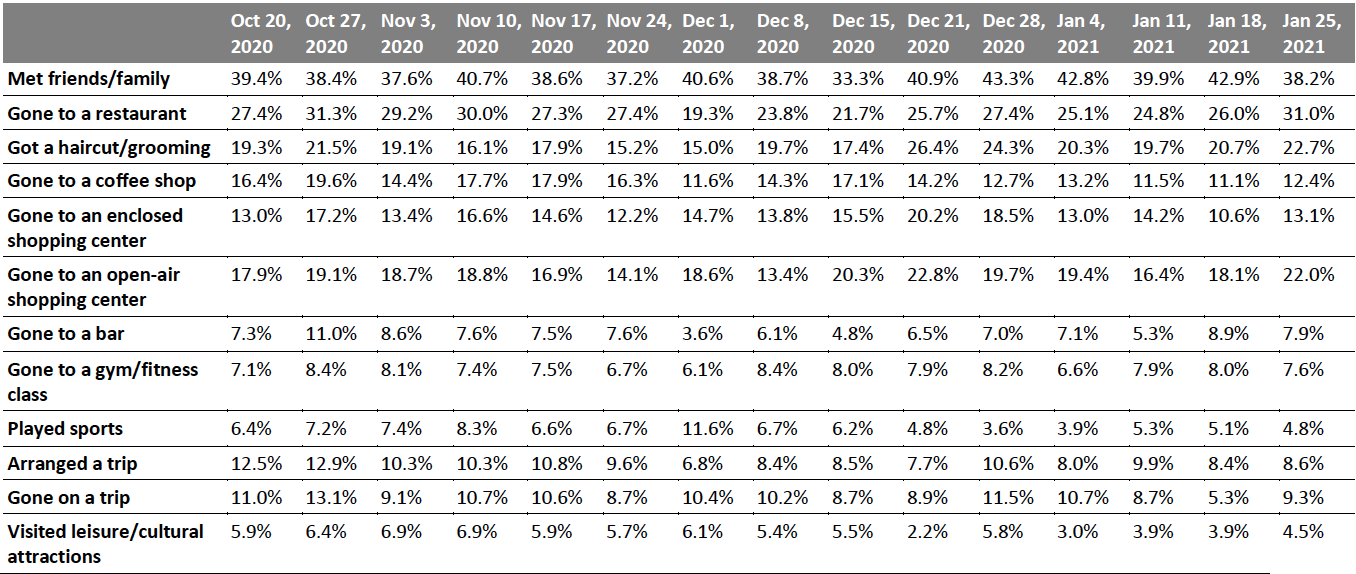 Respondents could select multiple options
Base: US respondents aged 18+
Source: Coresight Research[/caption]
Eight in 10 Are Currently Avoiding Public Places
In this week’s survey, the avoidance rate of any type of public area stood at 81.9%, versus 80.7% last week and 82.7% two weeks ago.
Avoidance rates were up slightly week over week in all of the 12 options provided.
- Entertainment categories saw large increases in avoidance this week: the proportion of consumers avoiding sporting events and other entertainment/leisure venues both rose by more than seven percentage points this week to 60.6% and 57.3% respectively.
- Consumers also reported being increasingly wary of transportation of any kind: the proportion of consumers reporting that they were avoiding public transportation rose by 6.2% to 55.6%, while the proportion of consumers avoiding international travel rose by 5.4% to 59.4%
- The proportion of consumers avoiding shopping centers bounced back up to 68.3% after dropping to 63.9% last week.
- Consumers appear increasingly eager to avoid other non-essential communal places: the proportion of consumers avoiding gyms and community centers both rose by more than 7% this week to 54.4% and 53.0%, respectively.
- Avoidance of shops in general stood at 50.4%, roughly the same as last week’s number, and substantially below the record-high level of 56.3% three weeks ago.
Figure 4. All Respondents: Public Places That Respondents Are Currently Avoiding (% of Respondents)
[caption id="attachment_122551" align="aligncenter" width="700"]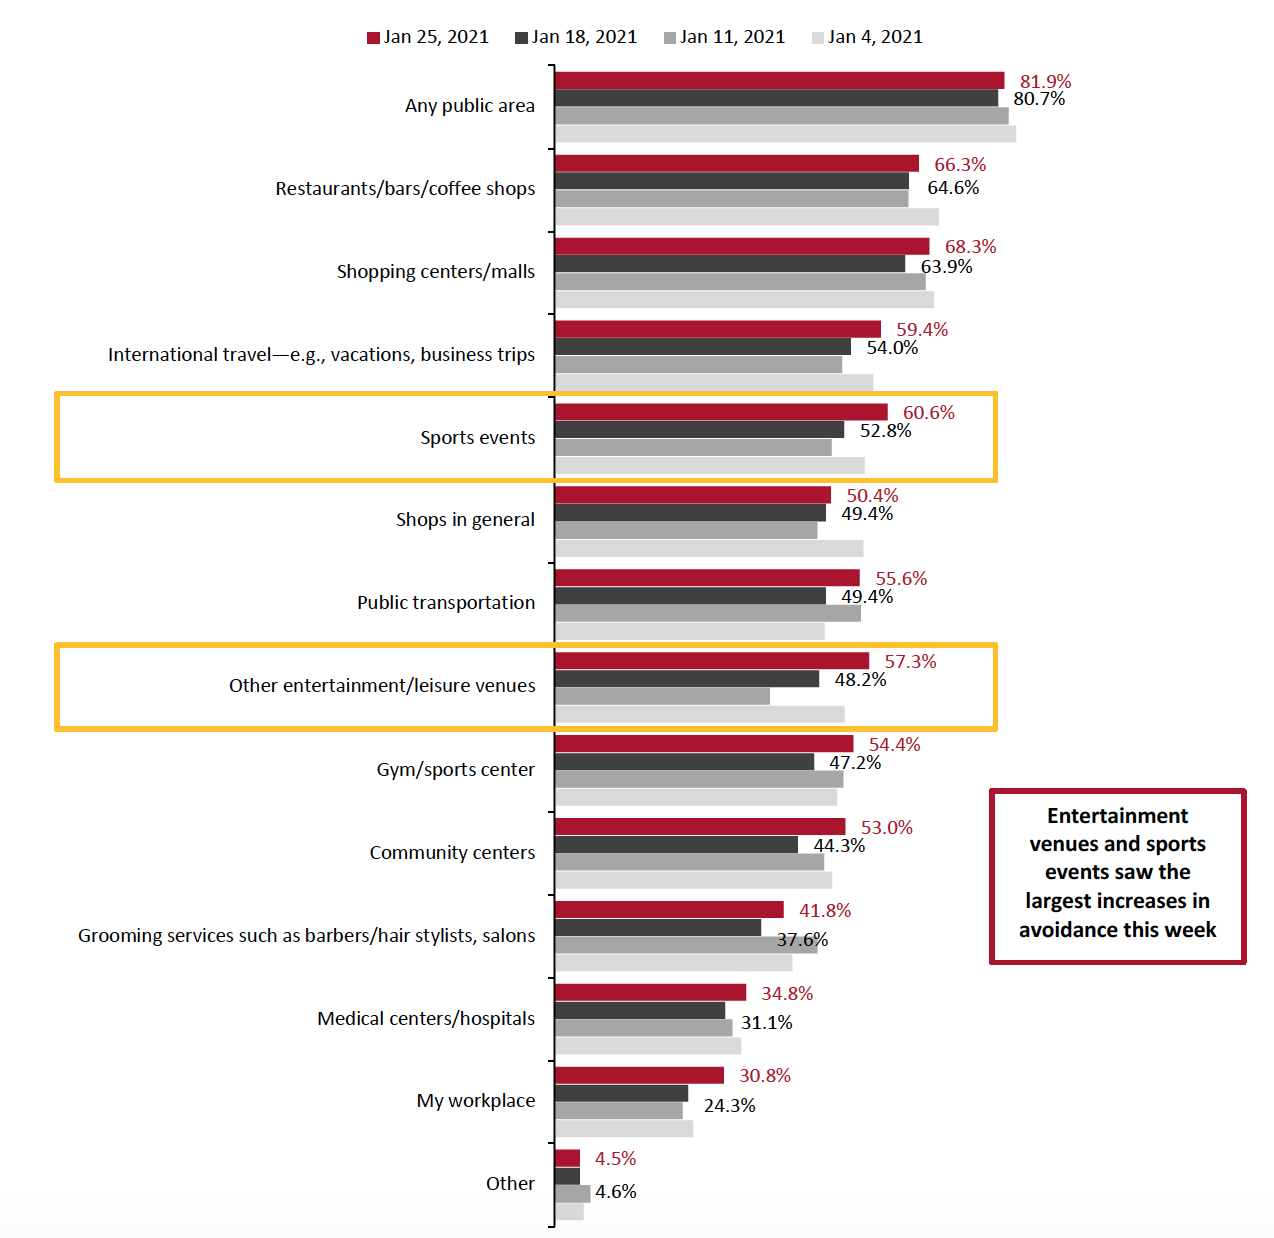 Respondents could select multiple options
Base: US respondents aged 18+
Source: Coresight Research[/caption]
Reviewing Trend Data in Current Purchasing Behavior
What Consumers Are Currently Buying More Of and Less Of
The proportion of consumers buying more of any product rose from 44.6% last week to 49.2%, its highest value since the survey period moved beyond including Christmas (our January 11 survey). This is still far below its 70.8% holiday season peak on November 3. However, the proportion of consumers buying less products also rose this week by 6.5 percentage points to 47.0%.
- Buying more in any category and buying less in any category were not mutually exclusive options, so respondents could answer yes to both.
Buying more: The proportions of consumers that are buying more food, household and personal care products rose slightly this week. Significantly more consumers reported purchasing health products: 23.6% reported purchasing health products in the most recent survey period, up from 16.1% last week and representing the highest proportion since December 15.
Buying less: The proportion of consumers making fewer discretionary purchases remained relatively high: 30.3% of consumers reported buying less apparel and footwear, again the highest rate of any category. Beauty products and furniture both saw slight upticks this week as well, although both changes were within the margin of error.
Ratio of less to more: The ratios of the proportion of respondents buying less to the proportion buying more rose in ten of the fourteen categories we asked respondents about this week:
- The ratio for clothing and footwear rose from 5.3 to 7.1 this week after declining for two consecutive weeks, remaining the highest ratio of any category. In our surveys conducted early in the holiday season, this ratio was around 2.0.
- The ratios for entertainment products—namely books, movies and music, as well as toys—at least doubled this week, rising from 0.2 to 0.4 and from 0.71 to 1.7 respectively.
- The ratio for beauty came in at 3.8, down from 5.2 last week and representing a 2021 low.
- The ratio for household products remained the lowest, sitting at 0.04 this week compared to 0.06 last week.
Figure 5. All Respondents: What They Are Currently Buying More/Less Of Due to the Coronavirus Outbreak (% of Respondents)
[caption id="attachment_122552" align="aligncenter" width="700"]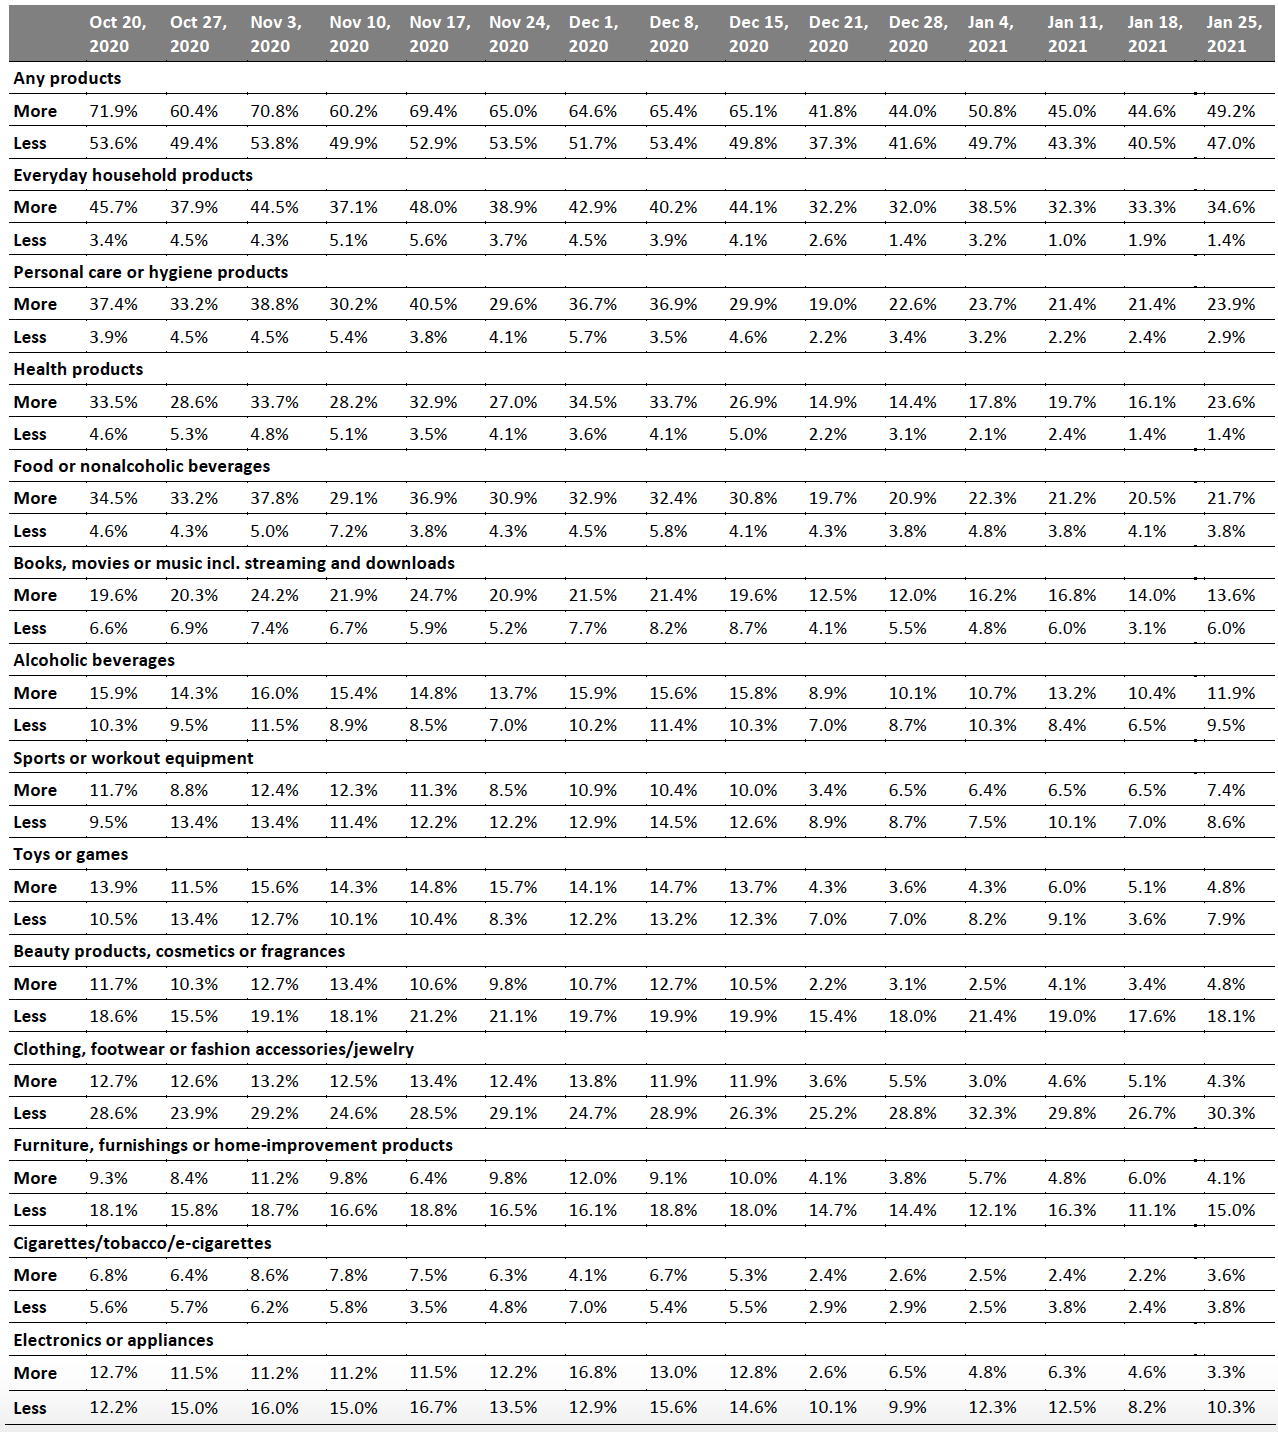 Base: US respondents aged 18+
Source: Coresight Research[/caption]
What We Think
As Covid-19 cases in the US continue to fall, we expect consumers to begin getting slightly more confident about going to public places. However, this week’s survey indicates that this reversion to pre-crisis shopping behaviors remains a light at the end of the tunnel, not an immediate reality. After positive signs last week, consumers reported a greater avoidance of public places this week, although many did appear more comfortable visiting restaurants, bars and coffee shops.
A consistent move back towards physical shopping, spending, and socializing will depend largely on the speed at which vaccines are rolled out and the ability of the US to avoid further waves of infection. Johnson & Johnson recently announced that it is optimistic about the results of its final round of vaccine clinical trials. If approved, the vaccine could provide Americans with an extra 100 million doses of vaccines by summer—especially positive news considering that unlike the Moderna and Pfizer vaccines, Johnson & Johnson’s will not require a booster shot. If the current rollout of vaccines accelerates with the approval of additional versions, within the next few months we expect to see a more sustained reversion to pre-pandemic spending behaviors.
Our recurring weekly questions indicated the following:
- Avoidance of Public Places: Even though virus cases have decreased, they still remain at high levels, prompting more than eight in ten consumers to report that they continued to avoid public places in this week’s survey period. Avoidance of each of the twelve specific locations we asked about rose this week, perhaps indicative of many consumers’ increased caution as vaccines offer a light at the end of the tunnel and an achievable goal for consumers to strive toward in their social distancing efforts.
- Apparel: Consumers continue to be reluctant to spend on discretionary purchases following the holiday season, with apparel taking the hardest hit. The ratio of consumers buying less apparel to those buying more apparel rose to 7.1 this week, up from a ratio of 2.0 during the holiday season. Those consumers who did buy apparel generally did so online: nearly one in three consumers reported buying apparel online, while the proportion purchasing apparel in-store fell by more than six percentage points this week. Consumers seem willing to put aside Covid-19 concerns to shop for basics but are wary of doing non-essential shopping in person.
- Health Products: As consumers focus on their wellbeing during the pandemic, they continue to purchase health products at a high rate. The proportion of consumers purchasing more health products now than pre-pandemic stood at nearly one in four this week. Health products were one of just four categories that more than four in 10 consumers reported purchasing in stores in the past two weeks. As the duration of the pandemic nears the one-year mark, consumers seem eager to do all they can to maximize their wellbeing.
Methodology
We surveyed respondents online on January 25 (419 respondents), January 18 (415 respondents), January 11 (416 respondents), January 4 (439 respondents), December 28 (416 respondents), December 21 (416 respondents), December 15 (438 respondents), December 8 (463 respondents), December 1 (441 respondents), November 24 (460 respondents), November 17 (425 respondents), November 10 (447 respondents), November 3 (418 respondents), October 27 (419 respondents), October 20 (409 respondents), October 13 (401 respondents), October 6 (416 respondents), September 29 (412 respondents), September 22 (422 respondents), September 15 (408 respondents), September 9 (406 respondents), September 2 (402 respondents), August 26 (414 respondents), August 19 (416 respondents), August 12 (400 respondents), August 5 (449 respondents), July 29 (403 respondents), July 22 (404 respondents), July 15 (454 respondents), July 8 (410 respondents), July 1 (444 respondents), June 24 (411 respondents), June 17 (432 respondents), June 10 (423 respondents), June 3 (464 respondents), May 27 (422 respondents), May 20 (439 respondents), May 13 (431 respondents), May 6 (446 respondents), April 29 (479 respondents), April 22 (418 respondents), April 15 (410 respondents), April 8 (450 respondents), April 1 (477 respondents), March 25 (495 respondents) and March 17–18 (1,152 respondents). The results have a margin of error of +/- 5%, with a 95% confidence interval. Not all charted week-over-week differences may be statistically significant.