albert Chan
What’s the Story?
This report presents the results of Coresight Research’s latest weekly survey of US consumers, undertaken on March 29. The report includes analysis of questions on shopper behaviors and the impacts of the coronavirus outbreak. We explore the trends we are seeing from week to week, following previous weekly surveys.
How Consumers Spent or Plan To Spend Their Stimulus Checks
A third round of stimulus was approved on March 11 in the US. The passage of this round authorized the distribution of $1,400 to individuals earning less than $75,000 per year, and a reduced stimulus for consumers earning up to $80,000. In late December 2020, the US government issued a second-round stimulus check of up to $600 per adult to Americans with incomes of less than $87,000, following on from the first payment of up to $1,200 to individuals earning less than $99,000 in mid-April 2020.
This week, we asked consumers that had received a third stimulus check—around six in 10 survey respondents—how they used or plan to use their money, giving them 14 options (as well as “other” and “cannot remember/don’t know”). Figure 1 shows our survey findings in comparison to when we asked the same question following the distribution of the first and second stimulus checks.
More Consumers Spend Latest Stimulus Checks on Discretionary Products
Essential payments including bills, savings, debt, mortgages and rent again topped consumers’ use of a third stimulus check. Some 35.3% of consumers that received a third stimulus check reported that they used it to pay bills, eight percentage points lower than those that used their first and second payment on bills. Within essential payments, more consumers said that they used or will use a third check on savings or investments, compared to our survey results on consumers’ use of the first and second stimulus checks.
Despite a declining trend in consumers that spent or expect to spend their stimulus check on groceries, food remains the top retail spending option for stimulus dollars in our survey. Among discretionary retail purchases, home-improvement products saw the strongest demand—some 17.0% of consumers reported that they spent or plan to spend their third check on such items, up 12 percentage points from our survey findings on consumers’ use of the second check. The recreational goods and clothing and footwear categories also saw a spike in the proportion of consumers that spent or plan to spend their third stimulus check to purchase such items.
Overall, we expect the latest stimulus check to boost US retail recovery. The $1,400 check is larger than the previous two rounds of payments, likely reflected in more consumers reporting that they used or plan to use a third check on discretionary retail categories than our results for the two prior stimulus checks. All of the six discretionary categories we ask about saw increases in consumers’ purchases, versus our results on first-round and second-round stimulus spending.
Figure 1. Respondents Who Had Received A Stimulus Check: How They Spent or Expect To Spend Their First-Round, Second-Round and Third-Round Stimulus Checks (% of Respondents)
[caption id="attachment_125497" align="aligncenter" width="700"]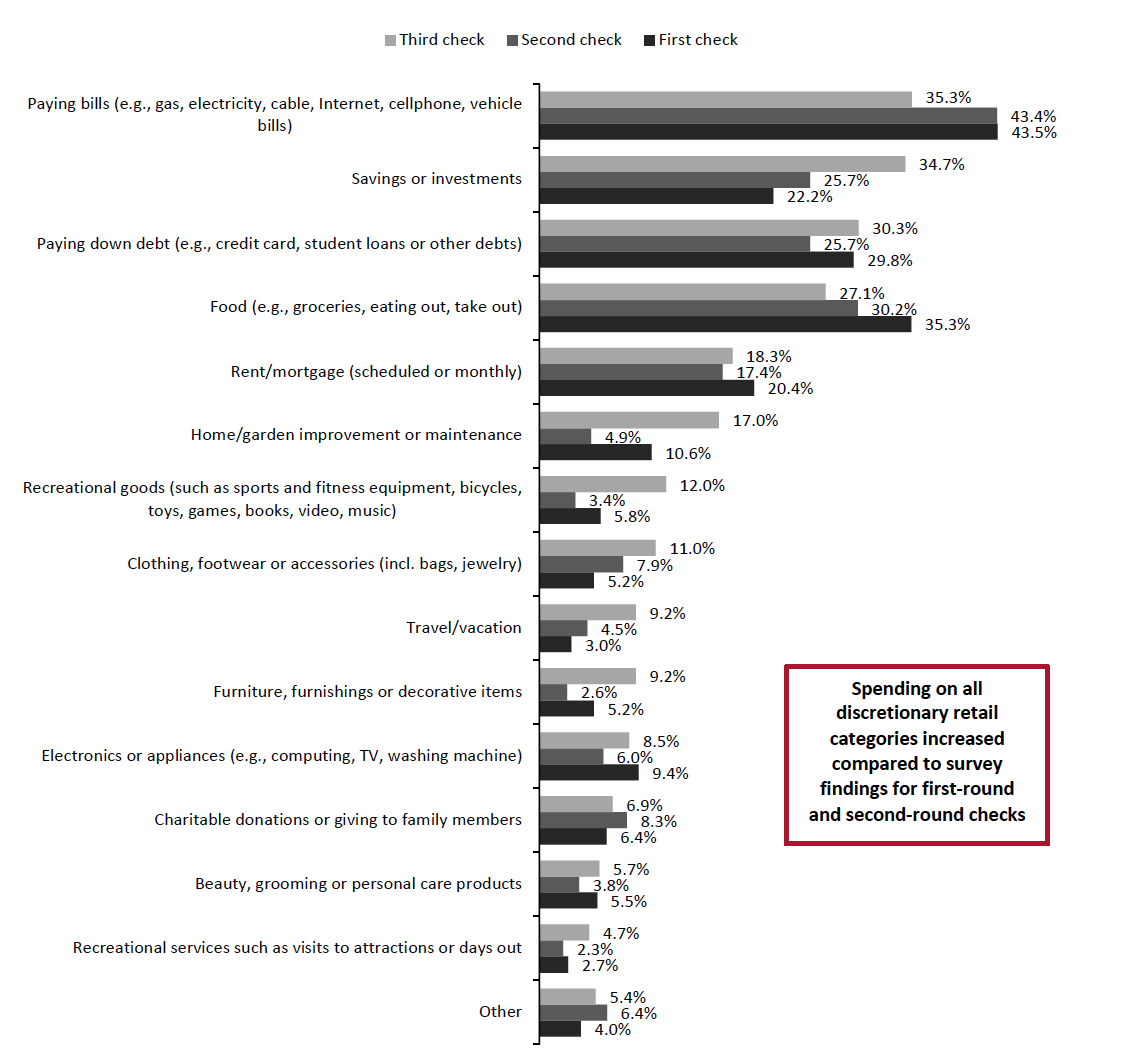 Respondents could select multiple options
Base: US respondents aged 18+ who had received a stimulus check
Source: Coresight Research[/caption]
What Shoppers Are Buying and Which Retailers They Are Buying From
What Consumers Bought In-Store and Online
This week, key findings in specific categories include the following:
- The home-improvement category recorded a spike in purchases this week, potentially driven by stimulus checks: Some 26.3% of respondents purchased such products in-store, the highest level we have recorded in our survey. Online home-improvement purchases were also solid, up five percentage points week over week to 16.3%. We expect to see sustained demand for home-improvement products as the top discretionary category that consumers used or plan to use their latest stimulus checks on.
- For the fourth straight week, more than one in five consumers reported purchasing clothing and footwear in-store in the two weeks prior to our survey. The 24.2% recorded this week is the highest level so far this year. Online shopping for the category also picked up again, with almost three in 10 consumers reporting that they had done so in the two weeks prior to our survey. The improvement in both in-store and online apparel purchases suggests a gradual recovery in the hard-hit clothing sector.
- Other discretionary categories, including books, movies, music or video games; electronics, furniture; household appliances; and toys or games all saw week-over-week increases in both online and in-store purchases.
Figure 2. All Respondents: What They Have Bought In-Store and Online in the Past Two Weeks (% of Respondents)
[caption id="attachment_125498" align="aligncenter" width="700"]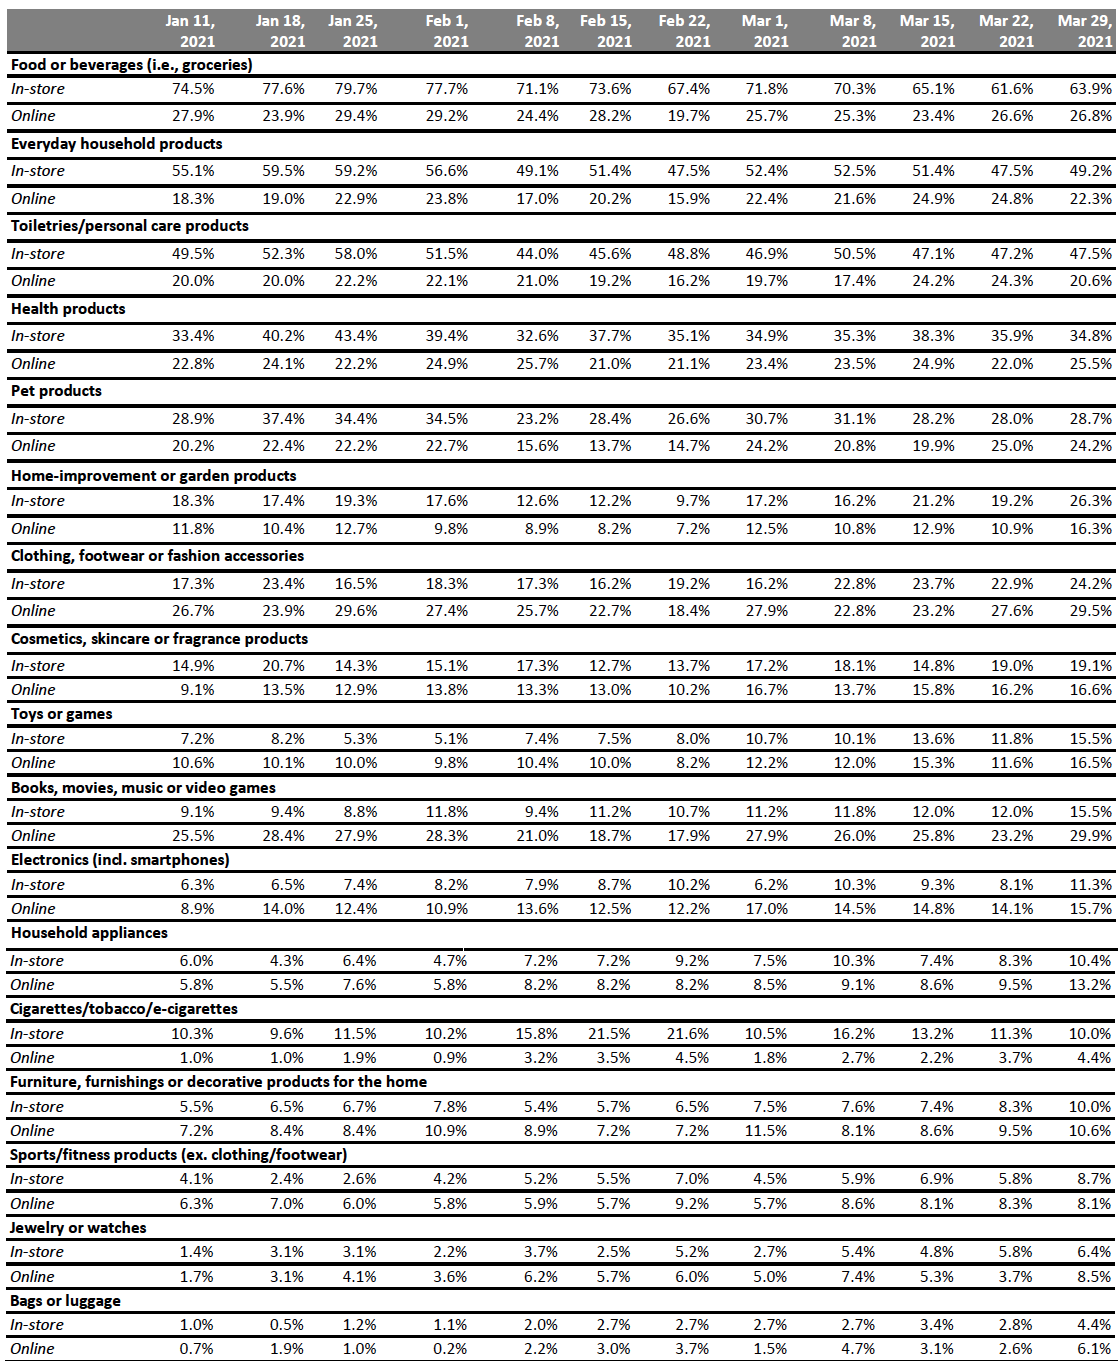 Respondents could select multiple options
Base: US respondents aged 18+
Source: Coresight Research[/caption]
Which Retailers Consumers Purchased Food and Nonfood Products From
Each week, we ask consumers which retailers they bought from in the two-week period preceding the survey, for both food and nonfood products.
For food purchases:
- Amazon, Costco, Target and Trader Joe’s each recorded a high in the proportion of consumers that had bought food products from them this week.
- Costco witnessed the largest week-over-week increase in the proportion of consumers purchasing food products from the retailer, rising by 10 percentage points from 18.1% last week to 28.2% this week.
For nonfood purchases:
- The proportion of consumers that reported purchasing nonfood products from Amazon surged to a high of 62.6% this week. We last recorded proportions of this level for the retailer during the holiday season, on December 21, 2020.
- In addition to food products, Costco also recorded the largest week-over-week increase in nonfood purchases this week. Almost one-fifth of respondents reported buying non-food products from the retailer.
- This week’s metrics suggest a slight recovery in department stores: Some 14.0% had bought from Kohl’s, up six percentage points from last week. Macy’s also saw an increase this week, with metrics for the two retailers reaching the highest level recorded in our survey this year.
Figure 3. All Respondents: Which Retailers They Have Bought Food Products From and Which Retailers They Have Bought Nonfood Products From in the Past Two Weeks (% of Respondents)
[caption id="attachment_125499" align="aligncenter" width="700"]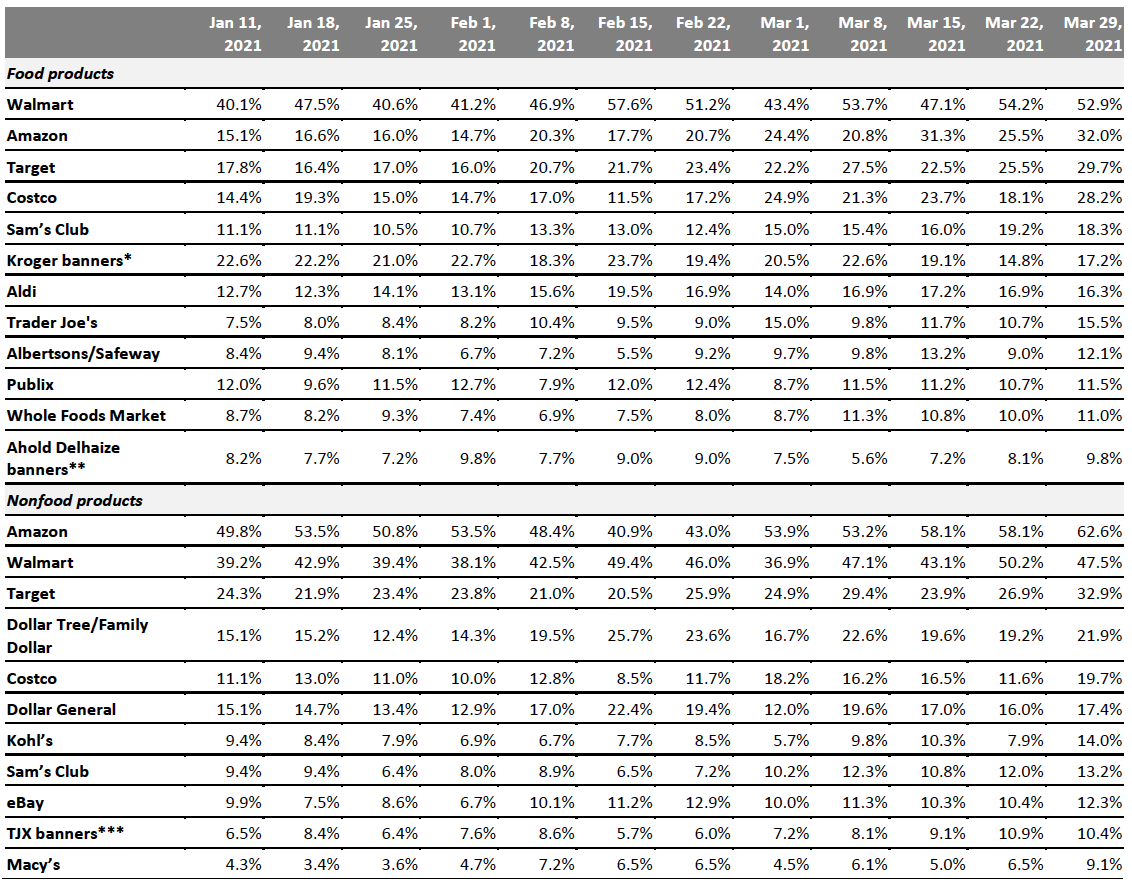 Respondents could select multiple options
Base: US Internet users aged 18+
*Kroger banners include City Market, Fred Meyer, Harris Teeter, King Soopers, Kroger, Ralphs and Smith’s Food & Drug
**Ahold Delhaize banners include Food Lion, Giant, Hannaford and Stop & Shop
***TJX banners include HomeGoods, HomeSense, Marshalls, Sierra and T.J. Maxx
Source: Coresight Research[/caption]
Reviewing Consumers’ Long-Term Behavior
Fewer Than Half Expect To Retain Changed Behaviors in the Long Term
We asked respondents whether they anticipate keeping some of the behaviors they have adopted during the coronavirus crisis in the long term. This week, some 47.5% of respondents reported that they expect to retain some changed behaviors, the second-lowest level we have recorded in our survey.
Compared to the level of above 50% recorded for the majority of the second half of 2020, this week’s level suggests that more consumers are ready to return to ways of living and spending from prior to the pandemic.
Figure 4. All Respondents: Expectation To Behave Differently/Retain Changed Way of Living in the Long Term (% of Respondents)
[caption id="attachment_125500" align="aligncenter" width="700"]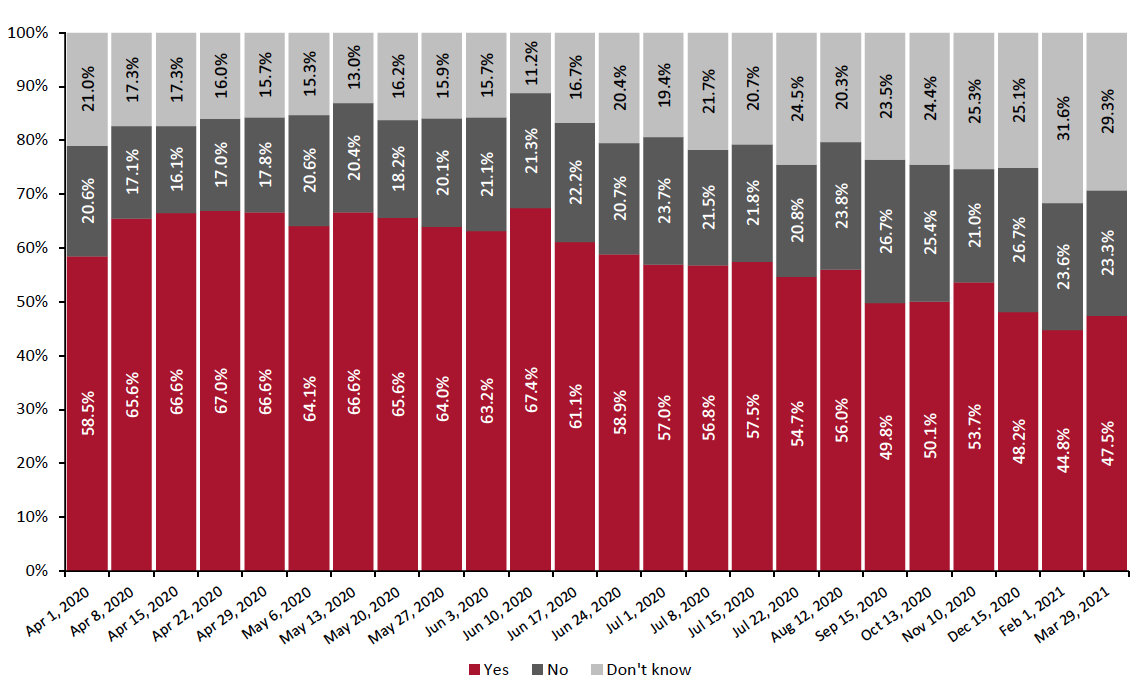 We do not ask the question every week
Base: US respondents aged 18+
Source: Coresight Research[/caption]
The proportion of respondents that expect to retain behavior changes in the long term declined for seven of the 11 behavior options provided, in comparison to the last time we asked the question on February 1. Most changes were within the margin of error.
The behavior option of having more hygienic practices witnessed the largest decline, dropping by six percentage points compared to when we asked the question in February. Some 22.3% of respondents expect to retain this behavior in the long term—while this is the lowest level we have recorded in our survey, it is still the top behavior that respondents expect to retain in the long term.
Moreover, the proportion of respondents that expect to have fewer physical interactions in the long term dropped to a low of one-fifth this week. Using contactless payment options in a store more often saw the largest increase, rising by six percentage points from the nadir of 10.2% on February 1.
Figure 5. All Respondents: What Changed Behaviors They Expect To Retain (% of Respondents)
[caption id="attachment_125501" align="aligncenter" width="700"]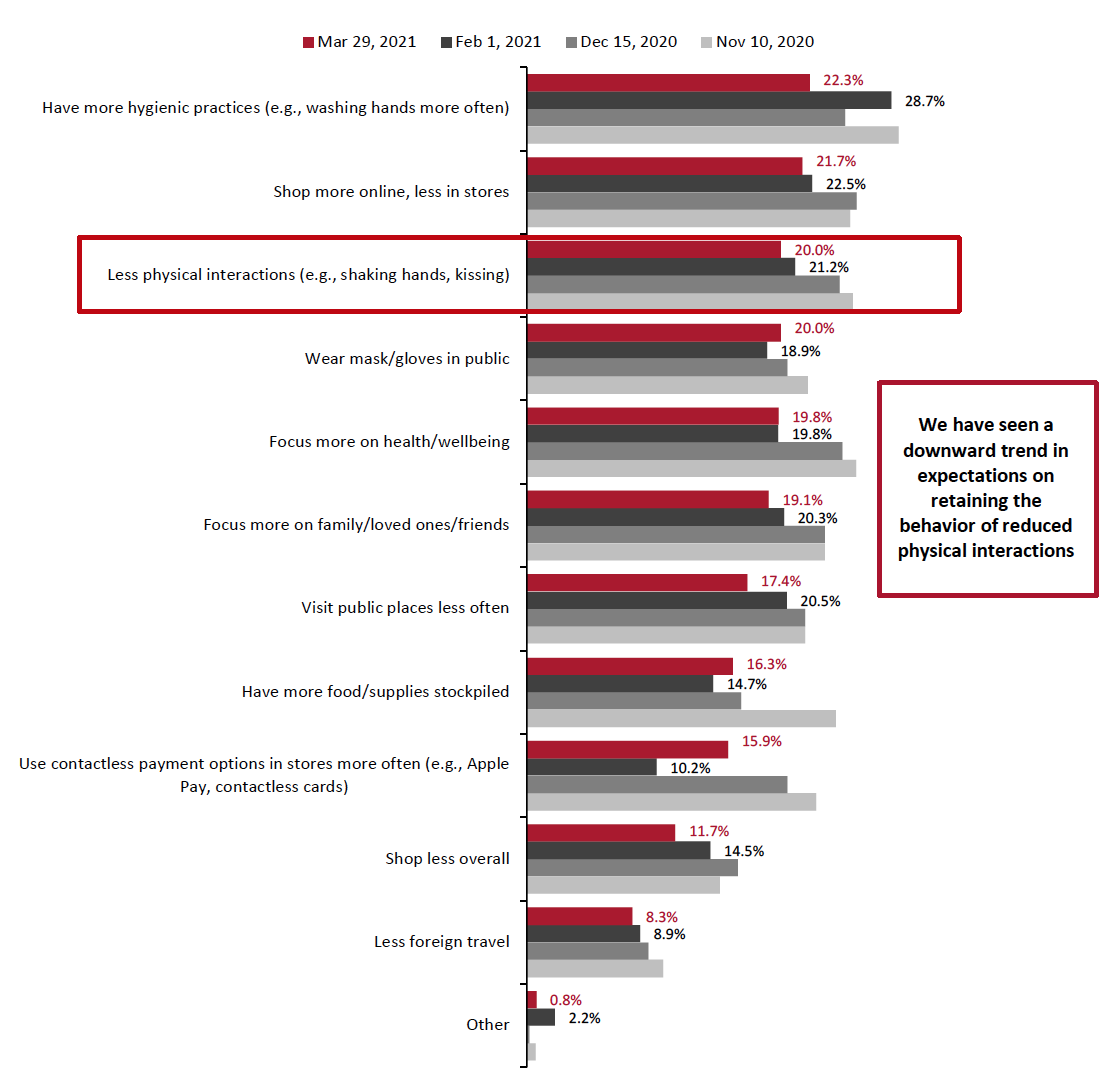 Respondents could select multiple options
Base: US respondents aged 18+
Source: Coresight Research[/caption]
In Figure 6, we show trended data for three of the metrics charted in Figure 5. The medium-term trends indicate increasing intentions to return to more normal ways of living and shopping, with all three metrics trending downward:
- Some 21.7% of respondents expect to shop more online and less in stores in the long term, slightly down from 22.5% on February 1. Although this behavior has trended downward since peaking at 30% in early June 2020 with some fluctuations, the option has the smallest difference between its peak and this week’s level, making it the most likely behavior to be retained in the long term.
- The proportion of consumers that expect to retain the behavior of shopping less overall decreased to 11.7% this week, from 14.5% on February 1. This level is the lowest we have recorded in the past 12 months, reflecting that more consumers expect to return to pre-pandemic consumption levels.
- Some 17.4% of consumers reported that they expect to visit public places less frequently in the long term, the lowest level we have recorded since April last year. Later in the report, we discuss findings from a separate question on the proportion of consumers currently avoiding any public places dropping to a 2021 low.
Figure 6. All Respondents: Selected Behaviors They Expect To Retain (% of Respondents)
[caption id="attachment_125502" align="aligncenter" width="700"]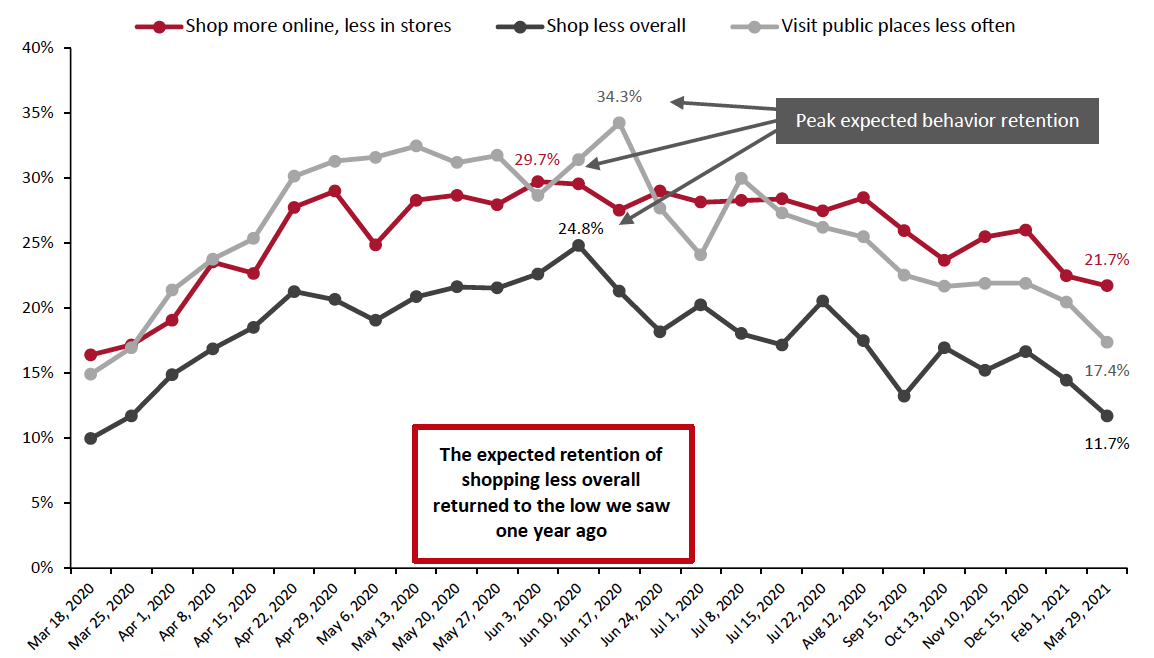 We do not ask the question every week
Base: US respondents aged 18+
Source: Coresight Research[/caption]
What Shoppers Are Doing and Where They Are Going
More Consumers Visit Food-Service Locations and Shopping Centers
Each week, we ask consumers what activities they have done in the past two weeks. This week, the proportion of respondents increased for all of the 12 activities we asked about, although most changes were within the margin of error.
- Visits to food-service locations jumped to a new high this week. Almost four in 10 consumers had dined in a restaurant in the two weeks prior to our survey, up eight percentage points from last week. The proportion of consumers that had gone to a coffee shop came in at 21.6%, the highest level we have recorded since we started asking this question. This aligns with the decline in avoidance of food-service locations recorded in a separate question this week, which we discuss in the upcoming section.
- The proportion of consumers that reported going to an enclosed shopping center and an open-air shopping center both reached a high this week. Some 22.1% had visited an enclosed shopping center, up almost seven percentage points from last week, and a slightly higher proportion of consumers (23.1%) had gone to an open-air shopping center.
- In this week’s survey, some 16.6% of consumers reported arranged a trip. Moreover, some 14.2% of consumers reported going on a trip—while this is the highest level we have recorded this year, we expect travel restrictions to continue to impact consumer avoidance of international travel.
Figure 7. All Respondents: What Activities They Have Done in the Past Two Weeks (% of Respondents)
[caption id="attachment_125503" align="aligncenter" width="700"]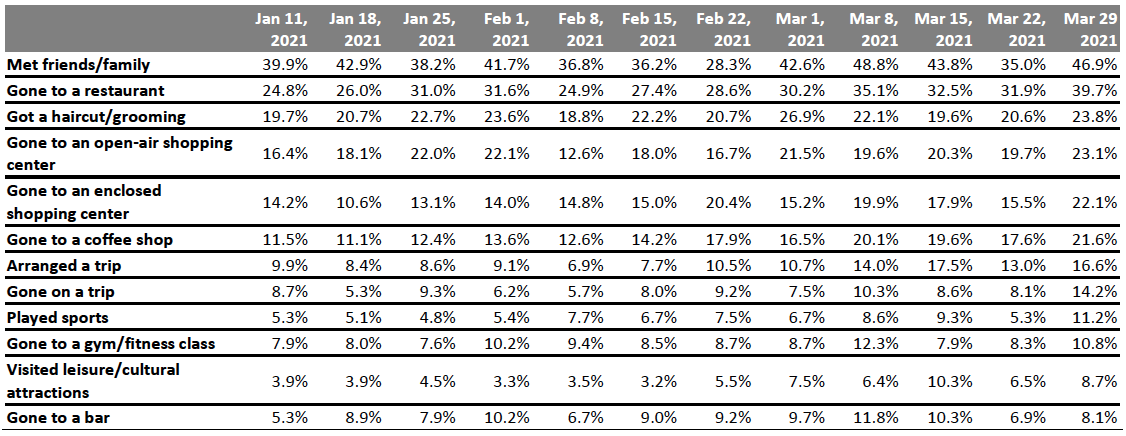 Respondents could select multiple options
Base: US respondents aged 18+
Source: Coresight Research[/caption]
Consumers’ Avoidance of Public Places Falls
This week, the avoidance rate of any type of public area came in at 76.2%, the lowest level from the last six months. For all of the 13 location options provided, rates of avoidance decreased this week, although some changes were within the margin of error.
- Echoing what we discussed in the previous section on consumer activities, food-service locations saw a significant decline in avoidance this week, dropping by seven percentage points from 51.4% to 44.4%. The decrease also takes the location out of its usual position among the top three most-avoided public places in our survey.
- Encouragingly for retailers, the proportion of consumers that reported avoiding shopping centers/malls and shops in general both dropped to a low this week. Some 45.9% are avoiding shopping centers/malls and roughly one-third are avoiding shops in general.
- This week, the proportion of consumers that are currently avoiding grooming services fell by five percentage points week over week to a historic low.
- Aside from the “any public area” option, international travel recorded the highest proportion of consumer avoidance and came in as the only option to surpass 50% avoidance. This level is likely to remain high as international travel restrictions are still in place.
Figure 8. All Respondents: Public Places That Respondents Are Currently Avoiding (% of Respondents)
[caption id="attachment_125504" align="aligncenter" width="700"]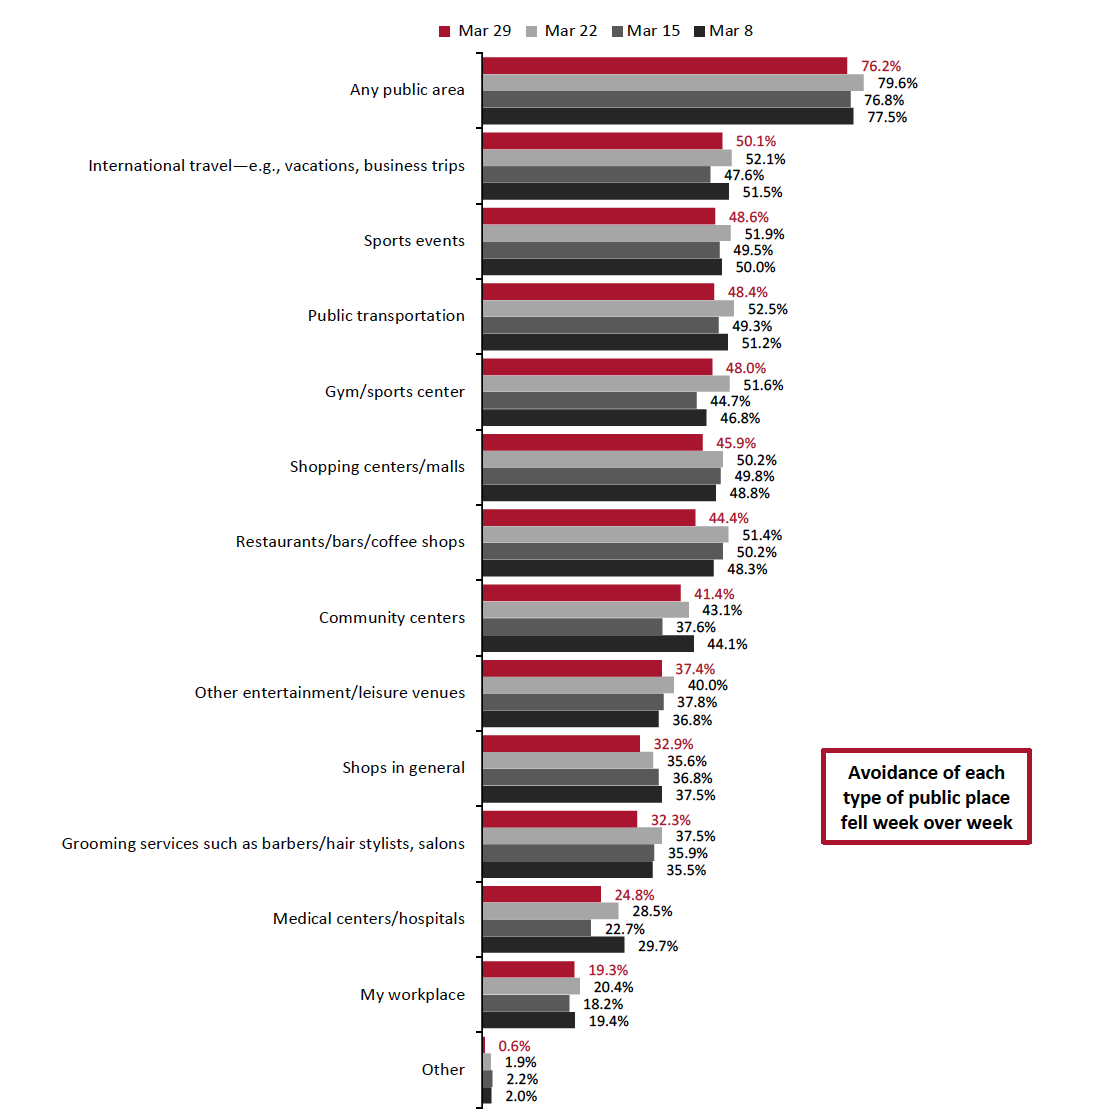 Respondents could select multiple options
Base: US respondents aged 18+
Source: Coresight Research[/caption]
Reviewing Trend Data in Current Purchasing Behavior
What Consumers Are Currently Buying More Of and Less Of
The proportion of consumers buying more of any product due to the coronavirus jumped to a 2021 high at 71.6% this week, compared to 68.8% last week. The proportion that are buying less of any products than before the crisis dropped slightly to 52.0% this week, from 54.4% last week.
- Buying more in any category and buying less in any category were not mutually exclusive options, so respondents could answer yes to both.
Buying more:
The proportion of consumers buying more non-food essentials due to the pandemic fell slightly this week. However, some 35.3% are buying more food, up almost five percentage points week over week to the highest level we have recorded this year.
Electronics ranked as the second most-purchased discretionary category this week, with 18.9% of respondents reporting buying more electronics than before the pandemic, up from 10.9% last week. This proportion surpassed the peak of 16.8% that we recorded during the 2020 holiday season.
The proportion of consumers purchasing more clothing and footwear jumped back after declining last week. Some 15.9% said they are buying more in such category than before the crisis, the highest level on record.
Buying less:
This week, most categories recorded a relatively stable proportion of buying less compared to last week. Clothing and footwear remained the most-cut category, with 26.1% of respondents reporting that they bought less of such products. This is followed by beauty, with the proportion of consumers buying less in the category returning to the level we saw two weeks ago at 17.8%.
Ratio of less to more: The ratios of the proportion of respondents buying less to the proportion buying more broadly leveled off in most of the 13 options, except clothing and footwear, beauty, electronics, and cigarettes.
- The ratio of buying less to more for clothing and footwear fell to a historic low of 1.6 this week, from 2.7 last week and 1.8 two weeks before. The ratio is also lower than that recorded during the 2020 holiday season.
- The ratio for beauty products stood at 1.4 this week, compared to 2.0 last week and 1.9 two weeks before.
- The ratio of buying less to more for electronics dipped below 1.0 this week to 0.6. We last saw this ratio fall below 1.0 on December 1, 2020, when it reached 0.8.
Figure 9. All Respondents: What They Are Currently Buying More/Less Of Due to the Coronavirus Outbreak (% of Respondents)
[caption id="attachment_125505" align="aligncenter" width="700"]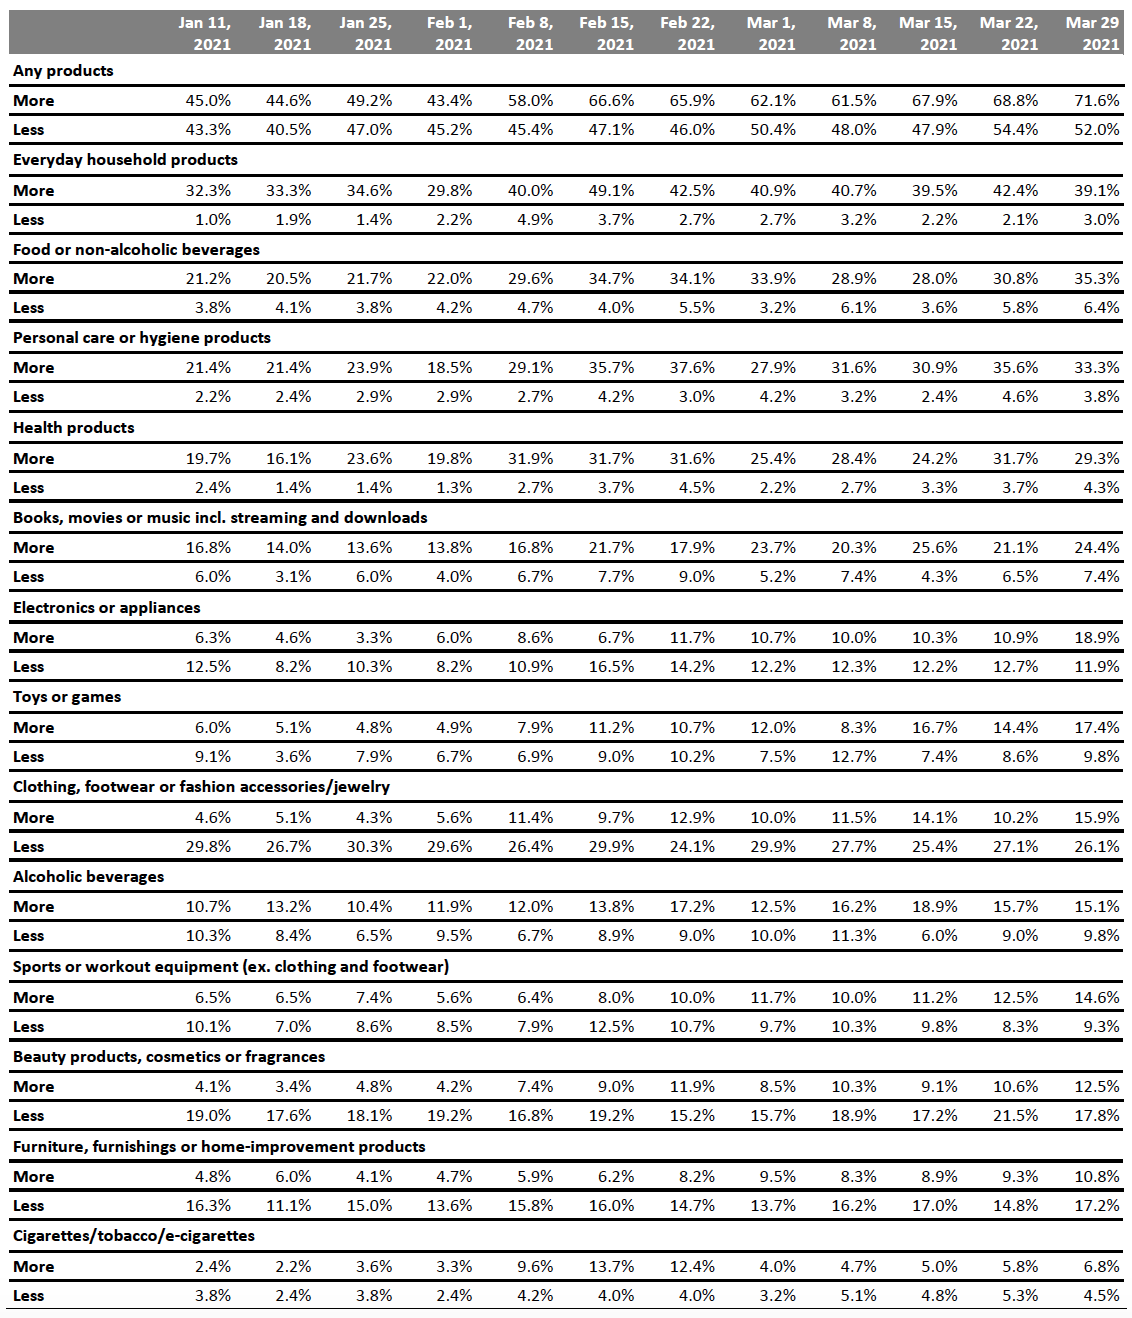 Base: US respondents aged 18+
Source: Coresight Research[/caption]
What We Think
This week’s survey results showed an improvement in retail spending, as well as a return to regular activities, likely driven by the ongoing rollout of vaccines nationwide and the issuance of a third round of stimulus payment. Although consumers report prioritizing stimulus checks on essential payments such as bills, debt, rent and mortgages, more consumers reported that they spent or plan to spend the third-round check on discretionary retail categories including home improvement, recreational goods and clothing and footwear, compared to our survey findings on first-round and second-round stimulus spending. We witnessed a spike in consumers reporting home-improvement category purchases this week, with the proportions reporting both in-store and purchases reaching a high. In the coming weeks, we may sustained demand in retail categories boosted by stimulus checks—as was the case for US retail sales in January, following the second round of stimulus payments.
Our weekly questions indicated the following:
- Avoidance of Public Places: The proportion of consumers avoiding public places fell to 76.2% this week, the lowest level we have recorded over the last six months. Consumers appeared to be more comfortable returning to food-service locations, shopping centers/malls and shops in general, with the proportion of consumers that reported avoiding shopping centers/malls and shops in general both dropping to a low this week.
- Apparel: Apparel purchases peaked this week and the ratio of buying less to more than before the crisis in the category slid to 1.6, coming in lower than the ratio we saw during the holiday season last year. For the fourth straight week, more than one in five consumers reported purchasing clothing and footwear in-store. The proportion of consumers reporting that they shopped for apparel online also picked up again, reaching almost three in 10 this week.
- Retained Behavior: This week, we found that some 47.5% of respondents expect to retain some pandemic-induced behavior changes in the long term, the second-lowest level recorded since we started asking this question roughly one year ago. Moreover, some 21.7% of respondents expect to continue to shop more online and less in-store in the long term. This behavior option has recorded the smallest difference between its peak of 30% and this week’s level, making it the behavior most likely to be retained in the long term out of our survey options.
Methodology
We surveyed respondents online this year on March 29 (529 respondents), March 22 (432 respondents), March 15 (418 respondents), March 8, (408 respondents), March 1 (401 respondents), February 22 (402 respondents), February 15 (401 respondents), February 8 (405 respondents), February 1 (449 respondents), January 25 (419 respondents), January 18 (415 respondents), January 11 (416 respondents), January 4 (439 respondents), and last year on December 28 (416 respondents), December 21 (416 respondents), December 15 (438 respondents), December 8 (463 respondents), December 1 (441 respondents), November 24 (460 respondents), November 17 (425 respondents), November 10 (447 respondents), November 3 (418 respondents), October 27 (419 respondents), October 20 (409 respondents), October 13 (401 respondents), October 6 (416 respondents), September 29 (412 respondents), September 22 (422 respondents), September 15 (408 respondents), September 9 (406 respondents), September 2 (402 respondents), August 26 (414 respondents), August 19 (416 respondents), August 12 (400 respondents), August 5 (449 respondents), July 29 (403 respondents), July 22 (404 respondents), July 15 (454 respondents), July 8 (410 respondents), July 1 (444 respondents), June 24 (411 respondents), June 17 (432 respondents), June 10 (423 respondents), June 3 (464 respondents), May 27 (422 respondents), May 20 (439 respondents), May 13 (431 respondents), May 6 (446 respondents), April 29 (479 respondents), April 22 (418 respondents), April 15 (410 respondents), April 8 (450 respondents), April 1 (477 respondents), March 25 (495 respondents) and March 17–18 (1,152 respondents). The results have a margin of error of +/- 5%, with a 95% confidence interval. Not all charted week-over-week differences may be statistically significant.