DIpil Das
We discuss select findings from our US consumer survey and compare them to findings from prior weeks: December 28, December 21, December 15, December 8, December 1, November 24, November 17, November 10, November 3, October 27, October 20, October 13, October 6, September 29, September 22, September 15, September 9, September 2, August 26, August 19, August 12, August 5, July 29, July 22, July 15, July 8, July 1, June 24, June 17, June 10, June 3, May 27, May 20, May 13, May 6, April 29, April 22, April 15, April 8, April 1, March 25 and March 17–18.
1. What Consumers Bought In-Store and Online
Our newly added weekly survey questions cover the product categories that respondents had bought in-store and online in the past two weeks. We saw the following:
Figure 1. All Respondents: Proportions of Respondents That Had Bought Food or Beverages In-Store and Online in the Past Two Weeks (% of Respondents) [caption id="attachment_121558" align="aligncenter" width="725"]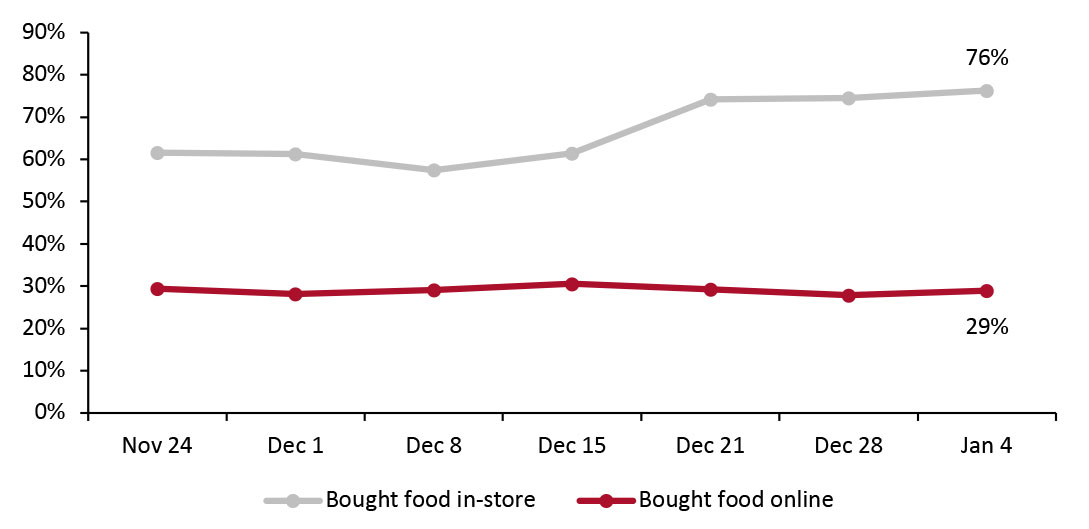 Base: US respondents aged 18+
Source: Coresight Research [/caption] 2. Retailers: Where Consumers Shopped Also new in our survey, each we ask respondents which retailers they bought food and nonfood products from over the two weeks preceding the survey date. Unsurprisingly given its scale, Walmart enjoys a clear lead among retailers for shops that consumers had bought food products from, accounting for 43% of respondents, almost double the proportion that bought from stores under Kroger banners. For nonfood products, Amazon remains the most-shopped retailer in recent weeks, followed by mass merchandisers including Target and Walmart. This is likely due, in part, to holiday season shopping. In our Holiday 2020 survey, we found that Amazon was the top retailer for gift purchases. Another reason could be that online shopping behaviors remained high at over 70% buying more online than they used to, and Amazon is known for providing fast and often-free home delivery. 3. Avoidance Rate of Any Public Place Remain High This week, the avoidance rate of any type of public place returned to an elevated level of 84%, compared to roughly eight in 10 in the past few weeks. Avoidance of retail and food-service locations both reached a record high this week, as Covid-19 cases continue to surge in many parts of the US:
Figure 2. All Respondents: Proportion That Are Currently Avoiding Shopping Centers/Malls (% of Respondents) [caption id="attachment_121559" align="aligncenter" width="725"]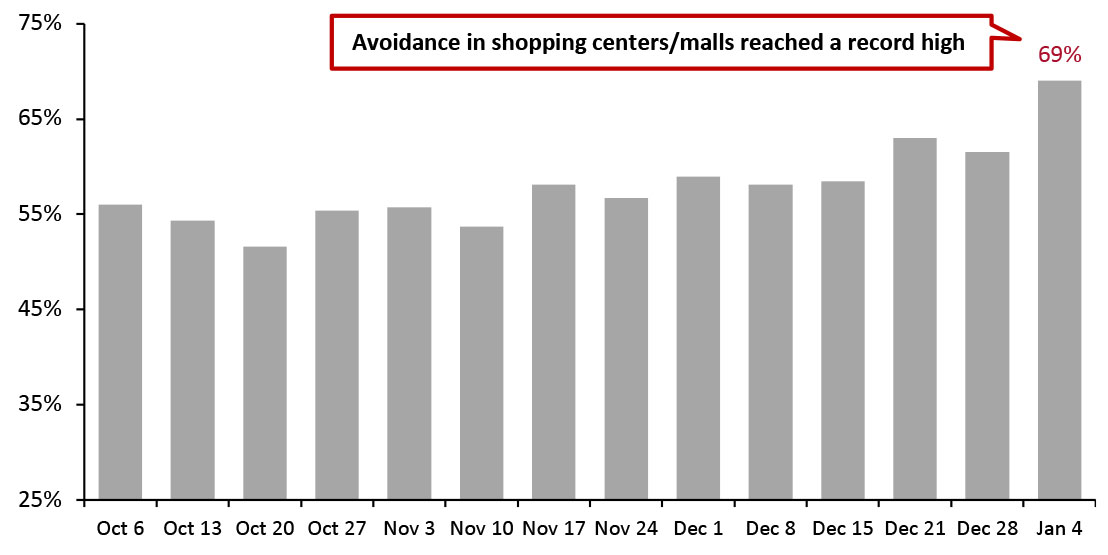 Base: US respondents aged 18+
Source: Coresight Research [/caption]
- In-store food shopping has seen an upward trend in recent weeks, reaching a new high of 76% this week, indicating that consumers are returning to physical grocery stores even though overall avoidance rate of public places continued to be high, which we discuss later in this report. Meanwhile, online food/grocery purchasing has remained very steady, with around 30% of consumers buying food online in each two-week period. Our most recent US CPG Sales Tracker, covering the four weeks ended November 29, 2020, recorded a further strengthening in online food and beverage sales growth, to 84% in the four weeks ended November 29. Our recent US Grocery E-Commerce report provides an outlook for 2021 and beyond.
- Clothing and footwear consistently over-indexes on online purchases compared to in-store. This week, three in 10 had bought apparel online, broadly level with last week. In-store apparel shopping has been gradually declining since mid-December, to 22% this week, although the level is still higher than the nadir on December 8. As avoidance rates of retail locations remained high, we may see in-store apparel shopping continue to decrease.
- Following the holiday season, we saw purchases for some discretionary categories, including beauty, electronics and home appliances drop to new lows this week for both online and offline channels.
Figure 1. All Respondents: Proportions of Respondents That Had Bought Food or Beverages In-Store and Online in the Past Two Weeks (% of Respondents) [caption id="attachment_121558" align="aligncenter" width="725"]
Source: Coresight Research [/caption] 2. Retailers: Where Consumers Shopped Also new in our survey, each we ask respondents which retailers they bought food and nonfood products from over the two weeks preceding the survey date. Unsurprisingly given its scale, Walmart enjoys a clear lead among retailers for shops that consumers had bought food products from, accounting for 43% of respondents, almost double the proportion that bought from stores under Kroger banners. For nonfood products, Amazon remains the most-shopped retailer in recent weeks, followed by mass merchandisers including Target and Walmart. This is likely due, in part, to holiday season shopping. In our Holiday 2020 survey, we found that Amazon was the top retailer for gift purchases. Another reason could be that online shopping behaviors remained high at over 70% buying more online than they used to, and Amazon is known for providing fast and often-free home delivery. 3. Avoidance Rate of Any Public Place Remain High This week, the avoidance rate of any type of public place returned to an elevated level of 84%, compared to roughly eight in 10 in the past few weeks. Avoidance of retail and food-service locations both reached a record high this week, as Covid-19 cases continue to surge in many parts of the US:
- The proportion of respondents that are currently avoiding shopping centers/malls increased by almost eight percentage points to 69% this week—the highest level we have ever seen.
- Avoidance of shops in general came at 56%, up nine percentage points from last week. The increasing avoidance in both shopping centers/malls and shops in generaldovetail with elevated levels of online shopping of over 70% this week.
- Food-service locations saw a week-over-week jump of eight percentage points, to a new high of 70% this week, and again became the most-avoided public places.
Figure 2. All Respondents: Proportion That Are Currently Avoiding Shopping Centers/Malls (% of Respondents) [caption id="attachment_121559" align="aligncenter" width="725"]
Source: Coresight Research [/caption]