albert Chan
What’s the Story?
This report presents the results of Coresight Research’s latest weekly survey of US consumers, undertaken on February 1. The report includes analysis of new questions on shopper behaviors and the impacts of the coronavirus outbreak. We explore the trends we are seeing from week to week, following previous weekly surveys.
What Shoppers Are Buying and Which Retailers They Are Buying From
What Consumers Bought In-Store and Online
We saw week-over-week decreases in in-store shopping for some essential categories, while most discretionary purchases still took place online.
- Despite the elevated level of respondents who had bought food and beverages in-store, consumers that had bought such products online remained at a consistent week-over-week proportion of 29.2%, after declining to 23.9% two weeks ago.
- Other essentials, including health, household and personal care products all saw slight week-over-week decreases of in-store shoppers. Personal care products witnessed the largest drop, of almost seven percentage points week over week.
- Most discretionary purchases were online, except for in home improvement and beauty.
- Online purchases of clothing and footwear fell back slightly this week, after surging by more than six percentage points last week. Some 27.4% had bought clothing and footwear in the latest two-week period, versus 18.3% that had done so in a store.
Figure 1. All Respondents: What They Have Bought In-Store and Online in the Past Two Weeks (% of Respondents)
[caption id="attachment_122925" align="aligncenter" width="700"]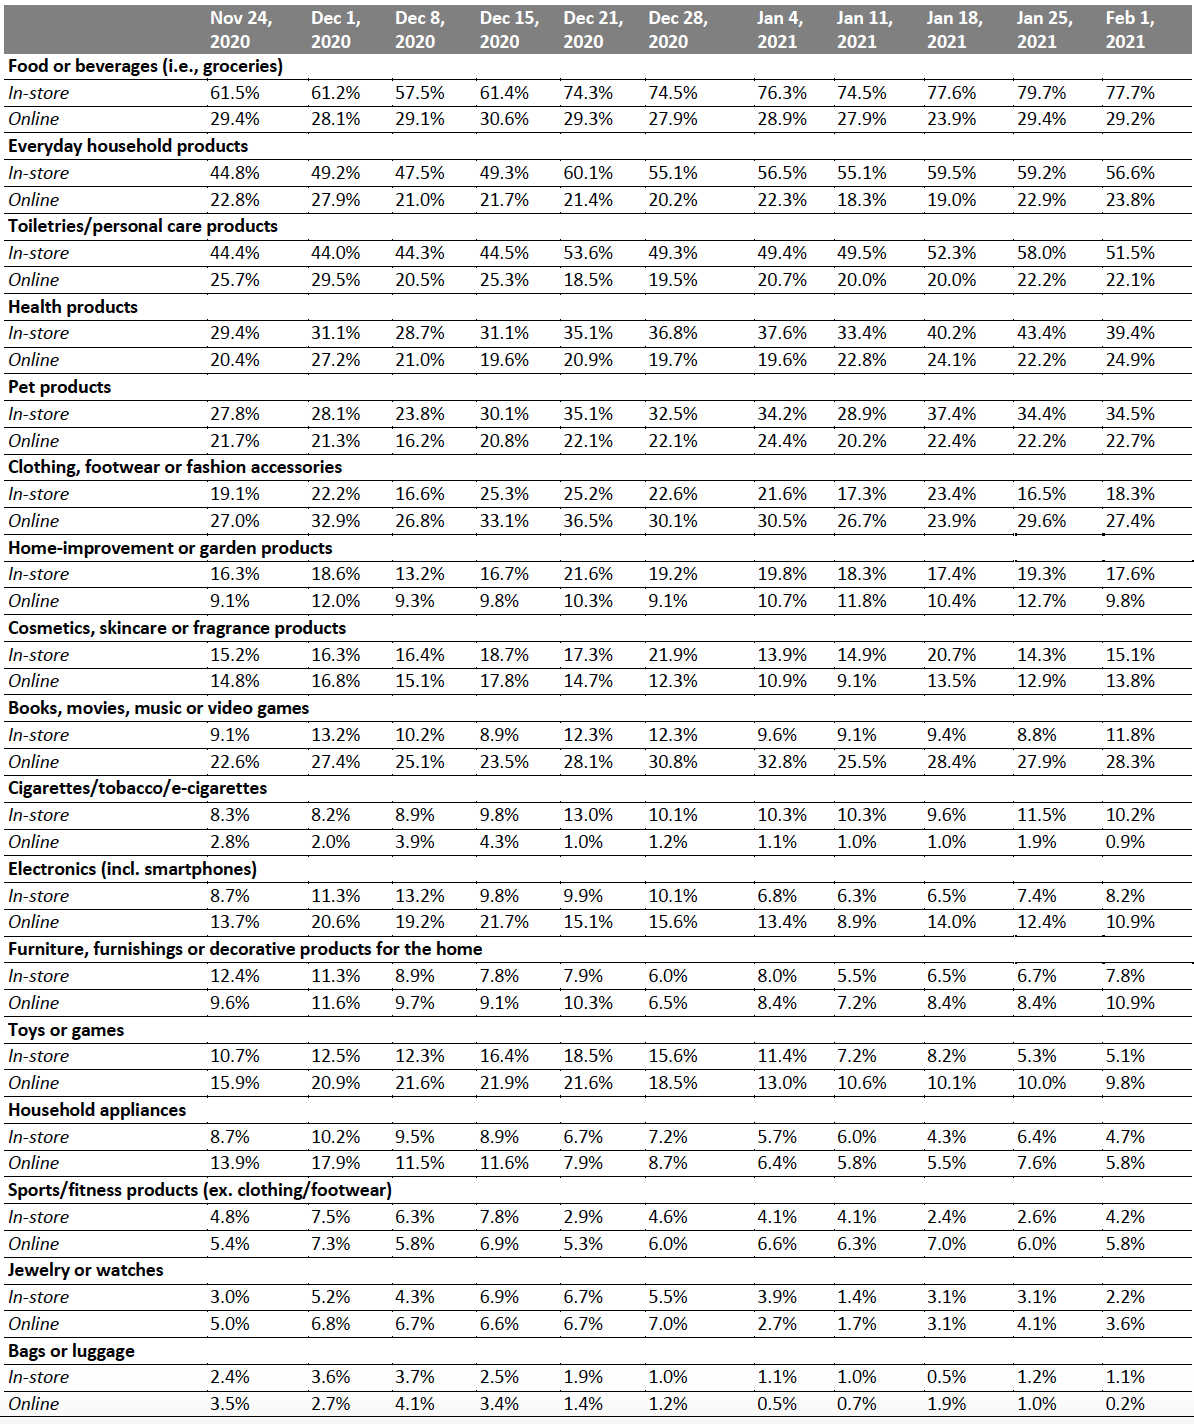 Respondents could select multiple options
Base: US respondents aged 18+
Source: Coresight Research5[/caption]
Which Retailers Consumers Purchased Food and Nonfood Products From
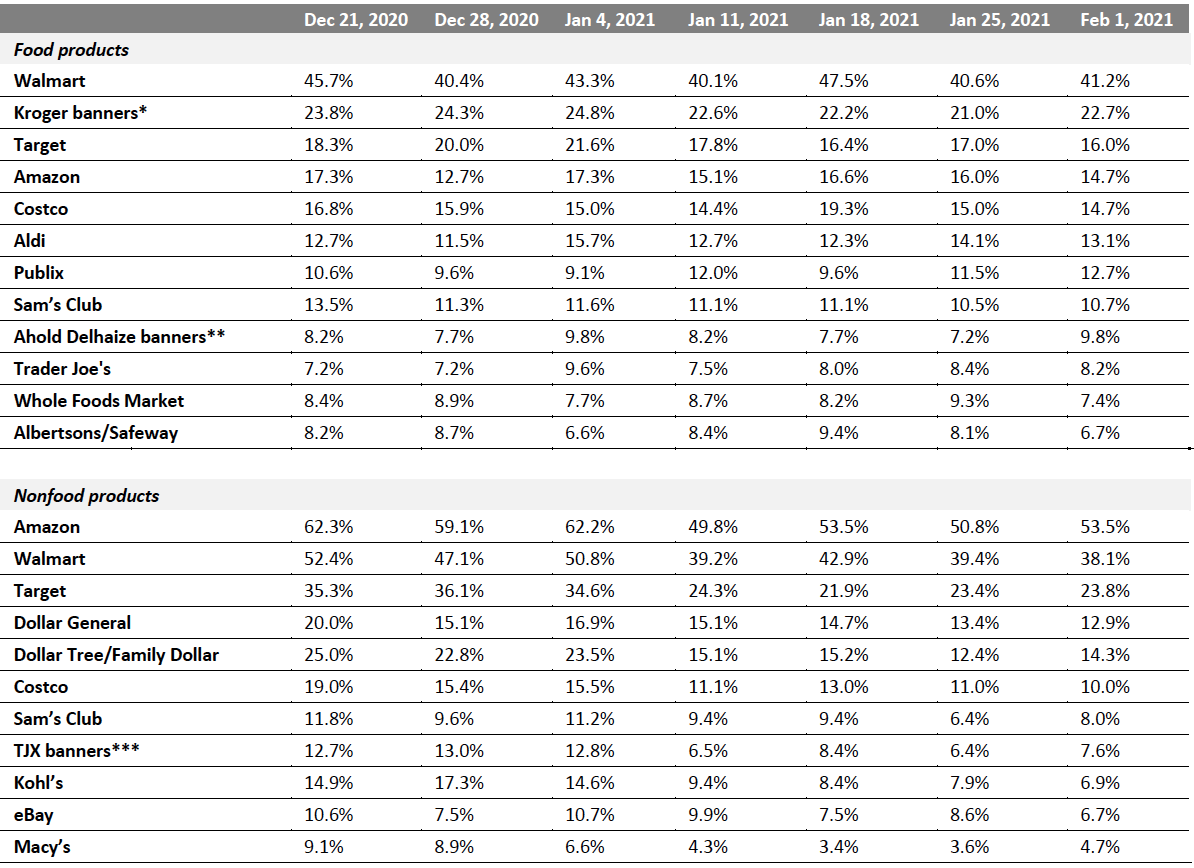
Since December 21, 2020, we have asked consumers which retailers they bought from in the two-week period preceding the survey, for both food and nonfood products.
The proportion of consumers shopping for both food and nonfood products remained fairly stable week over week, with all changes within the margin of error.
For food purchases:
- Since December 21, 2020, we have seen fluctuations in the proportion of shoppers that have bought from all 12 food retailers, although market leader Walmart has consistently attracted almost double the proportion of consumers of its closest competitor.
- Albertsons/Safeway appeared to lose shoppers for the second consecutive week—with only 6.7% of grocery shoppers. On the other hand, Publix has seen an upward trend in shopper numbers in the past two weeks.
- Target and Whole Foods shopper numbers reached the lowest levels since we started asking this question.
For nonfood purchases:
- The proportion of respondents that had bought nonfood products from four of the 11 retailers fell to new lows this week, including Dollar General, eBay, Kohl’s and Walmart.
- Kohl’s saw shopper numbers decline for the fifth straight week, from 17.3% on December 28, 2020 to 6.9% this week—representing a 10-percentage-point decline. This puts Kohl’s behind TJX banners.
Figure 2. All Respondents: Which Retailers They Have Bought Food Products From and Which Retailers They Have Bought Nonfood Products From in the Past Two Weeks (% of Respondents) [caption id="attachment_122926" align="aligncenter" width="700"]
 Respondents could select multiple options
Base: US Internet users aged 18+
*Kroger banners include City Market, Fred Meyer, Harris Teeter, King Soopers, Kroger, Ralphs and Smith’s Food & Drug
**Ahold Delhaize banners include Food Lion, Giant, Hannaford and Stop & Shop
***TJX banners include HomeGoods, HomeSense, Marshalls, Sierra and T.J. Maxx
Source: Coresight Research[/caption]
What Shoppers Are Doing and Where They Are Going
More Consumers Are Comfortable Returning to Some Regular Activities
Complementing our questions about purchases in the past two weeks, each week, we ask consumers what activities they have done in the past two weeks. This week, the proportion of respondents broadly leveled off for half of the options we provided for recent activities.
- Consumers’ visits to food-service locations continue to recover from low levels in December and the first half of January this year. Some 31.6% had dined in a restaurant—the highest level since October, and 14.0% had gone to a coffee shop in the past two weeks. Moreover, some 10.2% had gone to a bar—the highest level since we started asking this question in June last year. This aligns with the slight decline in avoidance of food-service locations, which we discuss in the next section.
- Consumers appeared slightly more comfortable to return to some regular activities. The proportion that reported getting haircuts has increased for the third straight week, while the proportion of consumers reporting that they had gone to a gym or fitness class reached a record high of 10.2%.
- Visits to an open-air shopping center remained stable at 22% week over week, up almost six percentage points from the level three weeks ago. The proportion of consumers that had recently gone to an enclosed shopping centers came in at 14.0%.
Figure 3. All Respondents: What Activities They Have Done in the Past Two Weeks (% of Respondents)
[caption id="attachment_122927" align="aligncenter" width="700"]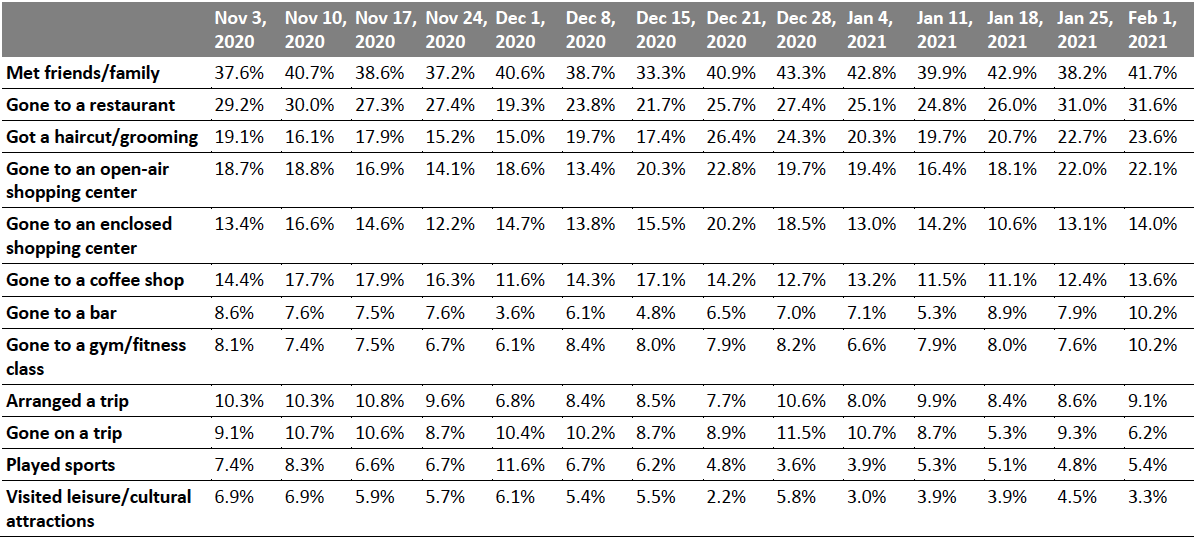 Respondents could select multiple options
Base: US respondents aged 18+
Source: Coresight Research[/caption]
Over Eight in 10 Are Currently Avoiding Public Places
In this week’s survey, the avoidance rate of any type of public area stood at 83.5%, versus 81.9% last week and 80.7% two weeks ago. Despite the slight increase in overall avoidance, avoidance rates were down week over week in seven of the 13 options provided.
- Shopping centers/malls remained the most-avoided public places, with 64.6% of respondents currently avoiding such locations, slightly down from 68.3% last week.
- Avoidance of food service locations dropped to 62.1% this week, compared to two-thirds last week. The proportion is almost eight percentage points lower than a month ago and the lowest level since January.
- Echoing findings discussed above, a higher proportion of consumers had gone to gyms or fitness classes—the avoidance rate in gyms slid to 51.0% this week, the lowest since December 2020.
- We have seen an upward trend in avoidance of international travel, with a surge to 62.1% this week, further indicating a slow recovery for international travel ahead.
Figure 4. All Respondents: Public Places That Respondents Are Currently Avoiding (% of Respondents)
[caption id="attachment_122928" align="aligncenter" width="700"]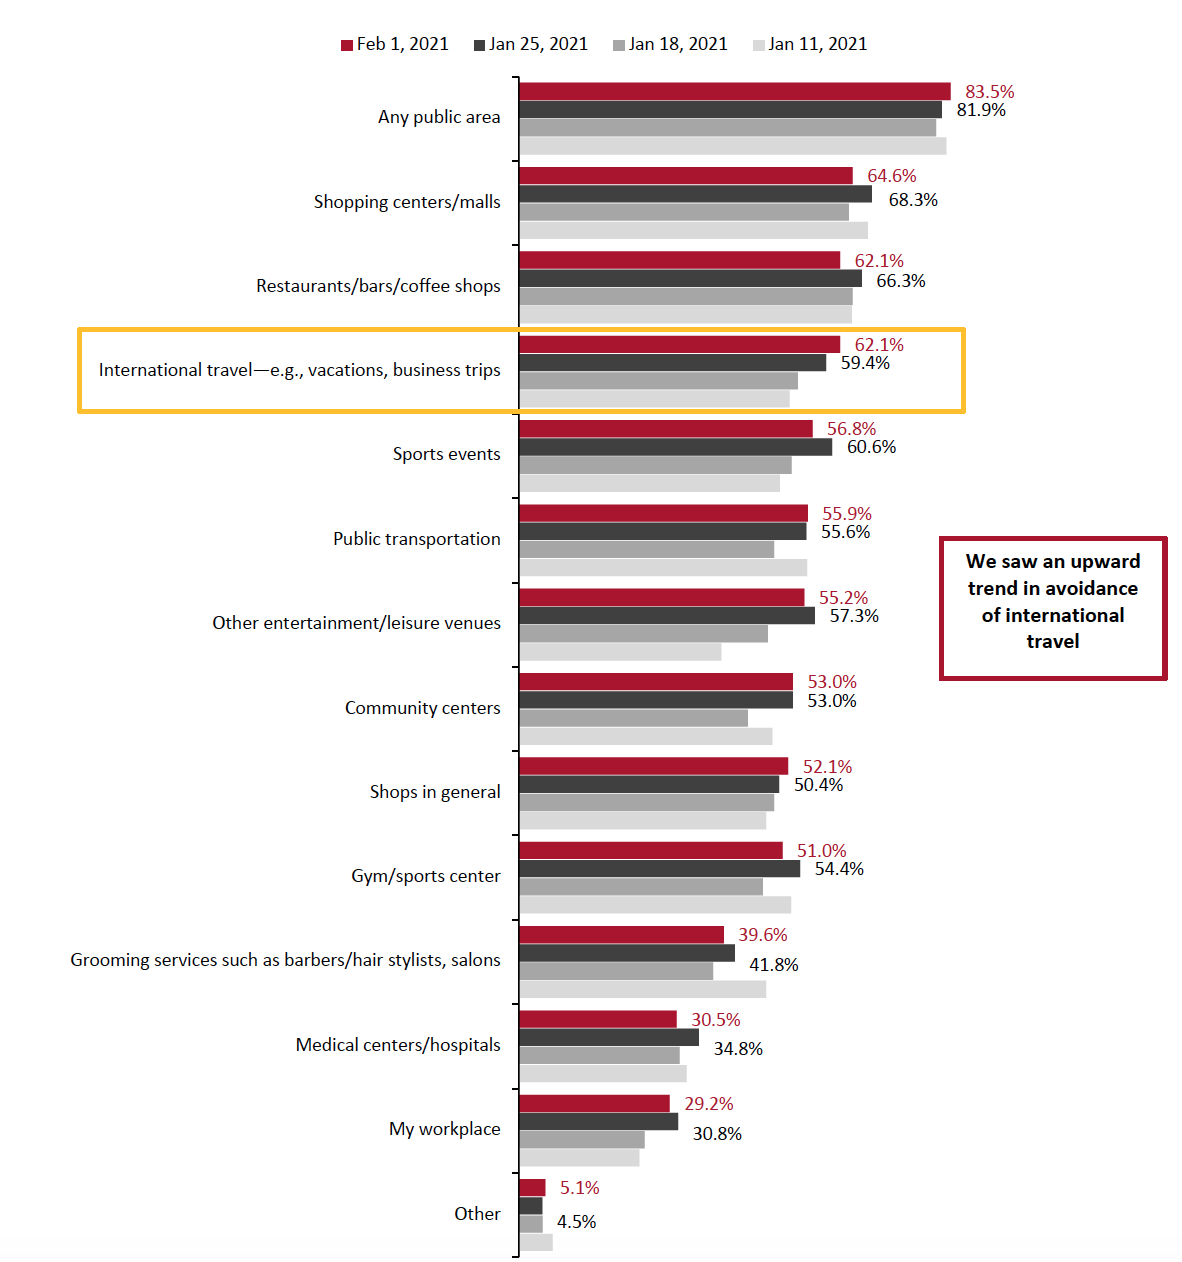 Respondents could select multiple options
Base: US respondents aged 18+
Source: Coresight Research[/caption]
Reviewing Trend Data in Current Purchasing Behavior
What Consumers Are Currently Buying More Of and Less Of
The proportion of consumers buying more of any product due to the pandemic decreased by six percentage points, from 44.6% to 43.4%. The proportion of consumers buying less of any product also dipped slightly this week, to 45.2%. This is the first time since September 2020 that the proportion buying more is below those buying less due to the pandemic.
- Buying more in any category and buying less in any category were not mutually exclusive options, so respondents could answer yes to both.
Buying more: The week-over-week decline in the proportion of consumers that are buying more overall was due to a lower proportion in those buying more essentials, including health, household and personal care products. Household and personal care products both decreased week over week by roughly five percentage points.
Buying less: The proportion of consumers buying less discretionary categories remained relatively high this week: Some 29.6% are buying less clothing and footwear, broadly leveled from last week. Some 19.2% are buying fewer beauty products and 13.6% are buying less in home categories.
Ratio of less to more: The ratios of the proportion of respondents buying less to the proportion buying more fell in all of the discretionary categories except beauty this week:
- The ratio for clothing and footwear returned to the level two weeks ago, at 5.3, compared to 7.1 last week.
- The ratios for electronics went down to 1.4 this week, from 3.1 last week, representing the lowest level in 2021 so far.
- The ratio for beauty rose to 4.5, from 3.8 last week.
- The ratio for home stood at 2.9, down from 3.7 last week but higher than 1.8 two weeks ago.
Figure 5. All Respondents: What They Are Currently Buying More/Less Of Due to the Coronavirus Outbreak (% of Respondents)
[caption id="attachment_122929" align="aligncenter" width="700"]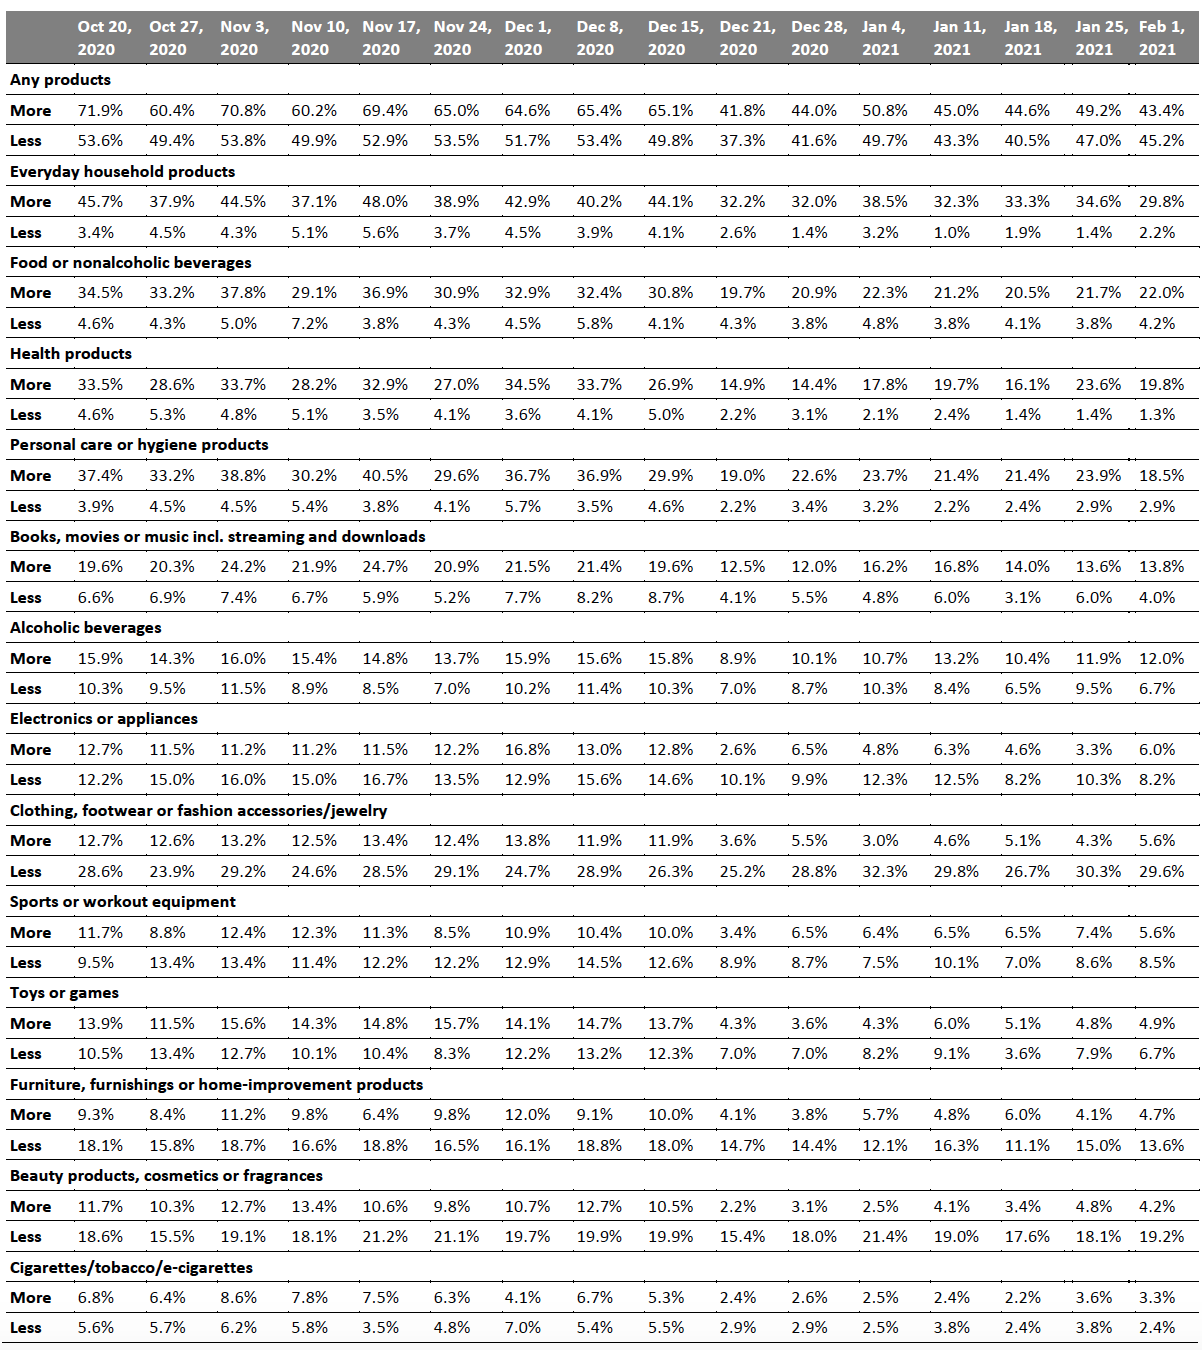 Base: US respondents aged 18+
Source: Coresight Research[/caption]
Fewer Than Half Expect To Retain Changed Behaviors in the Long Term
We asked respondents whether they think they will keep some of the behaviors they have adopted during the coronavirus crisis in the long term. This week, some 44.8% of respondents expect to retain some changed behaviors, the lowest level since we started asking this question in late March, implying that consumers may be more willing to return to their regular activities than previously expected.
Figure 6. All Respondents: Expectation To Behave Differently/Retain Changed Way of Living in the Long Term (% of Respondents)
[caption id="attachment_122930" align="aligncenter" width="700"]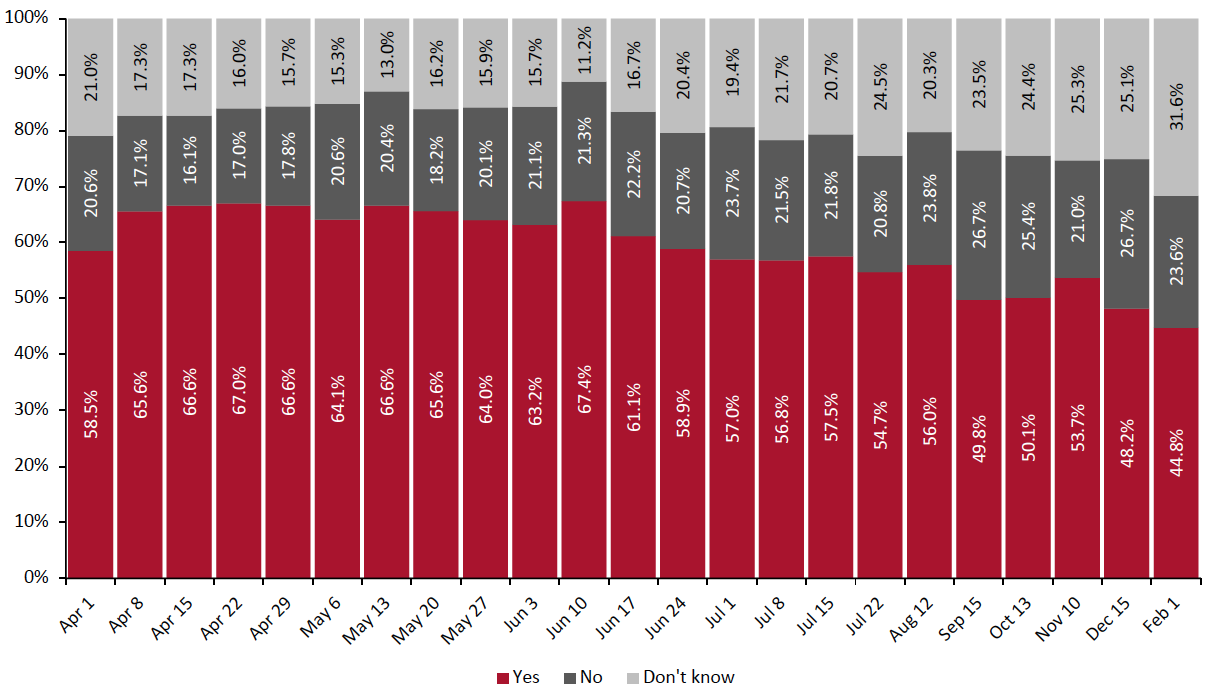 Question not asked every week
Base: US respondents aged 18+
Source: Coresight Research[/caption]
For 10 of the 11 behavior options provided, the proportions of respondents declined this week in comparison to the last time we asked the question on December 15, 2020. Most changes were within the margin of error.
Surprisingly, using contactless payment options in store more often witnessed the largest decrease, of 10 percentage points from last time we asked the question, to only 10.2%—the lowest level we have seen. In our Retail 2021: Global Trends report, we predict sustained growth in demand and uptake in digital payment in 2021.
Having more hygienic practices is the only behavior that increased in proportion, compared to last time we asked the question. Some 28.7% expect to retain this behavior in the long term, versus one-quarter on December 15, 2020. It also returned as the top behavior that respondents expect to retain after the crisis.
The proportion of respondents expecting to have fewer physical interactions and wear masks in public in the long term both dropped to record lows.
Figure 7. All Respondents: What Changed Behaviors They Expect To Retain (% of Respondents)
[caption id="attachment_122931" align="aligncenter" width="700"]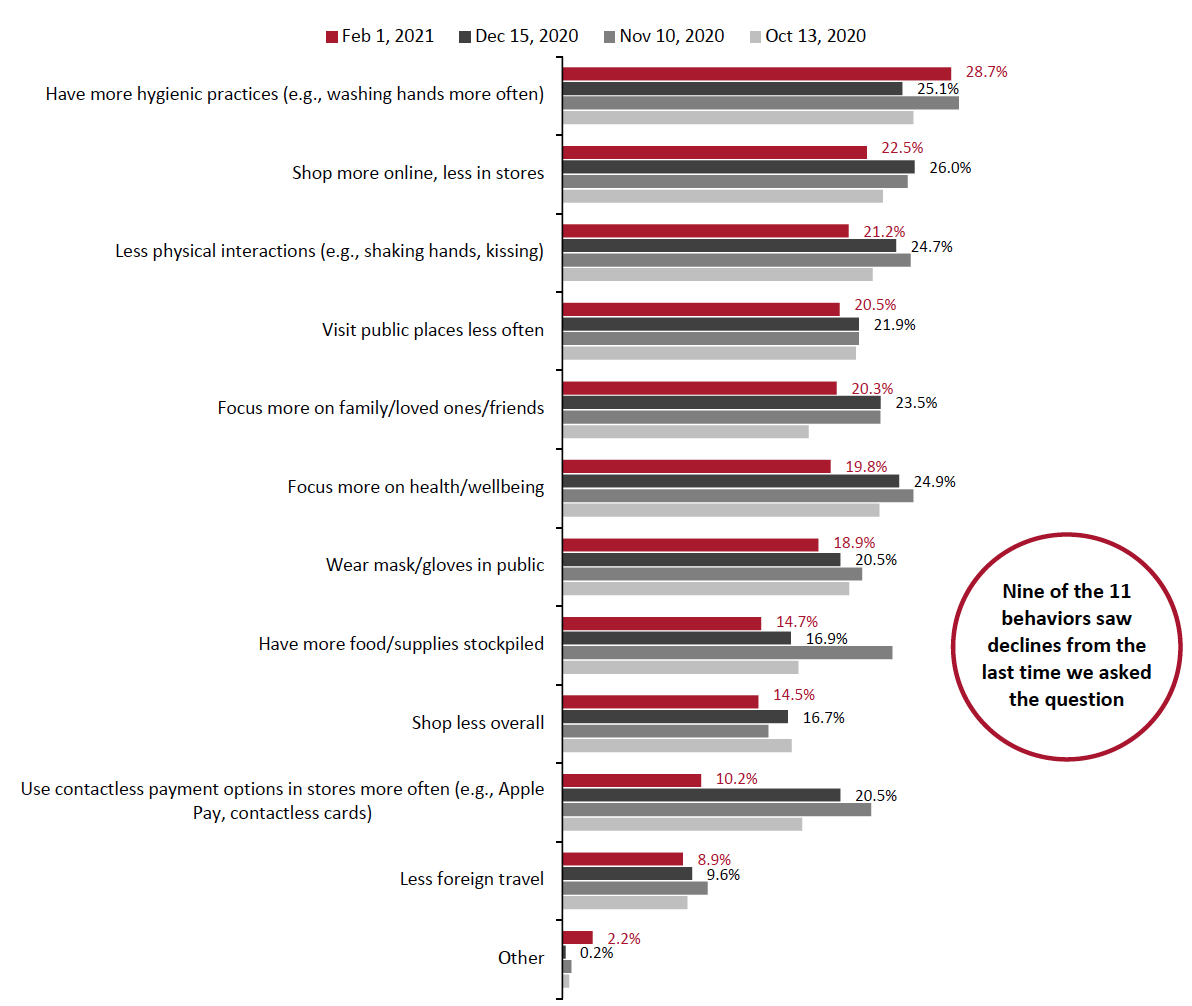 Respondents could select multiple options
Base: US respondents aged 18+
Source: Coresight Research[/caption]
In the chart below, we show trended data in three of the metrics charted above. The medium-term trends suggest increasing intentions to return to more normal ways of living and shopping, with all three metrics appearing to be past their peak and trending downward:
- Some 22.5% of respondents expect to shop more online, less in stores in the long term, down from 26.0% on December 15, 2020. This behavior has trended downward since peaking at 30% of respondents in early June last year, although there have been some fluctuations. Among all 11 behaviors, “shop more online, less in stores” has the smallest difference between its peak and this week’s level, making it the most likely behavior to be retained in the long term.
- One-fifth of consumers said that they expect to visit public places less often in the long term, the lowest level since April last year. Compared to the peak of 34.3%, expectations for this behavior have plunged by 13 percentage points.
- A positive sign for the retail industry—more consumers may return to their pre-pandemic consumption level after the crisis ends. The proportion of consumers expecting to retain the behavior of shopping less overall decreased to 14.5%, from 16.7% on December 15, 2020.
Figure 8. All Respondents: Selected Behaviors They Expect To Retain (% of Respondents)
[caption id="attachment_122932" align="aligncenter" width="700"]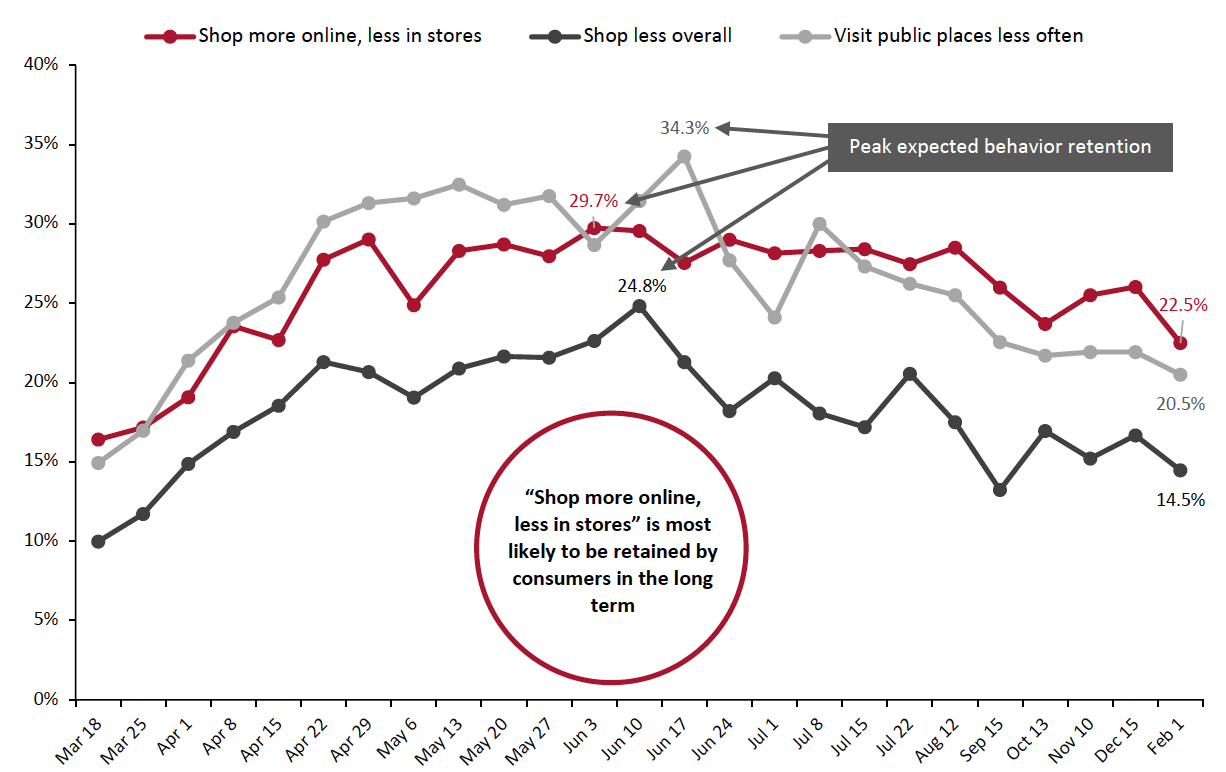 Question not asked every week
Base: US respondents aged 18+
Source: Coresight Research[/caption]
What We Think
As Covid-19 cases in the US have edged downward since the beginning of January, this week we saw a slight increase in consumers becoming more comfortable returning to their regular activities, such as dining in restaurants and going to gyms, despite the still-high avoidance rate of public places. On the other hand, after a solid holiday season for US retail, there is still a long way ahead for consumers’ discretionary purchases to revert to pre-pandemic levels.
The return to normalcy in the US will largely depend on the speed of the vaccine rollout nationwide. According to Bloomberg, 33.7 million doses have been given in the US as of February 3, which falls short of federal projections. The Biden administration announced a new program that will deliver some doses directly from government to retail pharmacies beginning February 11 to accelerate vaccination. Companies including CVS, Kroger, Walgreens and Kroger said that they are prepared to vaccinate tens of millions of people per month. This joint effort could help to step up the pace of vaccinations, and we may see a more sustained recovery in consumer shopping and spending behavior in the next few months.
Our recurring weekly questions indicated the following:
- Online Grocery: Online grocery shopping levels returned to almost 30% this week after falling to an average of 27.5% for the month of January. Nevertheless, in-store shopping for food and beverage has been creeping higher since December last year, reaching 77.7% this week. Our latest monthly US CPG Sales Tracker recorded a slowdown in the year-over-year growth rate for online food sales.
- Apparel: Post holiday season, consumers’ purchases of clothing and footwear have dropped significantly. This week, apparel purchases slightly improved, with the ratio of consumers buying less apparel to those buying more apparel falling to 5.3 this week, from 7.1 last week. Some 27.4% of respondents reported they had bought apparel online—10 percentage points higher than the 18.3% that had done so in-store.
- E-commerce: Consumers generally chose to buy essentials in-store, though this week, in-store purchases for health, household and personal care products all declined. Most discretionary purchases were done online. In the long term, “shop more online, less in stores” is the behavior that is most likely to be retained post crisis—some 22.5% said they expect to do so.
Methodology
We surveyed respondents online on February 1 (449 respondents), January 25 (419 respondents), January 18 (415 respondents), January 11 (416 respondents), January 4 (439 respondents), December 28 (416 respondents), December 21 (416 respondents), December 15 (438 respondents), December 8 (463 respondents), December 1 (441 respondents), November 24 (460 respondents), November 17 (425 respondents), November 10 (447 respondents), November 3 (418 respondents), October 27 (419 respondents), October 20 (409 respondents), October 13 (401 respondents), October 6 (416 respondents), September 29 (412 respondents), September 22 (422 respondents), September 15 (408 respondents), September 9 (406 respondents), September 2 (402 respondents), August 26 (414 respondents), August 19 (416 respondents), August 12 (400 respondents), August 5 (449 respondents), July 29 (403 respondents), July 22 (404 respondents), July 15 (454 respondents), July 8 (410 respondents), July 1 (444 respondents), June 24 (411 respondents), June 17 (432 respondents), June 10 (423 respondents), June 3 (464 respondents), May 27 (422 respondents), May 20 (439 respondents), May 13 (431 respondents), May 6 (446 respondents), April 29 (479 respondents), April 22 (418 respondents), April 15 (410 respondents), April 8 (450 respondents), April 1 (477 respondents), March 25 (495 respondents) and March 17–18 (1,152 respondents). The results have a margin of error of +/- 5%, with a 95% confidence interval. Not all charted week-over-week differences may be statistically significant.