DIpil Das
What’s the Story?
This report presents the results of Coresight Research’s latest weekly survey of US consumers, undertaken on March 8. The report includes analysis of questions on shopper behaviors and the impacts of the coronavirus outbreak. We explore the trends we are seeing from week to week, following previous weekly surveys.What Shoppers Are Doing and Where They Are Going
Consumers Return to Social Activities Each week, we ask consumers what activities they have done in the past two weeks. The proportion of consumers that reported taking part in social activities, such as going to a restaurant or meeting up with friends, rose this week, while just three of the 12 categories we surveyed saw decreases.- The proportion of consumers that reported going to a restaurant rose for the fourth straight week, to 35.1%, the highest value recorded in our survey since September and an increase of more than 10 percentage points from the proportion recorded just one month ago. Falling Covid case rates and warmer weather should see this trend continue in the spring.
- A rise in the proportion of consumers meeting up with friends and family unsurprisingly accompanied the increase in restaurant goers: The proportion of consumers that reported meeting friends and family rose more than six percentage points this week, to 48.8%, which is also the highest value we have recorded since September.
- The proportion of consumers that reported arranging a trip rose for the fourth straight week, to 14.0%, more than double the proportion we recorded just one month ago. Consumers appear to be increasingly optimistic about the prospects of an upcoming end to the pandemic and are planning vacations accordingly.
Figure 1. All Respondents: What Activities They Have Done in the Past Two Weeks (% of Respondents) [caption id="attachment_124498" align="aligncenter" width="725"]
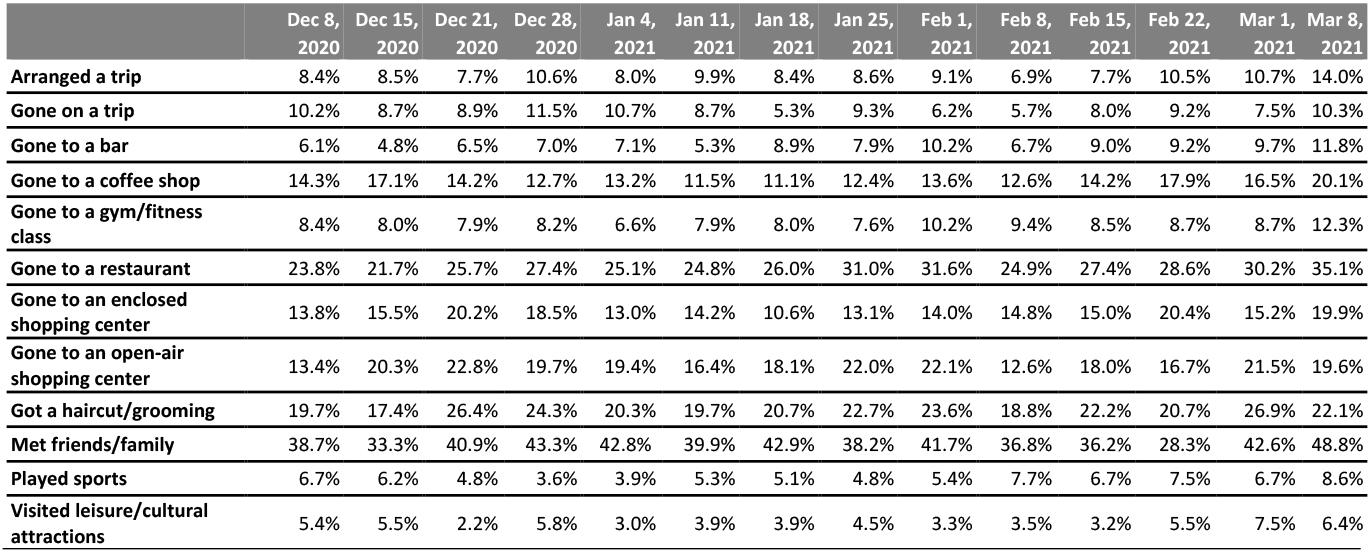 Respondents could select multiple options
 Base: US respondents aged 18+
Source: Coresight Research [/caption] High-Income Consumers Lead the Shift Back to Experience Spending Over the past three months, consumers have slowly become more comfortable venturing into public places and partaking in activities that involve interacting with others. The rates at which high and middle-income consumers, in particular, have report visiting restaurants and attending gyms/fitness classes increased disproportionately compared to low-income consumers over the past three months. The same applies to the rate that high and middle-income respondents have reported planning trips over the last three months—indicating that their behaviors are shifting at a much quicker pace than respondents in the lowest income group, as illustrated in Figure 2 below.
Figure 2. All Respondents: What Activities They Have Done in the Past Two Weeks, Percentage Point Change from December 1, 2020 to March 8, 2021 [caption id="attachment_124499" align="aligncenter" width="725"]
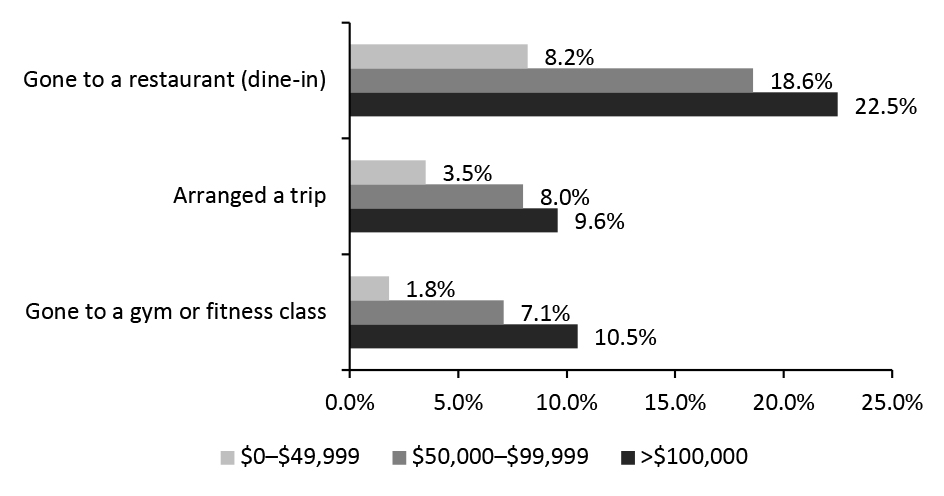 Base: US respondents aged 18+
 Respondents could select more than one option
Source: Coresight Research [/caption] The proportion of consumers with incomes between $50,000 and $99,999 and greater than $100,000 that reported visiting a restaurant in the past two weeks rose by 18.6 and 22.5 percentage points, respectively. By contrast, the proportion of consumers with incomes below $50,000 rose by just 8.2 percentage points in the same timeframe. Similar patterns played out in consumers’ changing propensity to plan trips and visit the gym or attend a fitness class. While the proportion of consumers with incomes under $50,000 that reported planning a trip rose by just 3.5 percentage points over the past three months, the proportion for consumers in the middle and highest income group in our survey each rose by at least eight percentage points. Likewise, the proportion of consumers with incomes of at least $100,000 that reported going to a gym or fitness class rose by 10.4 percentage points over the three-month timespan, while the increase among consumers with incomes of less than $50,000 was just 1.8 percentage points. Avoidance of Every Public Place Has Declined This Year This week, the avoidance rate of any type of public area came in at 77.5%, continuing a downward trend in avoidance. Looking at long-term trends, since December, we have seen a decline in avoidance of every public place we ask respondents about.
- Avoidance of restaurants, shops in general, and shopping centers has seen the most drastic decline in the past few months—the rate for each option has fallen by more than 14 percentage points since the peak in avoidance in January.
- Avoidance of certain public areas, typically those that consumers have less discretion in determining their visits, has been more stagnant—the proportion of consumers that have reported avoiding their workplace only dropped by 1.6 percentage points between December 8 and March 8.
- Despite this week’s rise in consumers planning vacations, many still appear cautious about traveling in the short term. The proportion of consumers that reported avoiding international travel remained at over 50% this week, down by just 0.3 percentage points from the value on December 8.
Figure 3. All Respondents: Public Places That Respondents Are Currently Avoiding (% of Respondents) [caption id="attachment_124524" align="aligncenter" width="725"]
Base: US respondents aged 18+
Source: Coresight Research [/caption]
What Shoppers Are Buying and Which Retailers They Are Buying From
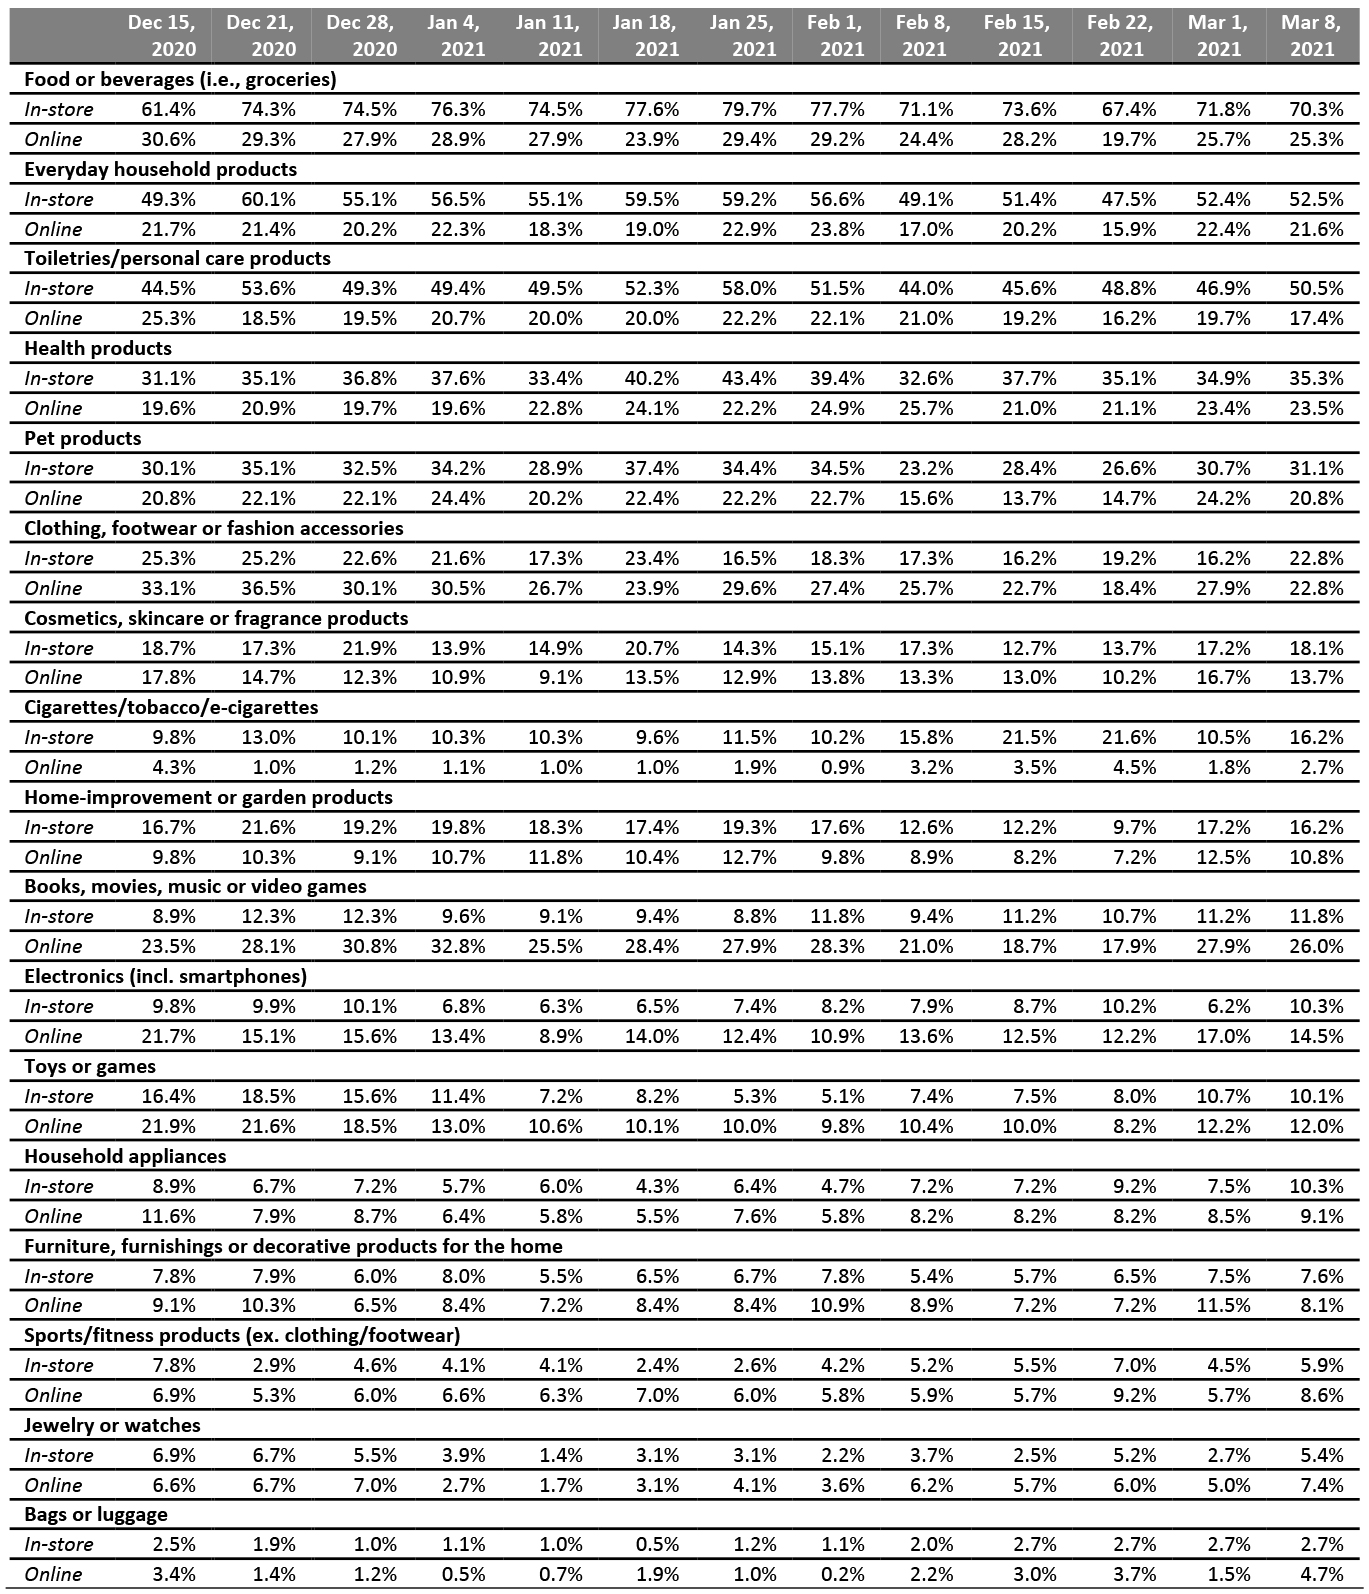
What Consumers Bought In-Store and Online Since the beginning of the year, we have seen purchases of essentials remain mostly flat—unsurprising given that many consumers have to buy these items regardless of the virus or the economic environment. It is somewhat surprising, however, that the ratio of consumers buying these products online and in-store has remained flat, despite dropping virus case numbers. This could be indicative of a long-term stickiness in the increased number of consumers buying essential products online. We have seen an increase in the proportion of consumers purchasing discretionary products, both in-store and online, since the start of 2021. While this change has been relatively modest (both increased by just a few percentage points), a look at long-term data confirms that this has been a consistent movement in this sector. The chart below shows averages for essentials and discretionary categories (see Figure 5 for the full breakdown). For essentials, these are everyday household products, food and beverages, health products, pet products and tobacco products. Discretionary includes most of the remaining categories shown in Figure 5.Figure 4. All Respondents: What They Have Bought Online and In-Store, Essentials (Left Axis) vs. Discretionary Products (Right Axis), Averages [caption id="attachment_124501" align="aligncenter" width="725"]
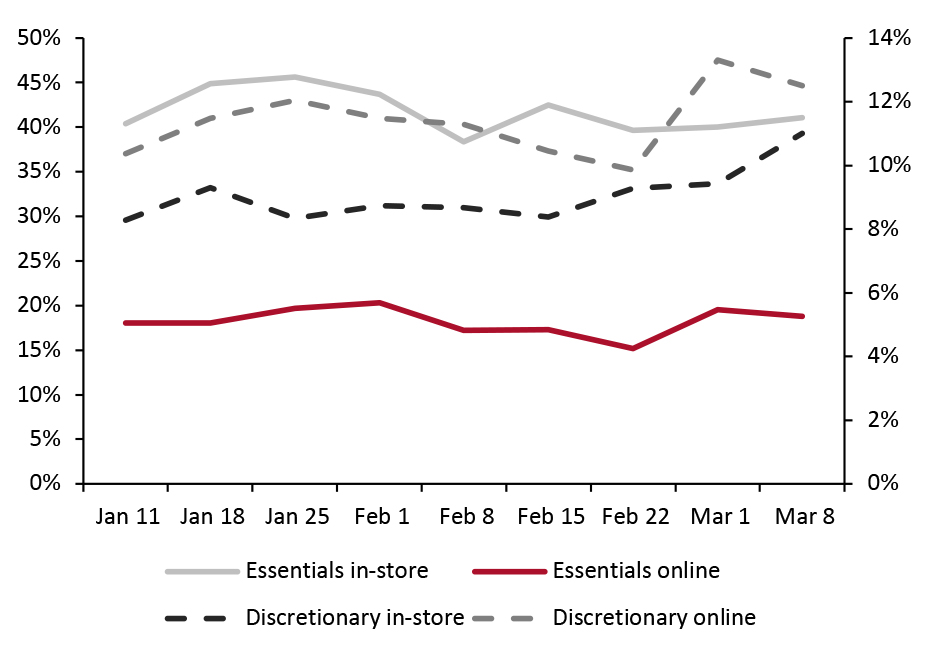 Respondents could select multiple options
 Base: US respondents aged 18+
Source: Coresight Research [/caption] This week, saw a few notable changes in consumer purchasing habits. We highlight two key findings:
- Consumers continue to be more willing to purchase furniture in stores: The proportion of consumers buying furniture in a store rose for the fourth straight week to 7.6%.
- Consumers switched their methods for buying clothing: The proportion of consumers buying clothes online and in-store fell and rose by around five percentage points, respectively.
Figure 5. All Respondents: What They Have Bought In-Store and Online in the Past Two Weeks (% of Respondents) [caption id="attachment_124502" align="aligncenter" width="725"]
 Respondents could select multiple options
 Base: US respondents aged 18+
Source: Coresight Research [/caption] Which Retailers Consumers Purchased Food and Nonfood Products From Since December 21, 2020, we have asked consumers which retailers they bought from in the two-week period preceding the survey, for both food and nonfood products. For food purchases:
- The proportion of consumers that reported shopping at Walmart jumped by just over 10 percentage points this week to 53.7%, the second-highest figure we have recorded, after weak shopper numbers last week.
- Whole Foods saw the highest proportion of shoppers report that they had bought food products from the retailer since we began asking this question.
- As with food purchases, Walmart saw a strong rebound in shoppers that reported purchasing nonfood products in our survey. Shopper numbers jumped by more than 10 percentage points this week.
- Dollar stores continued to thrive, indicating that many consumers are still looking for bargains amidst the economic crisis caused by the pandemic. Dollar and discount stores account for a plurality of the store openings we have tracked so far this year.
Figure 6. All Respondents: Which Retailers They Have Bought Food Products From and Which Retailers They Have Bought Nonfood Products From in the Past Two Weeks (% of Respondents) [caption id="attachment_124503" align="aligncenter" width="725"]
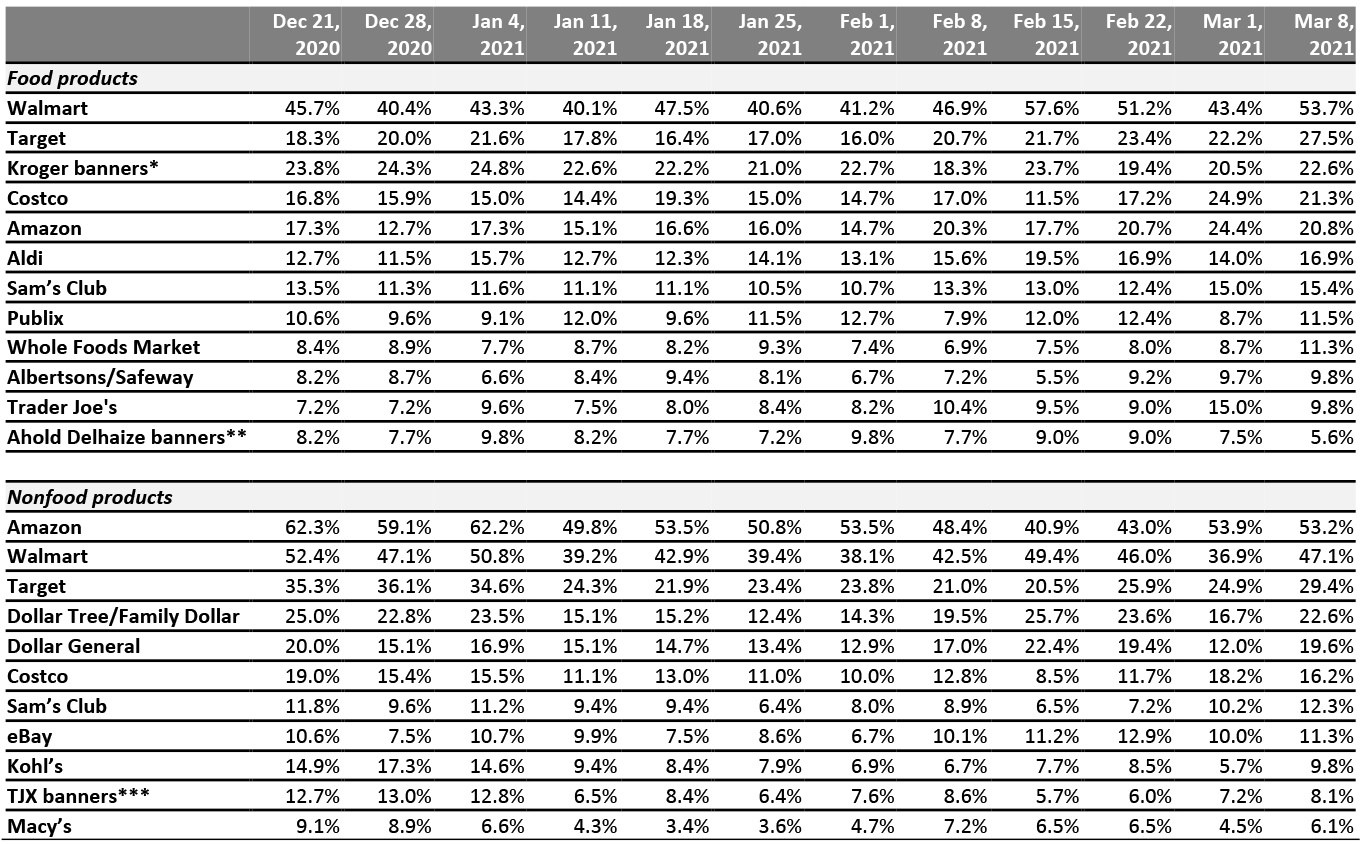 Respondents could select multiple options
 Base: US Internet users aged 18+
*Kroger banners include City Market, Fred Meyer, Harris Teeter, King Soopers, Kroger, Ralphs and Smith’s Food & Drug
**Ahold Delhaize banners include Food Lion, Giant, Hannaford and Stop & Shop
***TJX banners include HomeGoods, HomeSense, Marshalls, Sierra and T.J. Maxx
Source: Coresight Research [/caption]
Reviewing Trend Data in Current Purchasing Behavior
What Consumers Are Currently Buying More Of and Less Of The proportion of consumers buying more of any product due to the coronavirus declined slightly. This week, 61.5% of consumers reported purchasing more of any product and those buying less of any product due to the coronavirus stood at 48.0%, also a slight decrease from last week.- Buying more in any category and buying less in any category were not mutually exclusive options, so respondents could answer yes to both.
- The ratio for food or non-alcoholic beverages more than doubled this week, as consumers deprioritized essentials spending that has defined the pandemic up to this point.
- The ratio of buying less to more for toys and games also more than doubled this week, the only discretionary category to see a significant rise.
- The ratio for personal care and hygiene products fell by 34% this week, the largest drop for any category.
Figure 7. All Respondents: What They Are Currently Buying More/Less Of Due to the Coronavirus Outbreak (% of Respondents) [caption id="attachment_124504" align="aligncenter" width="725"]
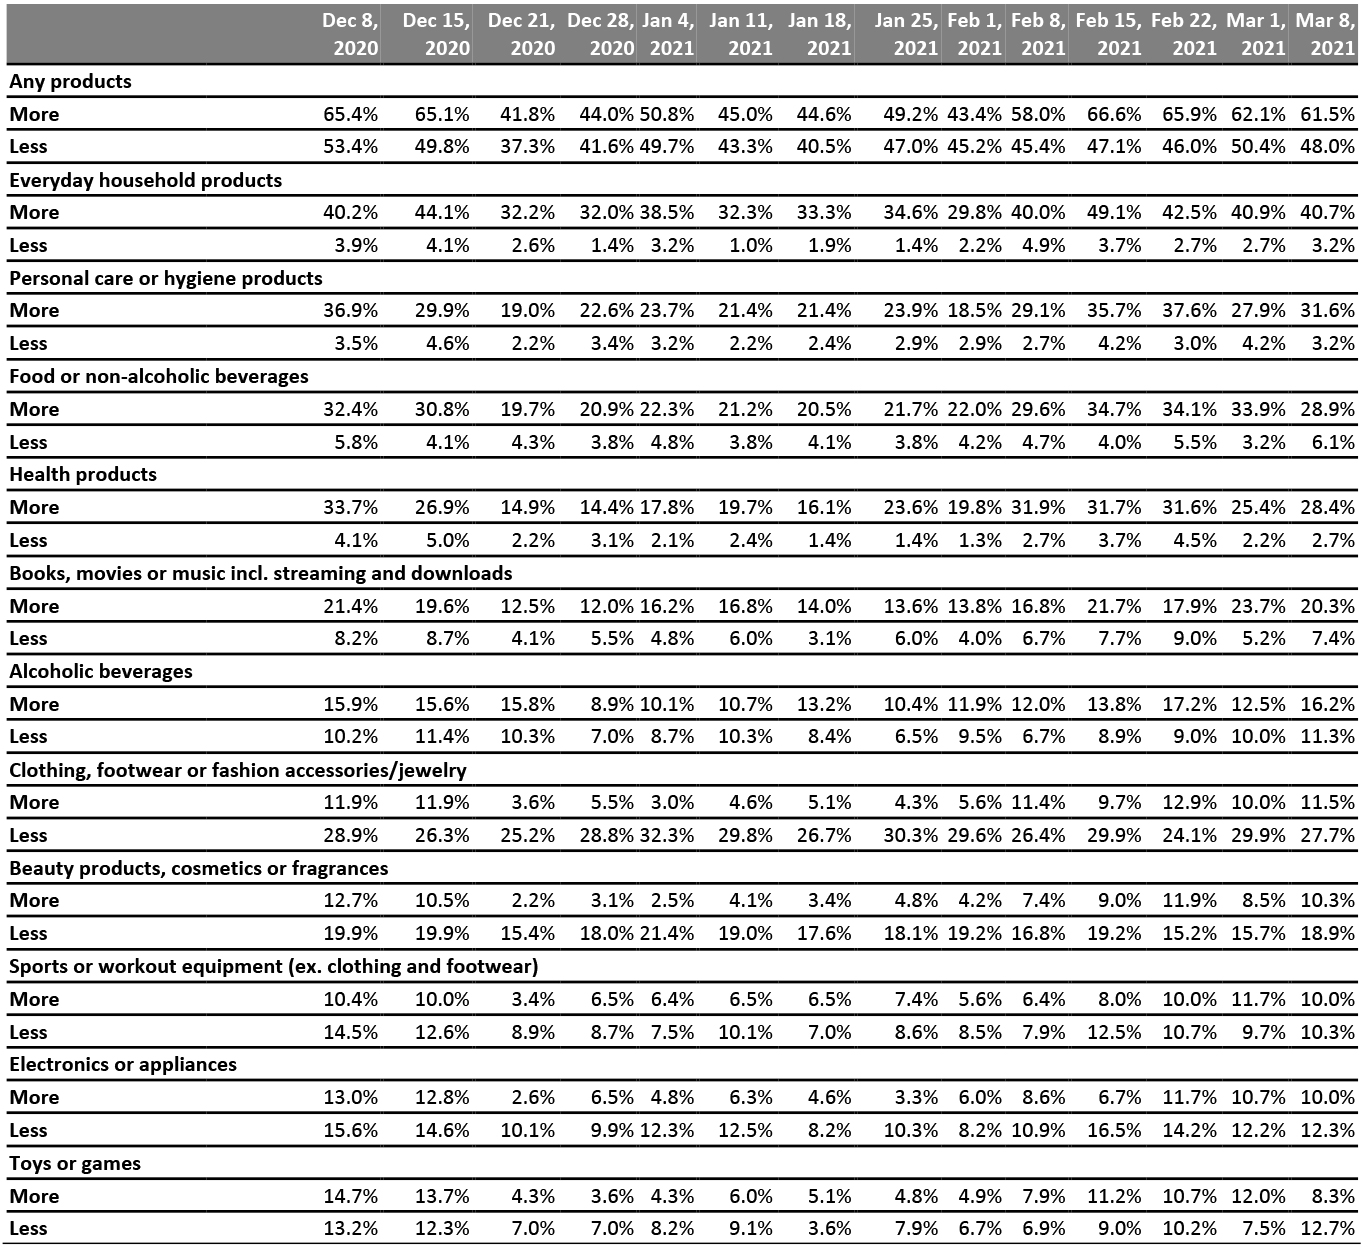 Base: US respondents aged 18+
 Source: Coresight Research [/caption]
What We Think
The distribution and effectiveness of vaccines in the US have likely helped to reduce Covid cases and raise consumer sentiment along with it. Consumers are likely to continue returning to social activities and places they were previously avoiding at high rates, including malls and shops, in the weeks and months to come. Many consumers, particularly those with higher incomes, have significant pent-up spending power that they may begin unleashing as their willingness to spend on meals out, fitness classes and vacations improves. While lower-income consumers have less pent-up savings and some remain unemployed, the third round of stimulus checks will likely give them additional spending power as well. Our recurring weekly questions indicated the following:- Avoidance of Public Places: The proportion of consumers avoiding public places dropped to 77.5% this week. Looking at trends over a longer term, over the past three months we have seen decreases in avoidance of every public place that we ask respondents about in our survey. Coupled with increased visits to restaurants and gyms/fitness classes, this seems to be indicating the start of what may finally be a sustained return to more normal consumer movement patterns.
- Apparel: Apparel remains the most common category that respondents reported purchasing less of. While the very short-term outlook for apparel purchasing, particularly in-store, remains bleak, consumers’ increasing comfort with going to malls and shops, along with their return to socializing, paints a brighter picture of the apparel market several months into the future.
- Grocery: Spending on groceries remains high, but recent slight decreases may indicate that consumers are finally beginning to deprioritize essentials spending—which has so far defined the pandemic retail landscape.