albert Chan
What’s the Story?
This report presents the results of Coresight Research’s latest weekly survey of US consumers, undertaken on January 11. The report includes analysis of new questions on shopper behaviors and the impacts of the coronavirus outbreak. We explore the trends we are seeing from week to week, following the prior survey on January 4, 2021 and previous surveys in 2020: December 28, December 21, December 15, December 8, December 1, November 24, November 17, November 10, November 3, October 27, October 20, October 13, October 6, September 29, September 22, September 15, September 9, September 2, August 26, August 19, August 12, August 5, July 29, July 22, July 15, July 8, July 1, June 24, June 17, June 10, June 3, May 27, May 20, May 13, May 6, April 29, April 22, April 15, April 8, April 1, March 25 and March 17–18.
What Shoppers Are Buying and Which Retailers They Are Buying From
For 2021, Coresight Research introduces new questions on what shoppers are buying and what retailers they are buying from. Week by week, we will track:
- What product categories they had purchased in-store in the past two weeks.
- What product categories they had purchased online in the past two weeks.
- Which retailers they had bought any food products from in the past two weeks.
- Which retailers they had bought any nonfood products from in the past two weeks.
What Consumers Bought In-Store and Online
Consumers generally reported buying less overall in the past two weeks, particularly in-store, likely because the survey period began after Christmas Day (whereas last week included the Christmas holidays). We saw week-over-week declines in in-store purchasing in 11 of the 17 categories we surveyed.
- The proportion of consumers shopping in-store for essential items such as groceries, household products and toiletries remained stable and relatively high: 74.5% of consumers reported shopping for food and beverages in-store in the past two weeks—the fourth straight week that this number has been over 74%. Online demand remained strong, too.
- Apparel, footwear and fashion accessories took the greatest post-holiday hit: The proportion of respondents buying in store fell 4.3 percentage points week over week, while the proportion buying online fell 3.8 percentage points. This reflects the still-low underlying demand for clothing and footwear, with recent stronger performances being driven by gifting for others rather than needs-driven personal purchases.
- Jewelry and watches saw a similar post-holiday slump, as did electronics.
Figure 1. All Respondents: What They Have Bought In-Store and Online in the Past Two Weeks (% of Respondents)
[caption id="attachment_121849" align="aligncenter" width="700"]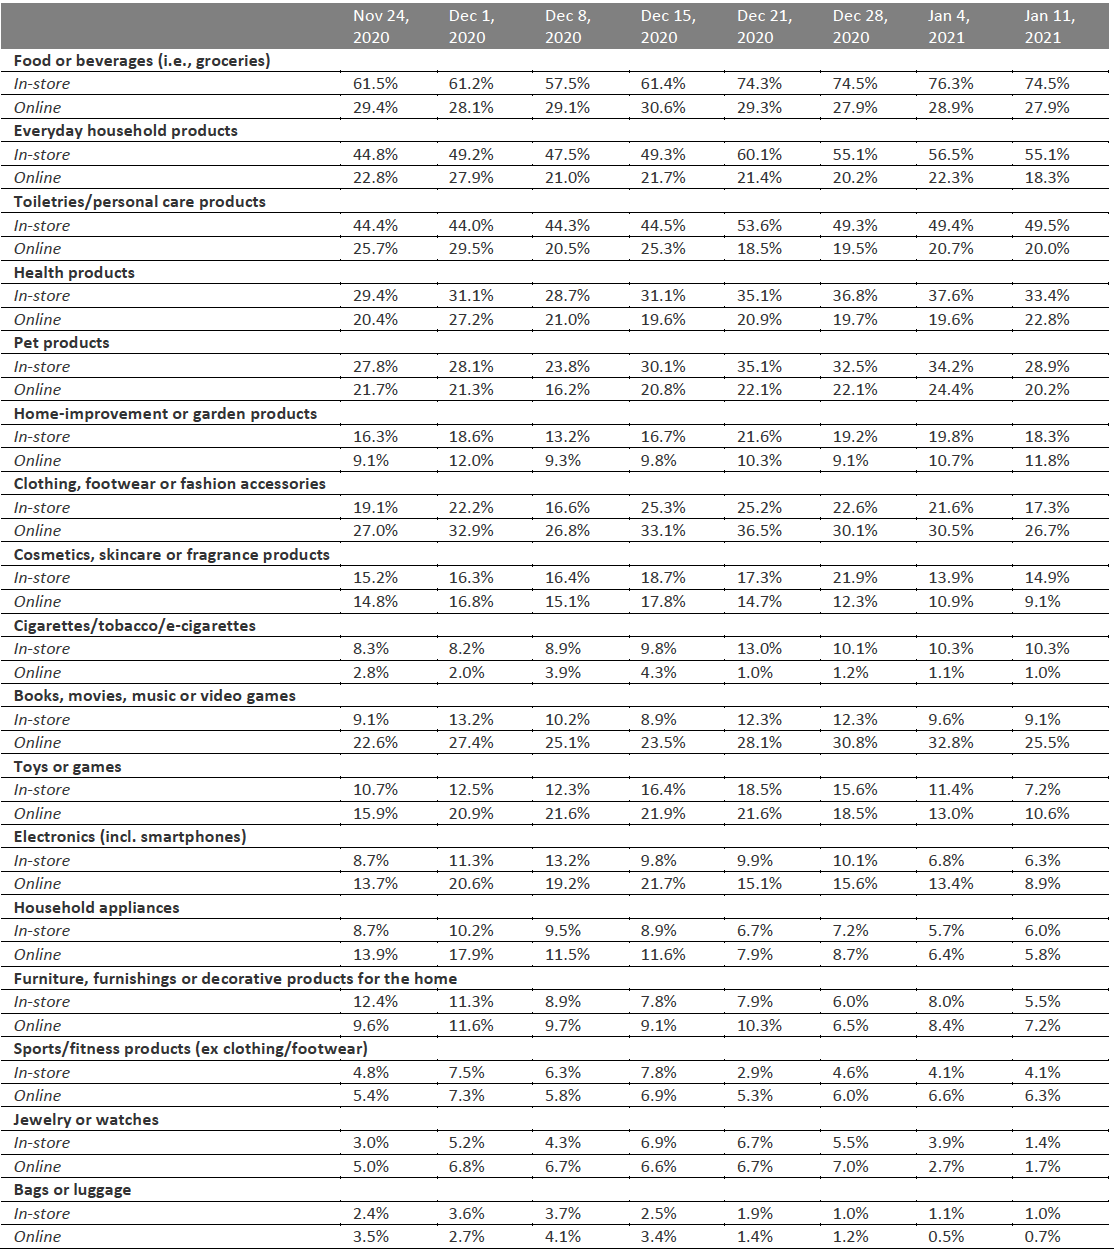 Respondents could select multiple options
Base: US respondents aged 18+
Source: Coresight Research[/caption]
Retailers: Where Consumers Shopped
Since December 21, we have asked consumers which retailers they bought from in the two-week period preceding the survey, for both food and nonfood products.
The main major shift in consumer shopping behavior across retailers this week was substantial declines in the proportions of consumers shopping for nonfood products at all surveyed retailers; as with purchases by category, above, this will have been driven by the holiday season falling outside of the latest two-week period. While the proportion of those shopping at food retailers also generally declined, all changes were within the margin of error.
For food purchases:
- Walmart retained a clear lead among retailers that consumers had bought food from, although slightly fewer consumers reported that they had shopped there than in our previous survey. Walmart’s closest rivals—Amazon, Kroger and Target—also saw declines in the percentage of respondents who reported shopping with them for food products.
- Of the 12 retailers we asked consumers about, nine saw fewer consumers report shopping with them in this week’s survey compared to last week.
For nonfood purchases:
- While Amazon, Target and Walmart unsurprisingly continued to see the most shoppers, the proportion of respondents who reported purchasing nonfood products from each dropped by over 10 percentage points this week—the largest decreases among all retailers—helping Dollar Tree/Family Dollar and Dollar General close the gap on these mass merchandisers.
- The proportion of respondents that shopped at Macy’s decreased for the second consecutive week, to less than half the proportion from two weeks ago, during the holiday season.
Figure 2. All Respondents: Which Retailers They Have Bought Food Products From (Left), and Which Retailers They Have Bought Nonfood Products From (Right) in the Past Two Weeks (% of Respondents)
[caption id="attachment_121850" align="aligncenter" width="700"]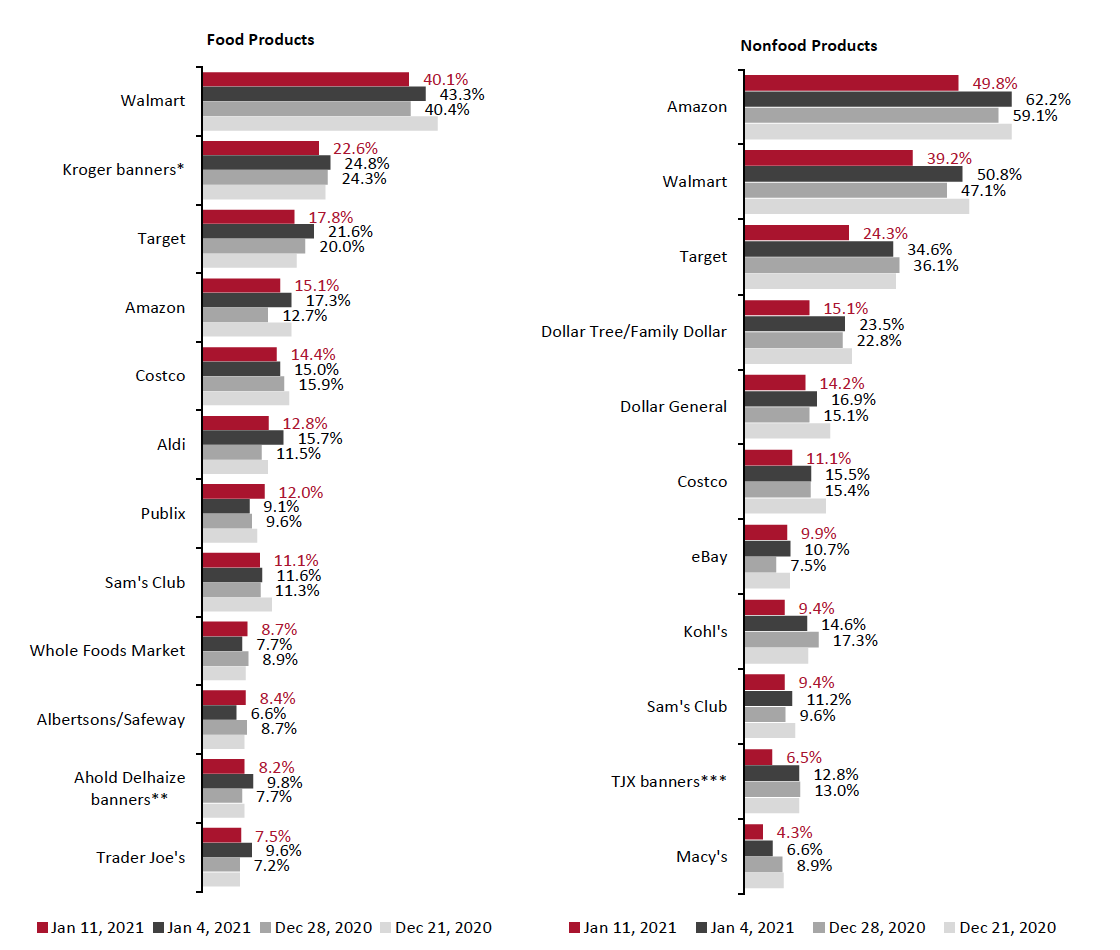 Respondents could select multiple options
Base: US Internet users aged 18+
*Kroger banners include City Market, Fred Meyer, Harris Teeter, King Soopers, Kroger, Ralphs and Smith’s Food & Drug
**Ahold Delhaize banners include Food Lion, Giant, Hannaford and Stop & Shop
***TJX banners include HomeGoods, HomeSense. Marshalls, Sierra and T.J. Maxx
Source: Coresight Research[/caption]
What Shoppers Are Doing and Where They Are Going
Consumers Continue To Avoid Bars and Shopping Centers
Complementing our questions about purchases in the past two weeks, each week, we ask consumers what activities they have done in the past two weeks. This week, the proportion of respondents slightly decreased for the majority of the options we provided for recent activities, although most of the week-over-week changes were within the margin of error.
- While the proportion of consumers who reported going to a restaurant remained relatively stable, the proportion who reported going to a bar dropped to the lowest number reported since December 15, 2020.
- The proportion of consumers that visited an open-air shopping center decreased for the third consecutive week to the lowest total we have seen for this activity since December 8, 2020—and down more than six percentage points since its peak on December 21, 2020.
Figure 3. All Respondents: What Activities They Have Done in the Past Two Weeks (% of Respondents)
[caption id="attachment_121851" align="aligncenter" width="700"]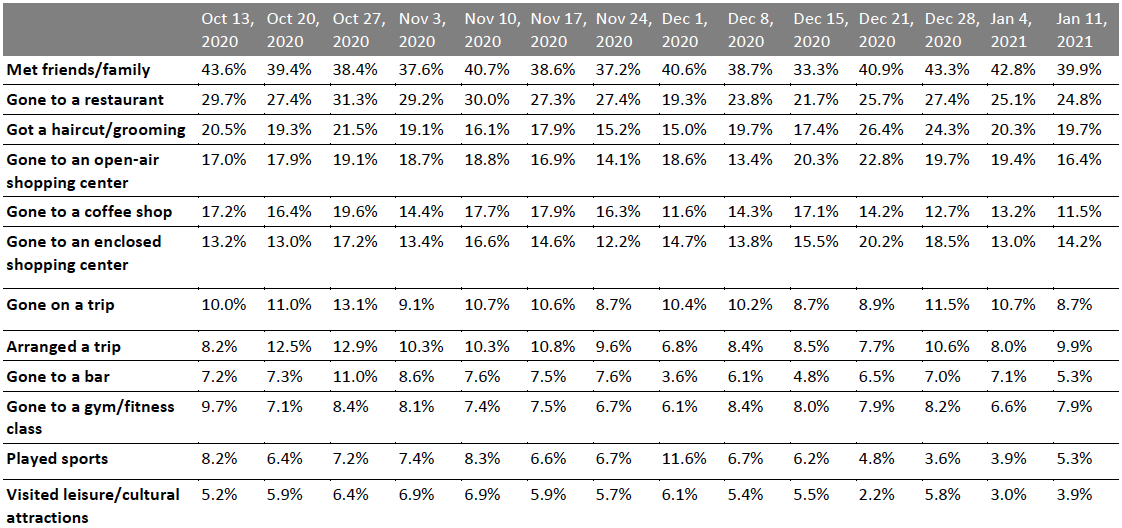 Respondents could select multiple options
Base: US respondents aged 18+
Source: Coresight Research[/caption]
Consumers Remain Wary of Shops and Food Services
Each week, we also ask consumers what activities they expect to do in the next two weeks, with a set of options comparable to those for the last two weeks. This week, consumer expectations remained relatively stable, with no category seeing changes in expectations of greater than four percentage points—within the margin of error.
For the next two weeks, we saw slight increases in consumers’ expectations to meet up with friends and family, go to a restaurant, go to a gym or fitness class, and play sports. There was a slight decrease in the number of consumers reporting they would get a haircut or other beauty service, bucking the upward trend we have seen in previous weeks.
Just 12.5% of consumers plan to visit an open-air shopping center in the next two weeks, while the proportion of respondents planning to go to an enclosed shopping center was 9.4%—both roughly flat from last week. As we discuss in the following section, avoidance rates for shopping centers and retail in general were down very slightly this week.
Figure 4. All Respondents: What Activities They Expect To Do in the Next Two Weeks (% of Respondents)
[caption id="attachment_121852" align="aligncenter" width="700"]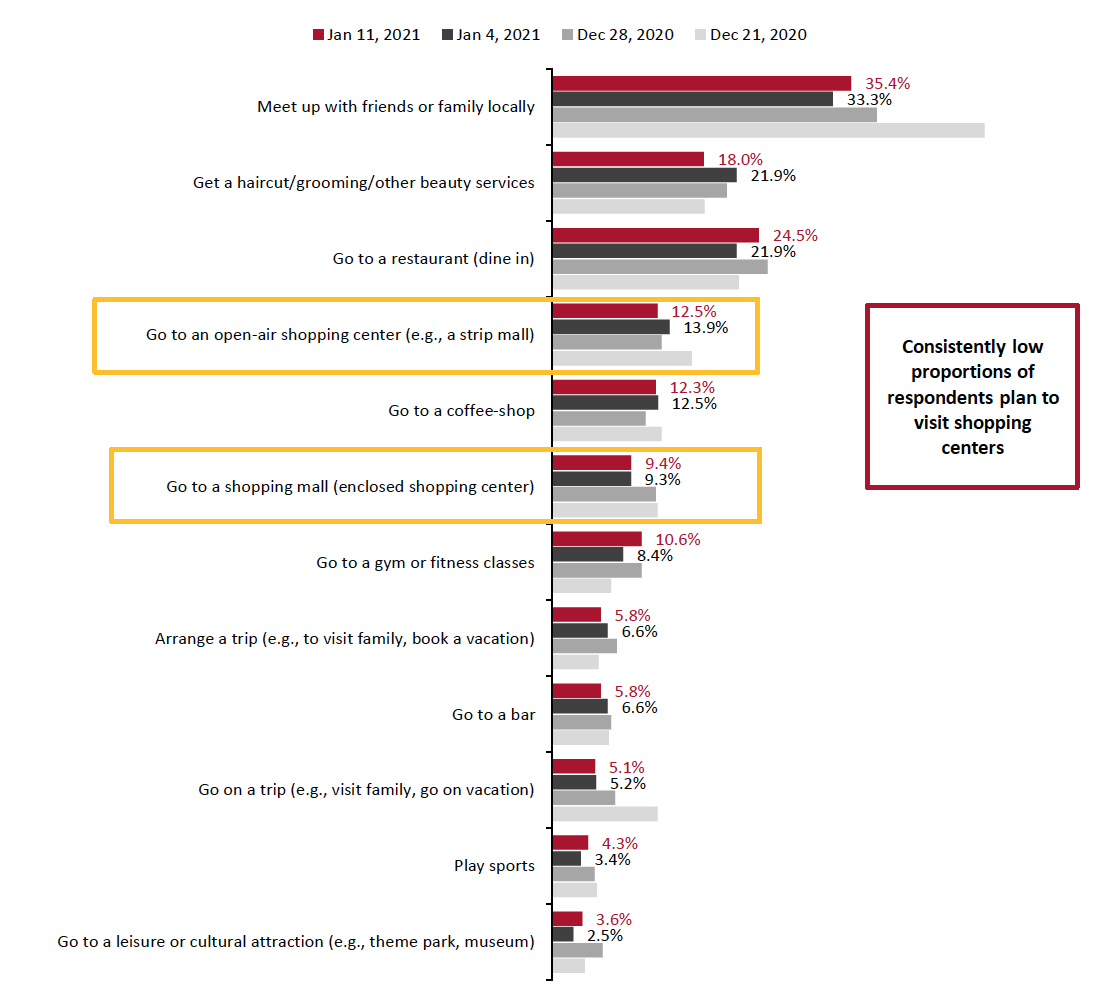 Respondents could select multiple options
Base: US respondents aged 18+
Source: Coresight Research[/caption]
Over Eight in 10 Are Currently Avoiding Public Places
In this week’s survey, the avoidance rate of any type of public area stood at 82.7% versus 84.1% in last week’s survey.
- Avoidance rates were down slightly week over week across many options, including shopping centers/malls and shops in general.
Figure 5. All Respondents: Public Places That Respondents Are Currently Avoiding (% of Respondents)
[caption id="attachment_121853" align="aligncenter" width="700"]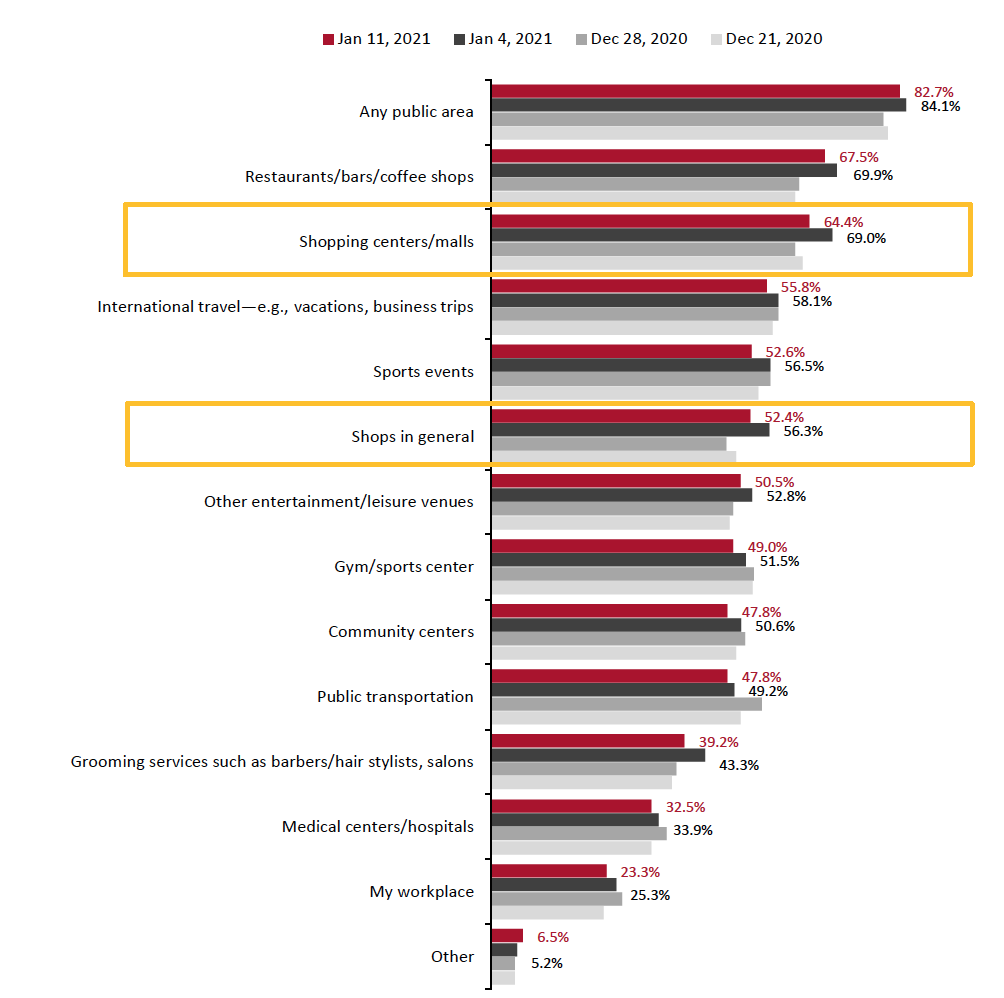 Respondents could select multiple options
Base: US respondents aged 18+
Source: Coresight Research[/caption]
Reviewing Trend Data in Current Purchasing Behavior
What Consumers Are Currently Buying More Of and Less Of
We continue to see almost equal proportions of consumers currently buying more of any type of product to those buying less of any type of product. Some 45.0% are buying more of any product than pre-crisis, while 43.3% are currently buying less of any product due to the pandemic. Both of those proportions are significantly down from last week, when 50.8% and 49.7% of consumers reported buying more and less of any product, respectively.
- Buying more in any category and buying less in any category were not mutually exclusive options, so respondents could answer yes to both.
Buying more: Consumers continue to focus on essentials. This week, 33.2% reported buying more household products than pre-pandemic. About one in five consumers also indicated that they are spending more on personal care and health products.
Buying less: Consistent with previous surveys, clothing and footwear remained the most-cut category due to the pandemic, with 29.8% of respondents buying less in the category, followed by beauty (19.0%). Double-digit percentages of consumers also continued to spend less on electronics and appliances, as well as home furnishings.
Ratio of less to more: The ratios of the proportion of respondents buying less to the proportion buying more in apparel and beauty dropped substantially this week after setting record highs last week.
- The ratio for clothing and footwear dropped to 6.5 from 10.9 last week. During the early days of the holiday season, this ratio was around 2.0.
- The ratio for beauty came in at 4.6, versus 8.5 last week.
- The ratio for electronics dropped to 2.0, from 2.6 last week.
- The ratio for the home category bounced back to 3.4, up from 2.1 last week.
Figure 6. All Respondents: What They Are Currently Buying More/Less Of Due to the Coronavirus Outbreak (% of Respondents)
[caption id="attachment_121854" align="aligncenter" width="700"]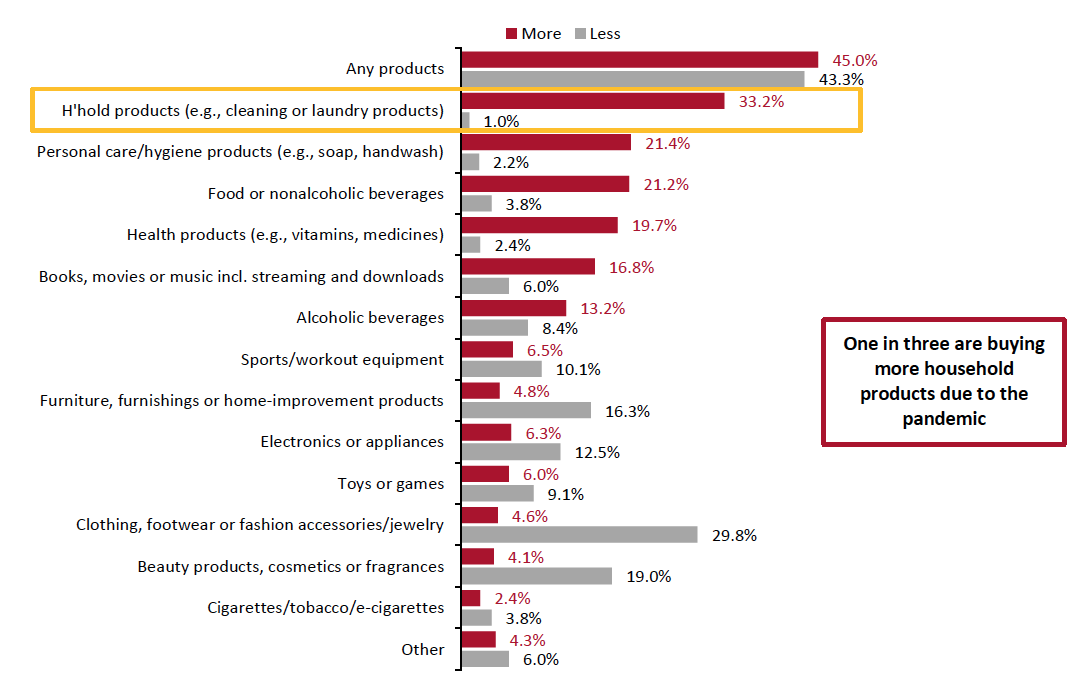 Respondents could select multiple options
Base: US respondents aged 18+
Source: Coresight Research[/caption]
Figure 7. All Respondents: Buying More/Less of Selected Categories (% of Respondents)
[caption id="attachment_121855" align="aligncenter" width="700"]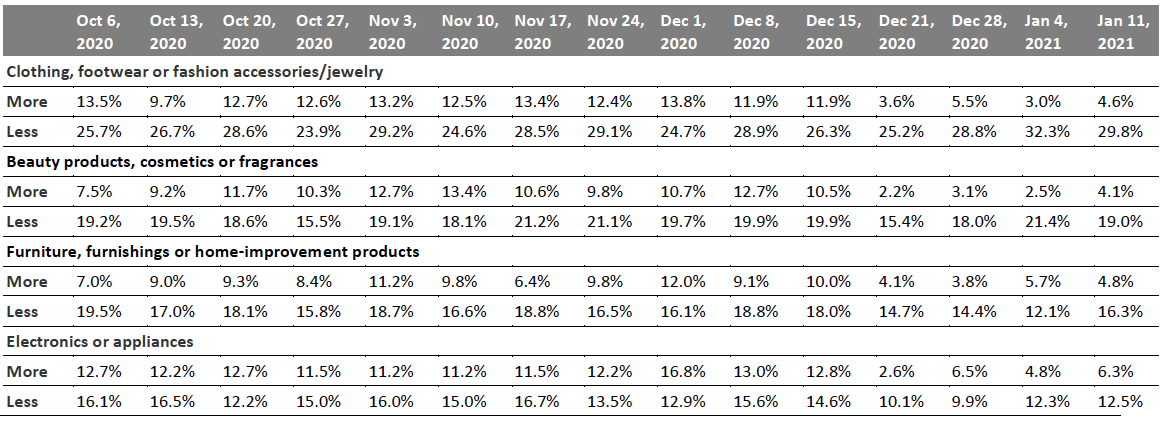 Base: US respondents aged 18+
Source: Coresight Research[/caption]
Fewer than Seven in 10 Are Switching Spending Online
The proportion of consumers buying more online than they used to dropped to 63.9% this week—the second lowest value we have recorded since the start of October—after rebounding to 72.4% last week.
Figure 8. All Respondents: Whether They Are Currently Buying More Online than They Used To (% of Respondents)
[caption id="attachment_121856" align="aligncenter" width="700"]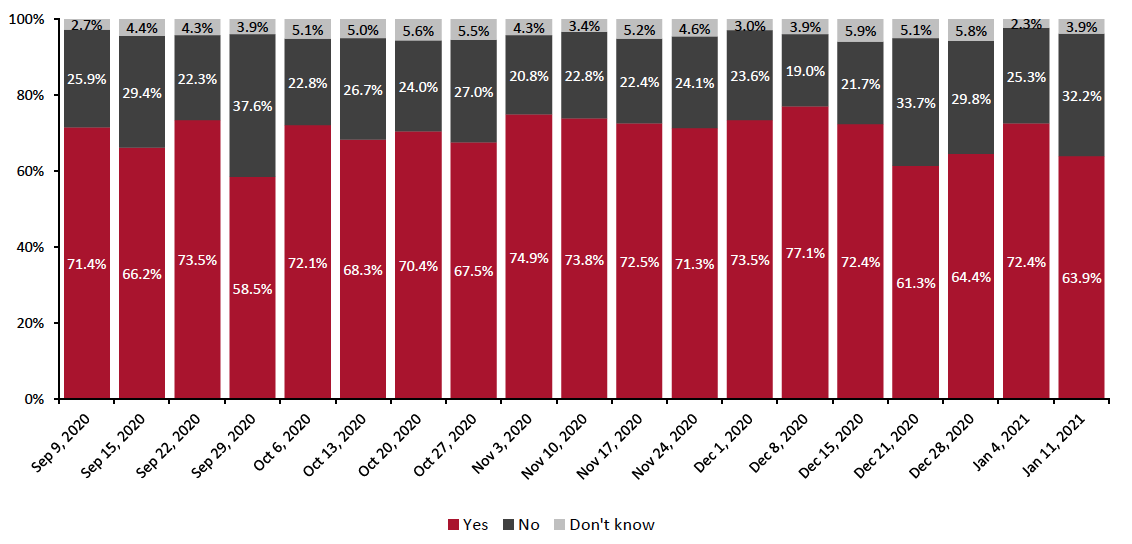 Base: US respondents aged 18+
Source: Coresight Research[/caption]
What Consumers Are Currently Buying More Of Online
Looking at specific categories, 10 of the 13 options we provided saw week-over-week decreases in consumers buying more online than pre-crisis, although this is likely due to consumers reducing all spending in the wake of the holiday season. Furthermore, all but one of these changes were within the margin of error.
- The proportion of consumers buying more sports/workout equipment online increased for the third consecutive week, potentially indicative of consumers who are wary of going to gyms still aiming to make good on New Year’s resolutions.
- The proportion of consumers buying more groceries online also increased for the third straight week, somewhat surprisingly considering that we are now past the holiday period. The continued upward trend may be explained by consumers’ concerns over rising virus cases.
- While clothing, books and electronics saw the three largest changes this week, all of these declines can likely be explained by consumers buying less of these often-gifted products now the holiday season is over.
Figure 9. All Respondents: Categories That They Are Currently Purchasing Online More than They Used To (% of Respondents)
[caption id="attachment_121857" align="aligncenter" width="700"]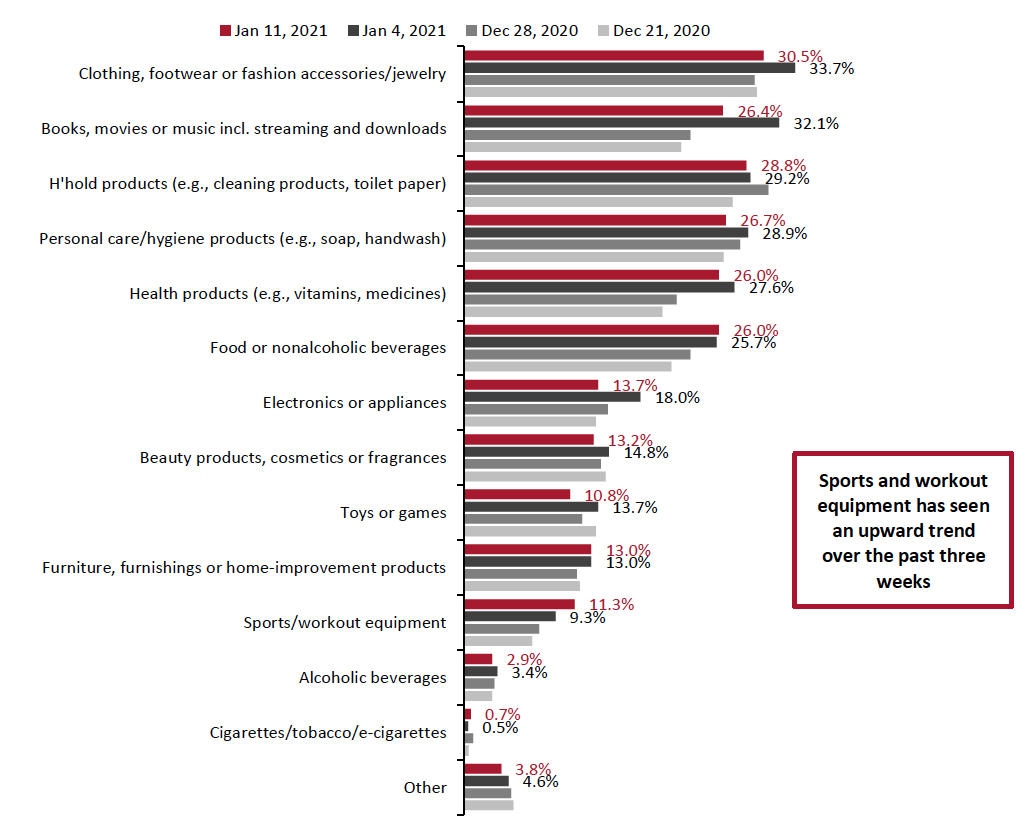 Respondents could select multiple options
Base: US respondents aged 18+
Source: Coresight Research[/caption]
What We Think
This week, we saw the following from our recurring weekly questions:
- Apparel: Somewhat unsurprisingly, the apparel category struggled following the holiday season. Kohl’s, Macy’s and TJX banners all saw declines in the proportion of respondents shopping there—for the second consecutive week. However, in a positive sign for the industry, the ratio of buying less to more than pre-crisis for apparel decreased this week.
- Online Grocery: Some 27.9% had bought food online in the past two weeks, roughly level with the proportion recorded in prior weeks, further confirming the sustained demand for grocery e-commerce.
- E-Commerce: Consumers continue to switch spending online at high rates, but the growth of online shopping may have plateaued. The proportion of consumers reporting spending more on any products online than they did prior to the pandemic dipped by more than eight percentage points this week—although some of this may be due to changed shopping habits following the end of the holiday season.
Methodology
We surveyed respondents online on January 11 (416 respondents), January 4 (439 respondents), December 28 (416 respondents), December 21 (416 respondents), December 15 (438 respondents), December 8 (463 respondents), December 1 (441 respondents), November 24 (460 respondents), November 17 (425 respondents), November 10 (447 respondents), November 3 (418 respondents), October 27 (419 respondents), October 20 (409 respondents), October 13 (401 respondents), October 6 (416 respondents), September 29 (412 respondents), September 22 (422 respondents), September 15 (408 respondents), September 9 (406 respondents), September 2 (402 respondents), August 26 (414 respondents), August 19 (416 respondents), August 12 (400 respondents), August 5 (449 respondents), July 29 (403 respondents), July 22 (404 respondents), July 15 (454 respondents), July 8 (410 respondents), July 1 (444 respondents), June 24 (411 respondents), June 17 (432 respondents), June 10 (423 respondents), June 3 (464 respondents), May 27 (422 respondents), May 20 (439 respondents), May 13 (431 respondents), May 6 (446 respondents), April 29 (479 respondents), April 22 (418 respondents), April 15 (410 respondents), April 8 (450 respondents), April 1 (477 respondents), March 25 (495 respondents) and March 17–18 (1,152 respondents). The most recent results have a margin of error of +/- 5%, with a 95% confidence interval. Not all charted week-over-week differences may be statistically significant.