DIpil Das
What’s the Story?
Why It Matters
Back-to-school presents significant retail opportunity among America’s 56.4 million-strong student population and as this cohort heads back to school in-person in fall 2021, we can expect a rebound in class-related spending this season. Back-to-school is not only a multibillion-dollar opportunity for a range of US retail sectors, from apparel to electronics; it also provides an early temperature check on consumer willingness to spend as we head into the second half and, so, toward the holiday peak.Back-to-School Outlook
Double-Digit Percentage Increase in Spending Coresight Research estimates that the widespread return to in-person classes will drive a year-over-year increase of 14.5% in US back-to-school spending this year, taking retail spend to an estimated $28.5 billion versus $24.9 billion last year, and surpassing precrisis 2019 levels by around 8.7%. Weak comparatives from 2020—which saw a drop of 5.2% from 2019—coupled with recent strength in nonfood and discretionary spending trends will fuel this notable increase. We expect clothing, accessories and footwear to drive the resurgence, with a 19.2% year-over-year increase taking category sales to around $14.8 billion, we estimate. This will put category spending 5.0% higher than in 2019. We expect a circa-22.0% year-over-year increase in spending on supplies such as stationery and backpacks to propel category sales to $4.3 billion. Recent strong trends in nonfood retail spending including in clothing and footwear (which tracked 11% above 2019 levels in May 2021), supported by stimulus payments and raised inflation (see later), will provide underlying supports to consumer spend this back-to-school season. Against demanding comparatives from 2020’s studying-from-home context but amid still-very-strong demand for big-ticket purchases, we expect spending on computing products to be up by a mid-single-digit percentage year over year, equating to back-to-school electronics spending of around $9.4 billion. This is fully 21.8% above 2019 levels, reflecting buoyant spending patterns across big-ticket retail compared to precrisis levels. Economic Backdrop Stimulus issued by the US government and the decline in unemployment has bolstered consumer savings, leading to a higher rate of personal consumption. Unemployment rates plummeted by 7.6 percentage points year over year in May 2021, but remain 2.3 percentage points higher than pre-covid January 2020. US shoppers have been spending freely, taking total retail sales to 20% above their 2019 levels in May 2021 (latest). These factors suggest a positive outlook for back-to-school sales this season. Figure 1 presents the government stimulus programs issued in 2020 and 2021 in response to the coronavirus pandemic—as shown in the final row, stimulus measures including direct payments, unemployment benefits and tax credits equate to almost $13,000 per household.Figure 1. Amount of Government Stimulus Received Directly by Consumers (2020-2021) [wpdatatable id=1102 table_view=regular]
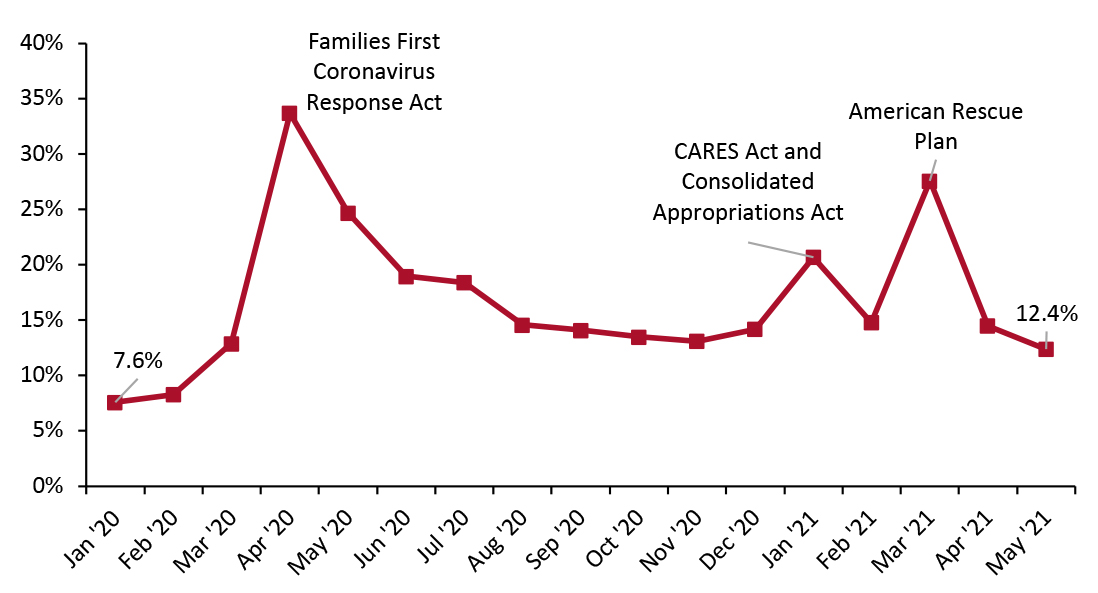
Source: Coresight Research Although consumer savings declined by 49.7% year over year in 2021, the current saving rate is higher than the pre-pandemic level, as shown in Figure 2.
Figure 2. US Personal Saving Rate (%) [caption id="attachment_129758" align="aligncenter" width="726"]
 Source: Federal Reserve Bank of St. Louis[/caption]
Potential Limitations on Back-to-School Spending
Price inflation amid the government’s expansionary monetary policy, along with supply-chain bottlenecks, have the potential to put a damper on spending prospects as students head back to school—although we expect the abovementioned tailwinds to outweigh these negatives.
- Rising CPI rates: Minimal income gains may be partly due to skyrocketing CPI rates, which have risen 4.9% year over year, as of May 2021.
- Gas prices: As of by June 2021, prices are up 91.7% year over year.
- Home prices: Also seeing an increase, the S&P/Case-Shiller US National Home Price Index is up 14.6% year over year, as of April 2021.
- Disposable income: Likely a result of inflated prices, disposable income among consumers has declined by 2.3% year over year, as of May 2021.