DIpil Das
What’s the Story?
Physical and digital retail sales and traffic were significantly impacted by the Covid-19 pandemic last year—due to store closures, for example—and have not recovered to pre-pandemic levels. As part of Coresight Research’s US Back to School 2021 series, we present our expectations for online and offline shopping this back-to-school (BTS) season.Why It Matters
The back-to-school sales period, spanning June to September, is the second-biggest consumer spending season after the winter holidays: It presents a significant retail opportunity for the 56.4 million-strong US student population, as recorded by the National Center for Education Statistics. We expect a year-over-year increase of 14.5% in BTS spending this year, to an estimated $28.5 billion versus $24.9 billion last year.BTS Online and In-Store Sales and Traffic Trends: In Detail
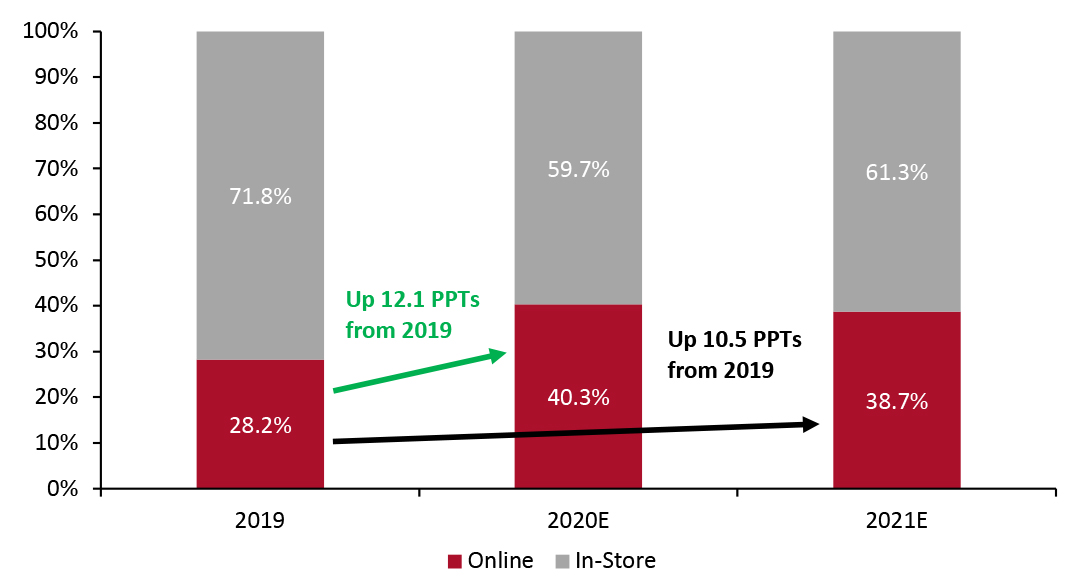
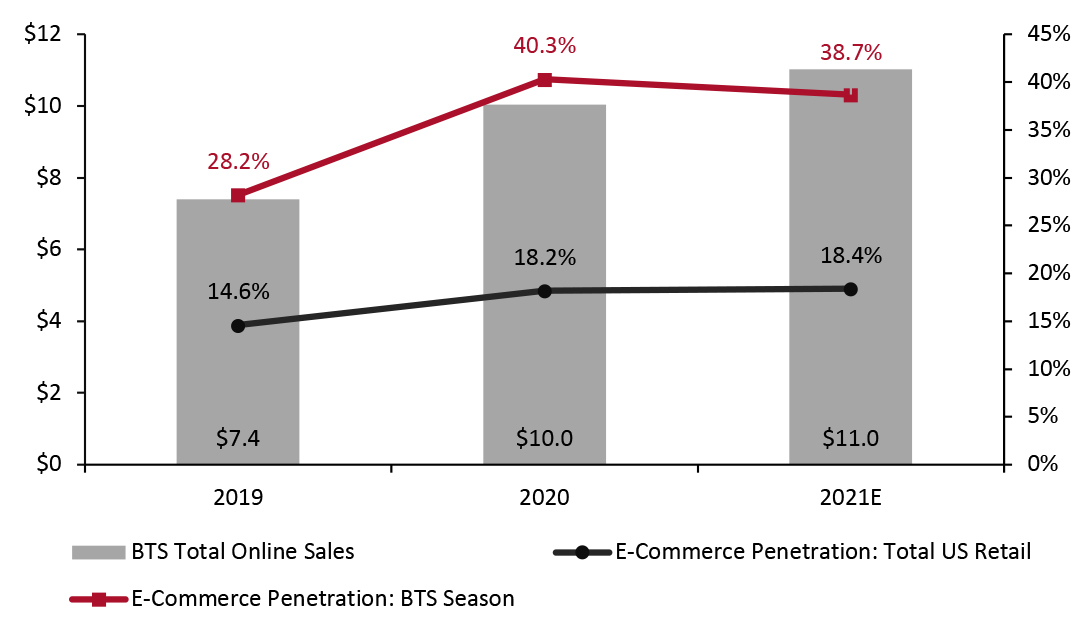
Online-Offline Spending Split Following the pandemic-led shift to online shopping in 2020, high e-commerce penetration is set to continue through the BTS 2021 season. In 2019, e-commerce accounted for less than one-third of all BTS sales, but its share jumped 12.1 percentage points in the 2020 season, we estimate. This year, we expect the digital channel to maintain a higher share of BTS sales than pre-pandemic, at 38.7%—albeit moderating a little from last year’s 40.3% share. We expect a high, 50+% online penetration rate in consumer electronics and still-raised e-commerce penetration of over one-third in apparel to be major contributors to this elevated channel share. However, in absolute terms, we expect online sales to rise year over year. In a total BTS retail market that we estimate will be worth $28.5 billion this year, we expect some $11 billion of sales to be online, up by around 10% from last year’s $10 billion. Amid surging cases of Covid-19, we are seeing something of a gradual retreat of consumers from public places including shops (see our recent US Consumer Tracker report for details), so we note that there remains scope for the channel mix to fluctuate during the remainder of the BTS season.Figure 1. Online vs. In-Store BTS Sales (% of Total BTS Sales) [caption id="attachment_131368" align="aligncenter" width="725"]
 Source: Coresight Research[/caption]
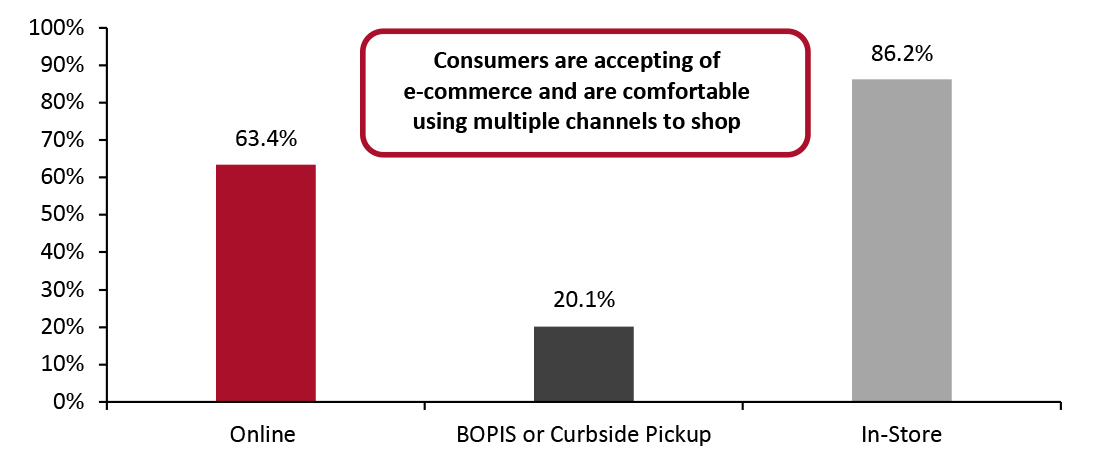
However, increased consumer acceptance of e-commerce does not necessarily mean the diminished importance of in-store shopping. A survey conducted by Coresight Research in July 2021 found that 86.2% of US consumers who expect to spend on BTS products this year reported that they expect to shop in-store to purchase such goods, while 63.4% of BTS shoppers expect to shop online (see Figure 2).
These findings suggest that in addition to being accepting of e-commerce, consumers are also comfortable using multiple channels to shop: In fact, 20.1% of BTS shoppers expect to use BOPIS (buy online, pick up in store) or curbside-pickup services, leveraging both digital and physical channels. Such services, which became popularized amid the pandemic, are helping to reshape the physical shopping experience by providing a convenient, low-contact shopping experience. Amid the abovementioned retreat by some consumers from public places in recent weeks, we could see usage of collection services increase beyond the levels anticipated by respondents.
Figure 2. BTS Shoppers: Proportions That Expect To Shop Online, In-Store and/or Using BOPIS or Curbside Pickup (% of Respondents) [caption id="attachment_131369" align="aligncenter" width="726"]
 Options were not mutually exclusive
 Base: 352 US respondents aged 18+ who expect to buy BTS products in the 2021 season
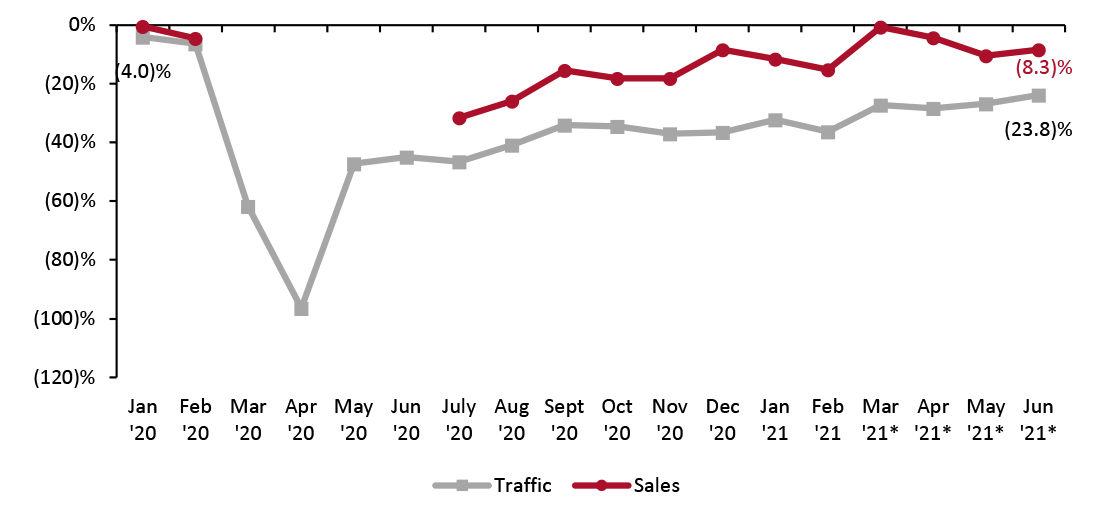
Source: Coresight Research [/caption] BTS In-Store Shopping: Moderating Traffic Declines Amid Loosening Store Restrictions and Shopping Innovations Despite a high percentage of BTS shoppers planning to spend in-store this season, store traffic will likely remain below pre-pandemic levels. Physical store traffic has not fully recovered since the sharp dip in March and April 2020, when nonessential stores closed, although we have seen steady improvement in traffic growth trends since. The latest available data show that June 2021 saw (23.8)% growth compared to two years prior (versus pre-pandemic June 2019), as shown in Figure 3. A straight-line trend implies the BTS season would continue to see this moderation in traffic declines through June–September 2021, but the situation remains dynamic due to the spread of the Covid-19 Delta variant.
Figure 3. US Store-Based Nonfood Retail Sales and Traffic (YoY/Yo2Y % Change) [caption id="attachment_131370" align="aligncenter" width="726"]
 Sales data was not reported from April to June 2020
 *March, April, May and June 2021 numbers are compared to that in 2019
Source: RetailNext [/caption] BTS E-Commerce: Online Sales To Follow Positive Overall US E-Commerce Trends We expect online BTS sales to follow the general growth trend of the overall US e-commerce market. This year, total US online retail sales will see 11.0% year-over-year growth, Coresight Research estimates; we expect online BTS sales to grow by a similar 10.0% year over year, to $11.0 billion. The BTS season has a much higher e-commerce penetration rate than total e-commerce, due to its strong focus on nonfood goods in which e-commerce accounts for a high proportion of sales overall (including electronics and apparel, as noted earlier).
Figure 4. BTS Online Sales (USD Bil.; Left Axis) and E-Commerce Penetration, Overall US Retail and for the BTS Season (% of Total Sales; Right Axis) [caption id="attachment_131371" align="aligncenter" width="724"]
 Source: US Census Bureau/Coresight Research[/caption]