albert Chan
US Back-to-School 2019: Retail Outlook
We begin our coverage of the US back-to-school season for retail with a forecast for consumer spending and dive deeper into shopping categories and channels. This season sees a relatively strong macro environment thought recent retail sales data show a slowing trend.
Slower Growth Expected with a 2.0–2.5% Increase in Spending Forecast
We expect to see a 2.0-2.5% year-over-year increase in back-to-school retail sales benchmark this year. Coresight Research estimates reflect total sales by nonfood retailers from July to September. Our 2019 estimate represents a meaningful slowdown from last year, when nonfood retailer sales grew 4.4% in the July-to-September period.
Back-to-school spending spans a wide range of nonfood categories, including apparel, electronics and stationery. Reflecting this breadth, our estimate reflects all retail sales by nonfood retailers as defined by the US Census Bureau, and excluding automobile retailers and gas stations.
The multiyear trend charted below puts 2019’s estimated 2.0-2.5% growth in context.
[caption id="attachment_93703" align="aligncenter" width="700"]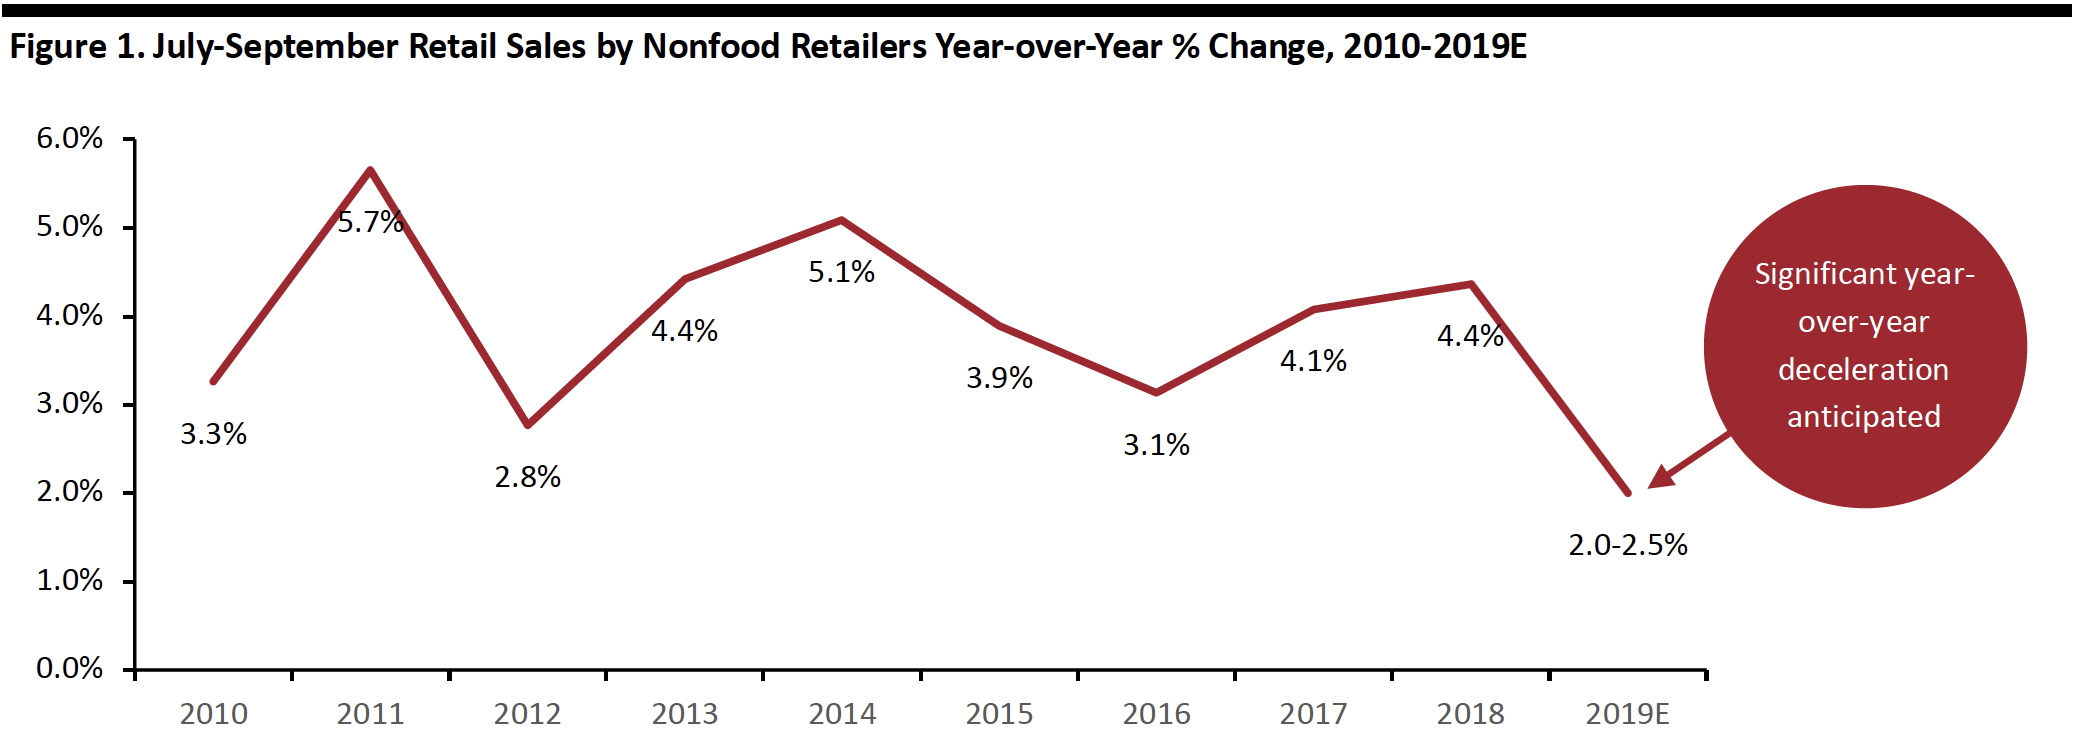 Source: US Census Bureau/Coresight Research[/caption]
A mixed economic backdrop frames this year’s back-to-school shopping season. Higher wage growth and lower gas prices point to the potential for higher sales. However, nonfood retailer sales have risen just 3.2% year to date (through June), a significant slowdown from the 5.1% growth in the first six month of 2018.
Total retail sales growth has slowed this year, too: In June 2019 (latest), total retail sales grew by a modest 2.1% year over year. In June 2018, sales were growing at double that pace.
Our estimates are informed by June survey data from Prosper Insights & Analytics, which finds that only 17.1% of back-to-school shoppers expect to spend more this year than last, while some 60% say they will spend the same amount. Last year we saw a net 22.8% of back-to-school consumers expecting to spend more, which is higher than this year’s number, indicating a slowdown in spending growth for 2019.
[caption id="attachment_93704" align="aligncenter" width="700"]
Source: US Census Bureau/Coresight Research[/caption]
A mixed economic backdrop frames this year’s back-to-school shopping season. Higher wage growth and lower gas prices point to the potential for higher sales. However, nonfood retailer sales have risen just 3.2% year to date (through June), a significant slowdown from the 5.1% growth in the first six month of 2018.
Total retail sales growth has slowed this year, too: In June 2019 (latest), total retail sales grew by a modest 2.1% year over year. In June 2018, sales were growing at double that pace.
Our estimates are informed by June survey data from Prosper Insights & Analytics, which finds that only 17.1% of back-to-school shoppers expect to spend more this year than last, while some 60% say they will spend the same amount. Last year we saw a net 22.8% of back-to-school consumers expecting to spend more, which is higher than this year’s number, indicating a slowdown in spending growth for 2019.
[caption id="attachment_93704" align="aligncenter" width="700"]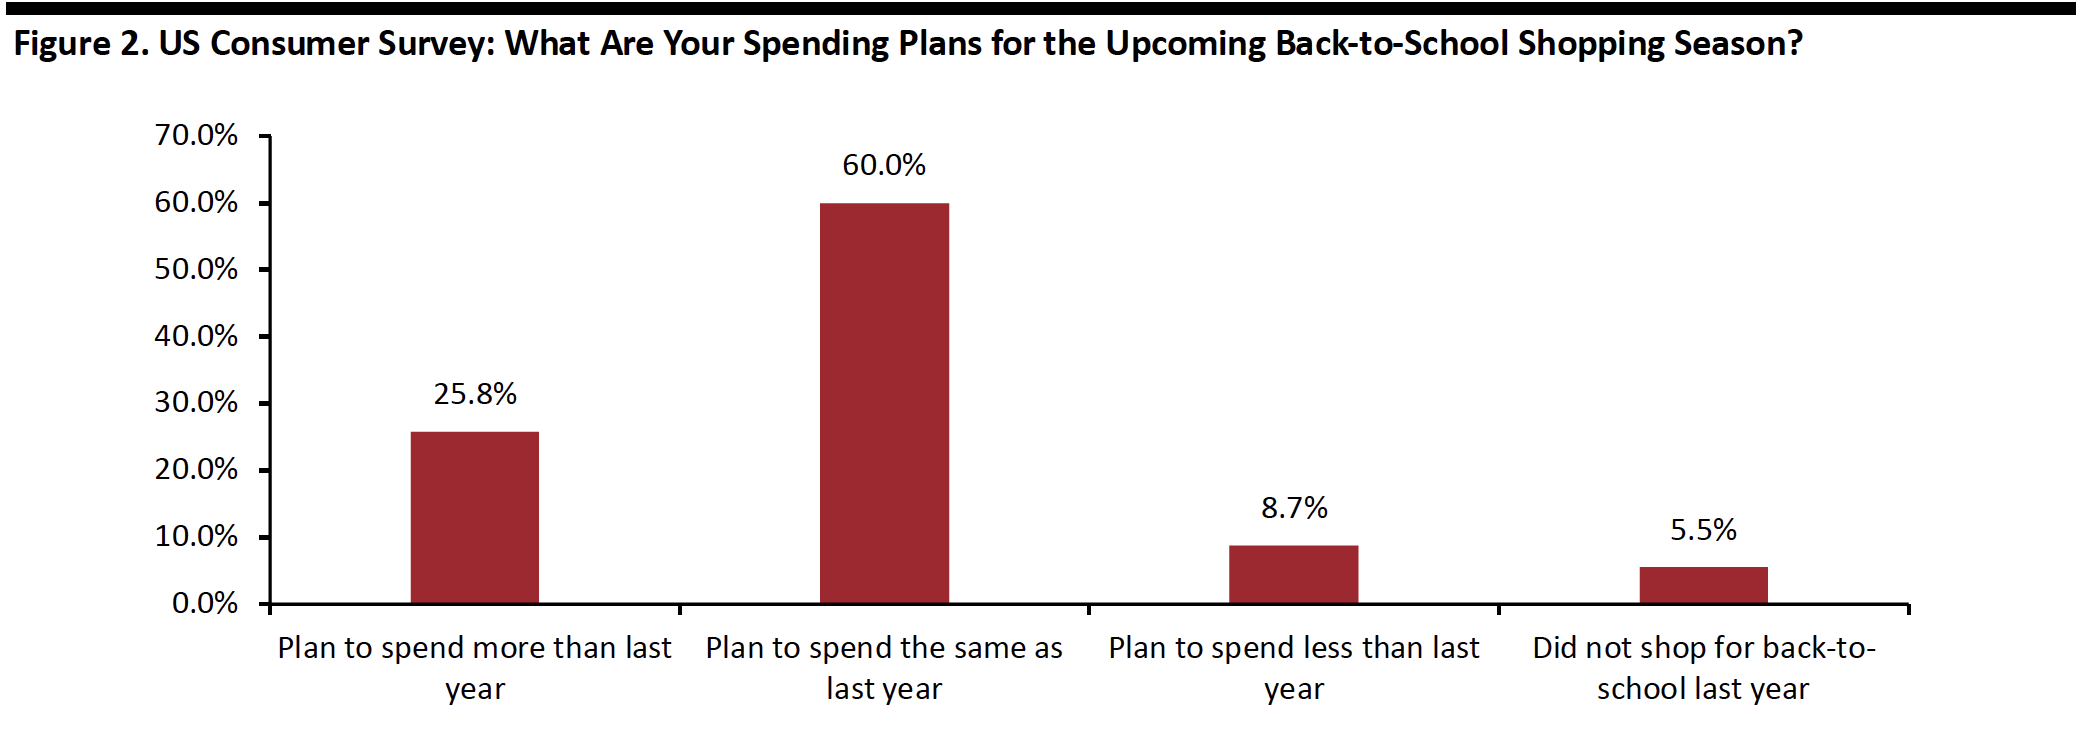 Base: 7,553 US adults aged 18+
Source: Prosper Insights & Analytics[/caption] Positive economic indicators for this back-to-school season include: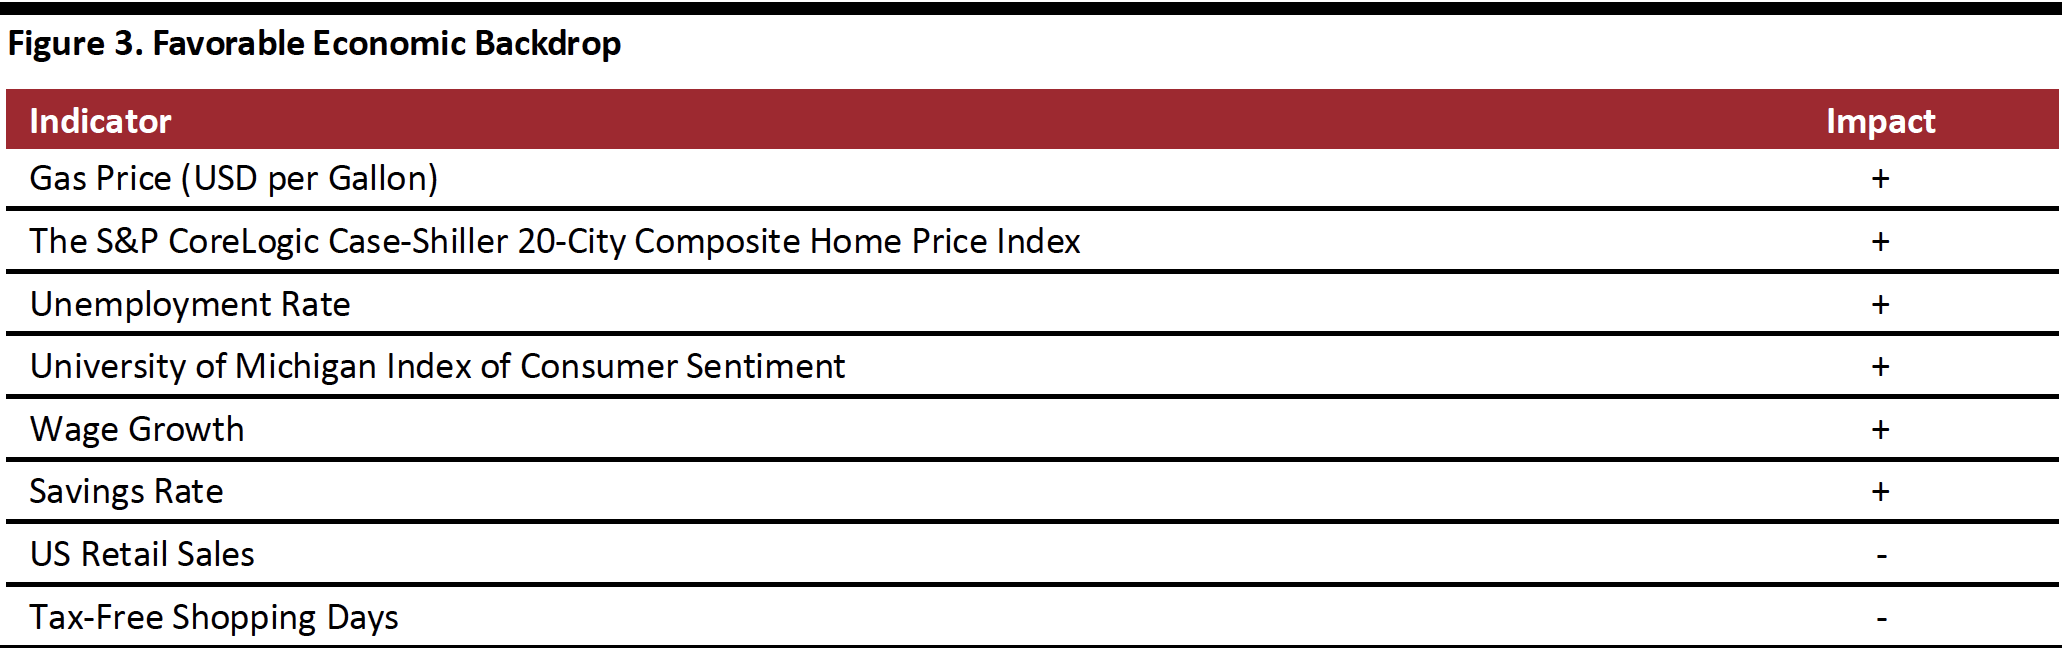 Source: US Bureau of Economic Analysis/US Department of Labor Statistics/S&P Global/University of Michigan/Federation of Tax Administrators/Coresight Research[/caption]
The number of state sales tax holidays is 52 days, three days fewer than last year, due to Wisconsin’s absence, offsetting the two days added by Florida.
[caption id="attachment_93706" align="aligncenter" width="700"]
Source: US Bureau of Economic Analysis/US Department of Labor Statistics/S&P Global/University of Michigan/Federation of Tax Administrators/Coresight Research[/caption]
The number of state sales tax holidays is 52 days, three days fewer than last year, due to Wisconsin’s absence, offsetting the two days added by Florida.
[caption id="attachment_93706" align="aligncenter" width="700"]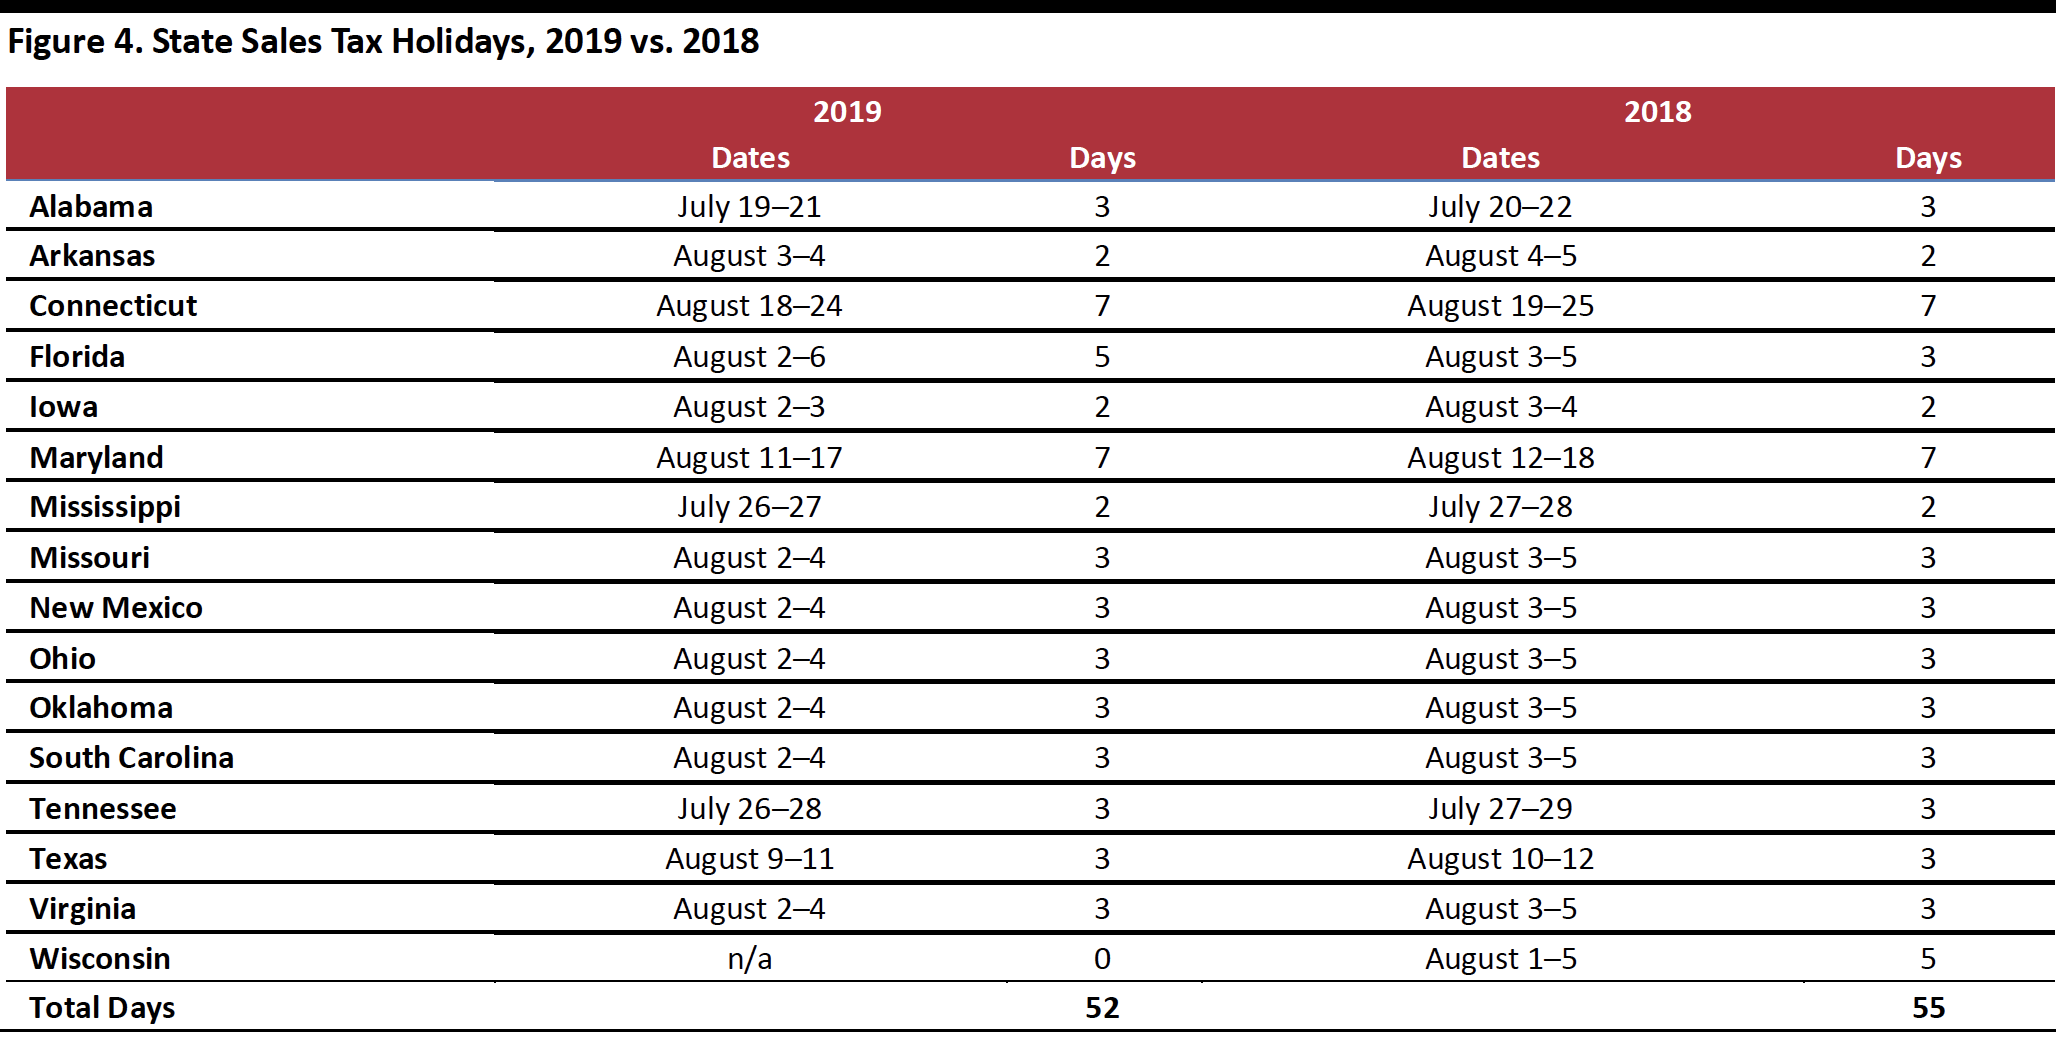 Source: Federation of Tax Administrators[/caption]
The NRF Expects a Slight Dip to $80.7 Billion
The NRF takes a more pessimistic view of this back-to-school season than we do, based on fewer people shopping. According to its annual back-to-school and back-to-college survey, conducted by Prosper Insights & Analytics, back-to-school spending will decline for a second year, to $26.2 billion, and back-to-college spending will retreat from its peak to $54.5 billion. Total back-to-school and back-to-college spending is expected to reach $80.7 billion, falling short of last year’s $82.8 billion by 2.5%.
[caption id="attachment_93707" align="aligncenter" width="700"]
Source: Federation of Tax Administrators[/caption]
The NRF Expects a Slight Dip to $80.7 Billion
The NRF takes a more pessimistic view of this back-to-school season than we do, based on fewer people shopping. According to its annual back-to-school and back-to-college survey, conducted by Prosper Insights & Analytics, back-to-school spending will decline for a second year, to $26.2 billion, and back-to-college spending will retreat from its peak to $54.5 billion. Total back-to-school and back-to-college spending is expected to reach $80.7 billion, falling short of last year’s $82.8 billion by 2.5%.
[caption id="attachment_93707" align="aligncenter" width="700"]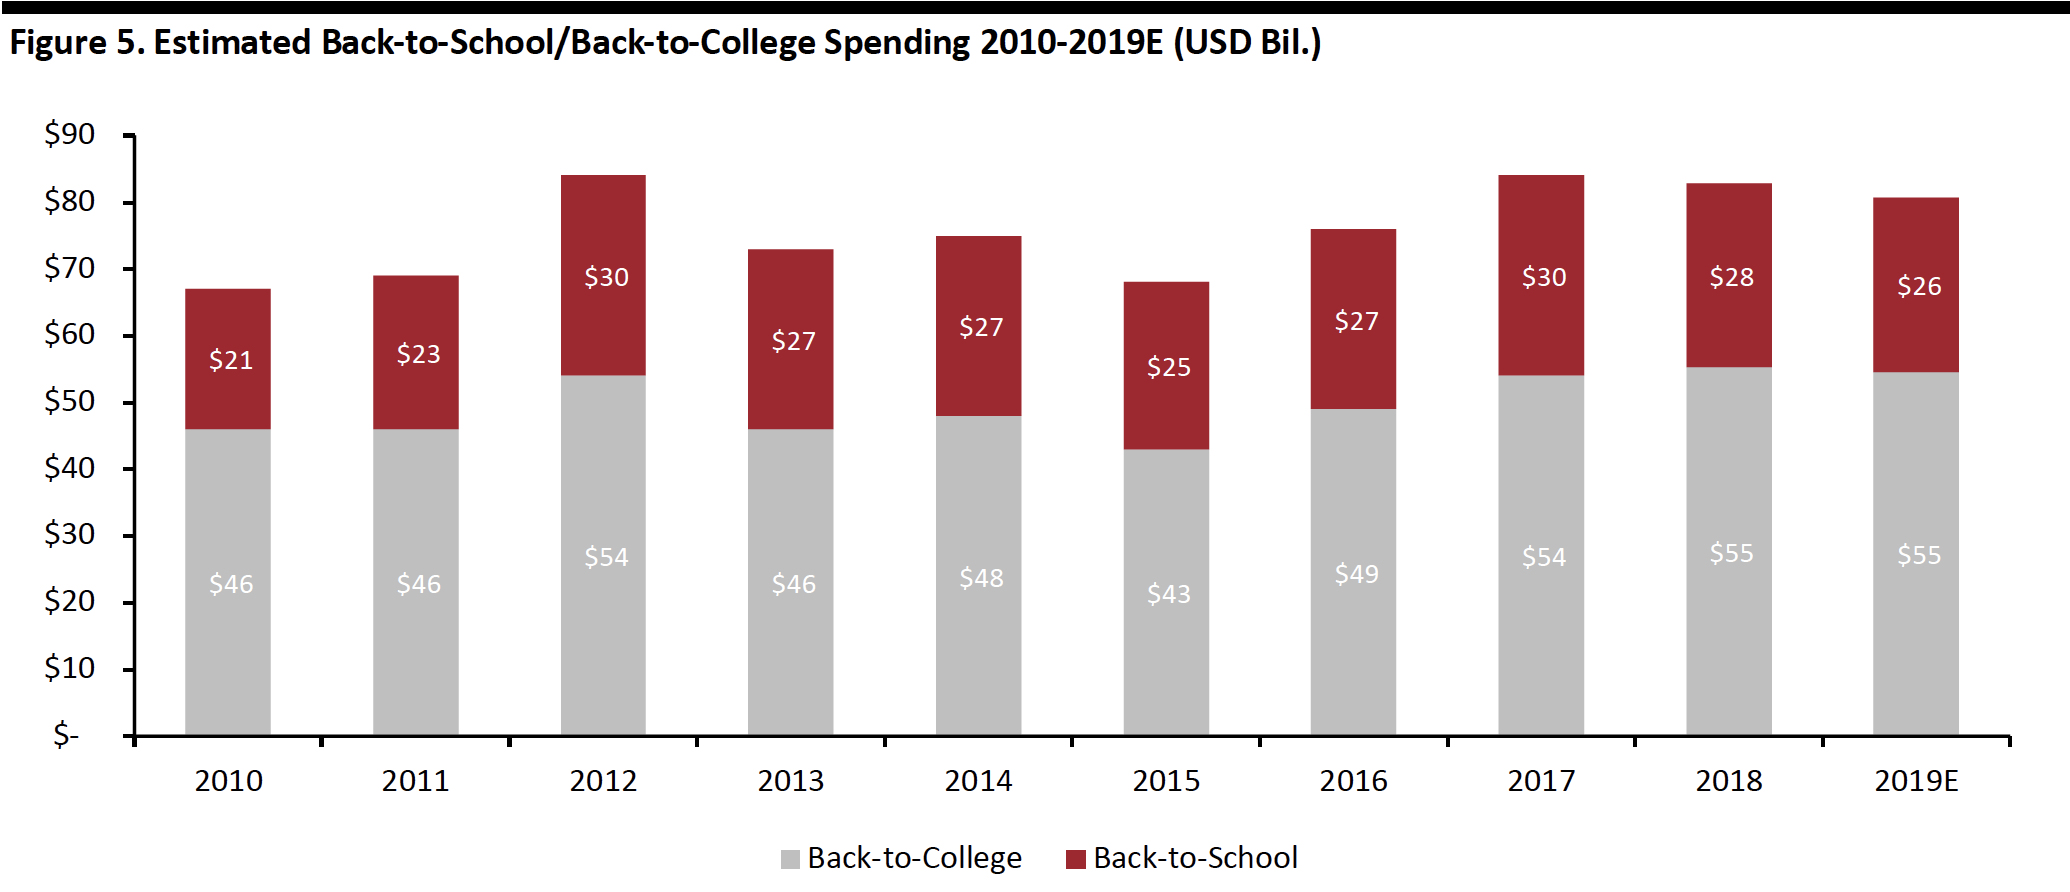 Source: NRF/Prosper Insights & Analytics[/caption]
Across the major back-to-school purchase categories of apparel, electronics, shoes and school supplies, the NRF forecasts the average family with children in elementary school through high school will spend $696.70, up 1.7% from last year’s $684.79.
The NRF expects average spend per household for back-to-college shoppers to increase 3.7% to $976.78, the highest spend in NRF records. Despite increased average spending, the NRF forecasts a decline in total spending due to the decreased number of total shoppers.
[caption id="attachment_93708" align="aligncenter" width="700"]
Source: NRF/Prosper Insights & Analytics[/caption]
Across the major back-to-school purchase categories of apparel, electronics, shoes and school supplies, the NRF forecasts the average family with children in elementary school through high school will spend $696.70, up 1.7% from last year’s $684.79.
The NRF expects average spend per household for back-to-college shoppers to increase 3.7% to $976.78, the highest spend in NRF records. Despite increased average spending, the NRF forecasts a decline in total spending due to the decreased number of total shoppers.
[caption id="attachment_93708" align="aligncenter" width="700"]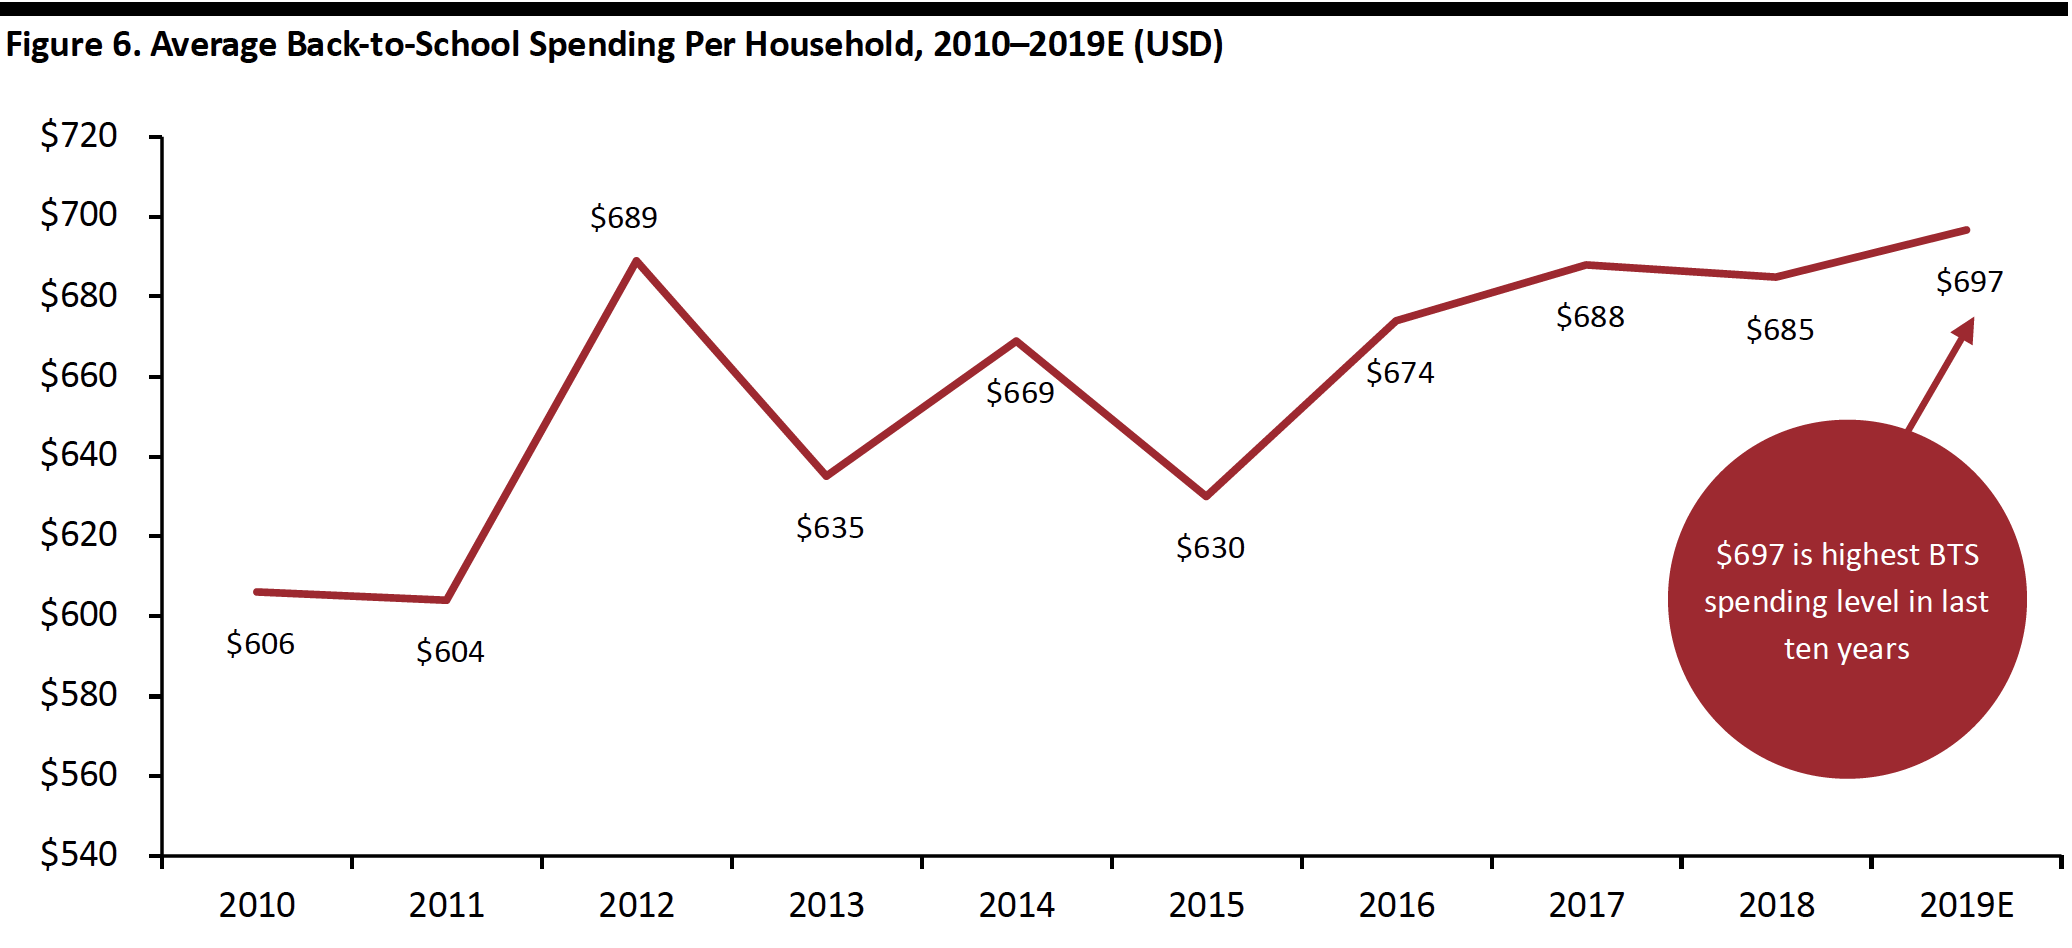 Source: NRF/Prosper Insights & Analytics[/caption]
Spending by Category
The biggest category for back-to-school spending is clothing and accessories, with expected per-household expenditure of $239.82, followed by electronics at $203.44. Shoes and school supplies are expected to reach $135.96 and $117.49 per household, respectively. Spending on electronics during this season will increase from $187.10 last year but remain slightly below the $204.33 seen in 2017.
[caption id="attachment_93709" align="aligncenter" width="700"]
Source: NRF/Prosper Insights & Analytics[/caption]
Spending by Category
The biggest category for back-to-school spending is clothing and accessories, with expected per-household expenditure of $239.82, followed by electronics at $203.44. Shoes and school supplies are expected to reach $135.96 and $117.49 per household, respectively. Spending on electronics during this season will increase from $187.10 last year but remain slightly below the $204.33 seen in 2017.
[caption id="attachment_93709" align="aligncenter" width="700"]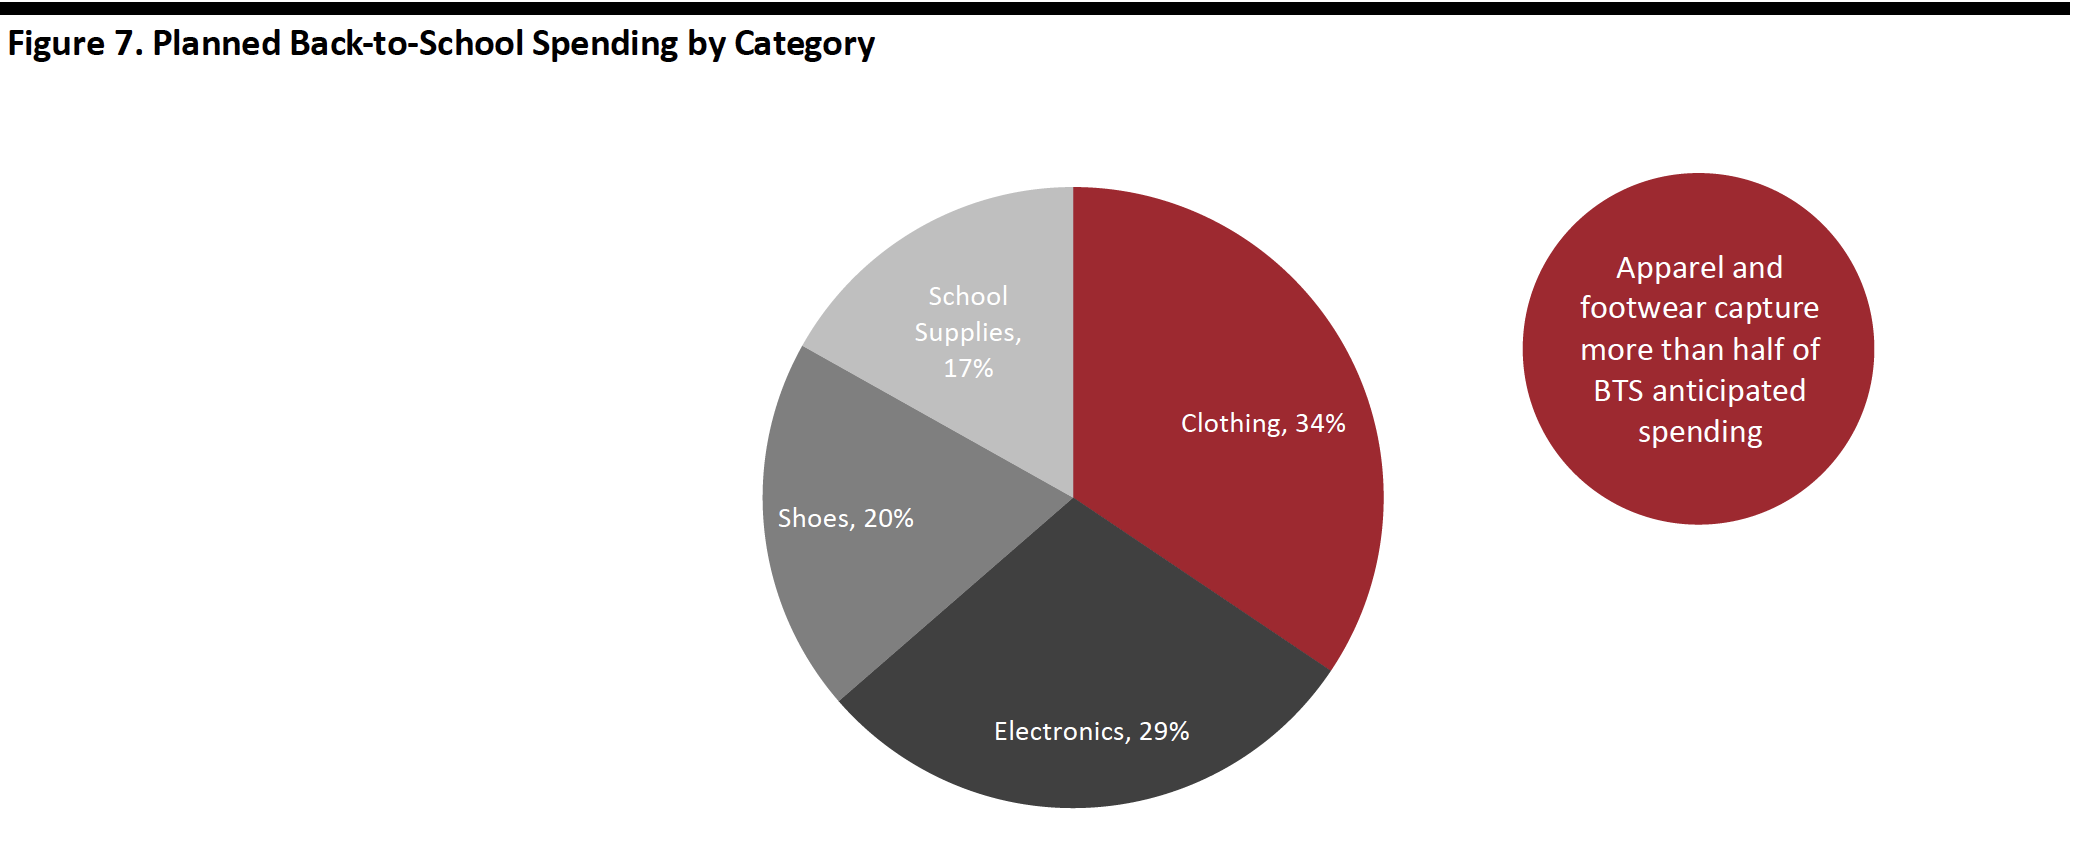 Source: NRF/Prosper Insights & Analytics[/caption]
Electronics is the biggest category for spending by college students and their families, at an estimated $234.69 per household, around $5 more than last year. Other than electronics, purchases of dormitory and apartment furnishings is forecast to increase almost $11 to $120.19, but spending on clothes will decline to an average of $148.54 from last year’s $153.32.
[caption id="attachment_93710" align="aligncenter" width="700"]
Source: NRF/Prosper Insights & Analytics[/caption]
Electronics is the biggest category for spending by college students and their families, at an estimated $234.69 per household, around $5 more than last year. Other than electronics, purchases of dormitory and apartment furnishings is forecast to increase almost $11 to $120.19, but spending on clothes will decline to an average of $148.54 from last year’s $153.32.
[caption id="attachment_93710" align="aligncenter" width="700"]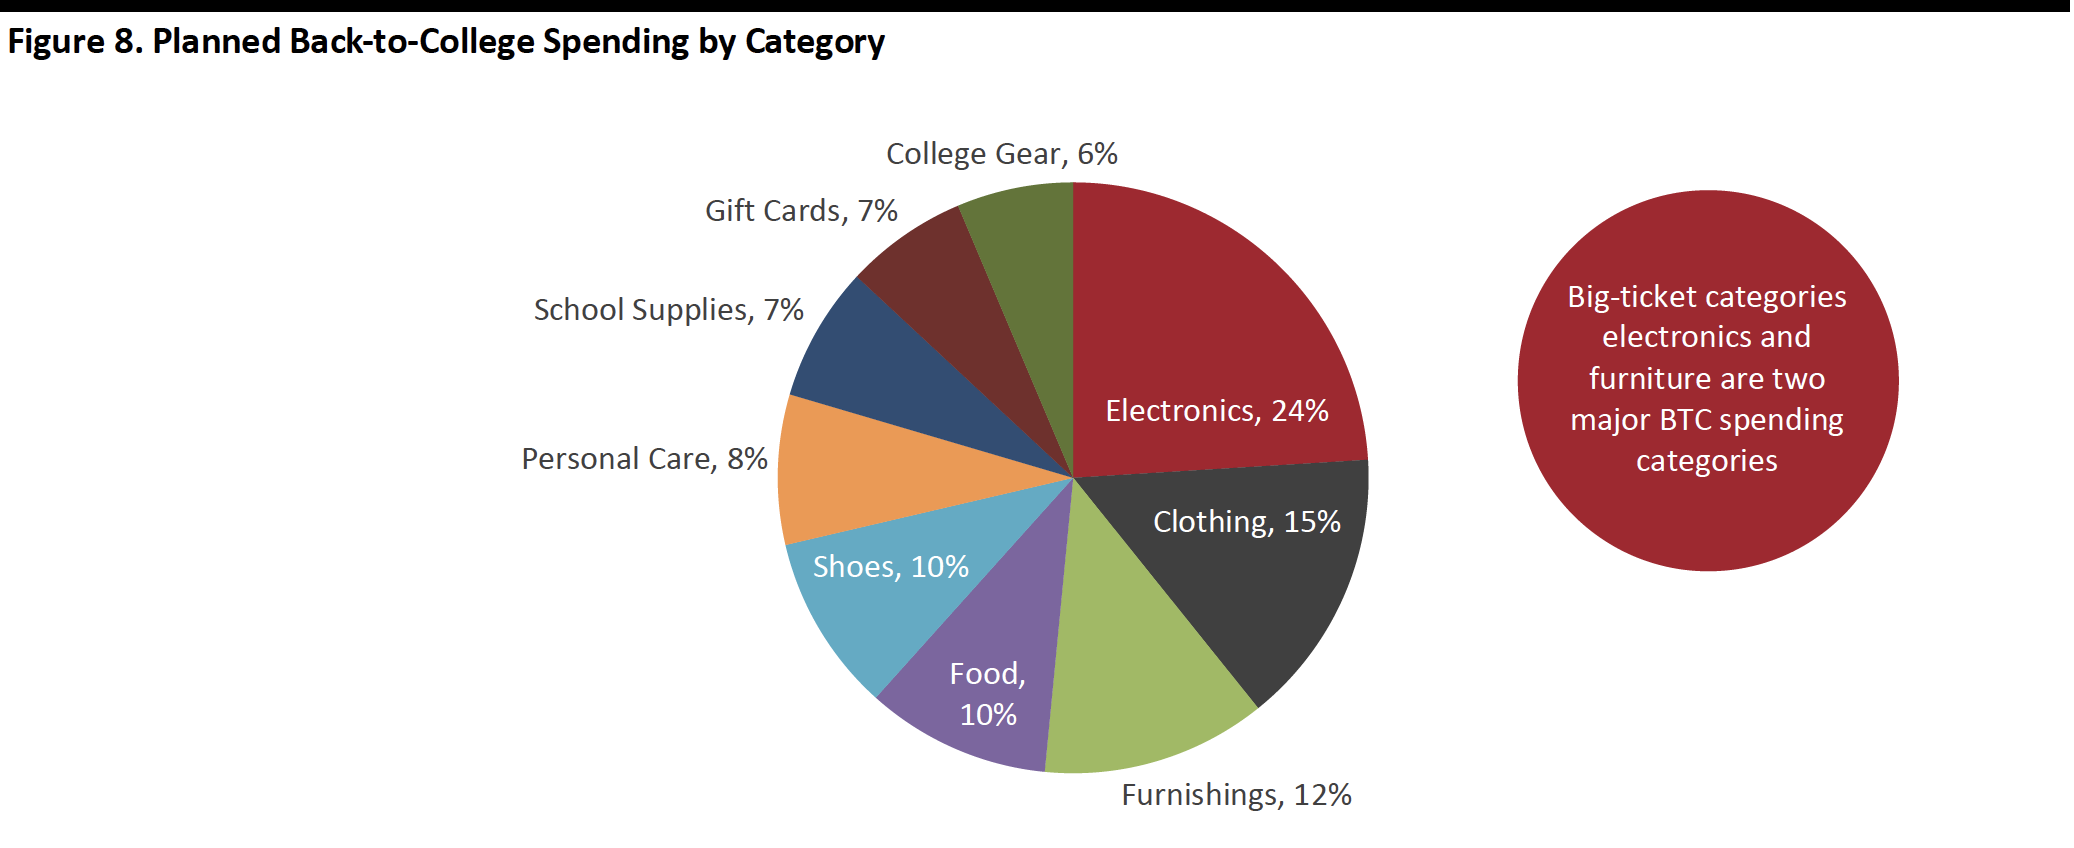 Source: NRF/Prosper Insights & Analytics[/caption]
Where Shoppers Plan to Shop: Consumers Look for Good Deals
Same as last year, the department store remains the top destination for back to school shopping, although the proportion of respondents saying they will shop there declined 4.7 percentage points year over year to 52.5%. However, discount stores overtook online as the second biggest channel with 50.1% expecting to shop at discount stores. According to Prosper’s survey, rates of online shopping are set to be around seven percentage points lower than last year, at 48.8% of shoppers.
Surprisingly, almost every channel saw a decrease in the proportion of people shopping, except for local/small business. The proportion of respondents saying they will shop at a local/small business expanded 2.1 percentage points to 15.9% from last year, up 4 percentage points from 2017.
[caption id="attachment_93711" align="aligncenter" width="700"]
Source: NRF/Prosper Insights & Analytics[/caption]
Where Shoppers Plan to Shop: Consumers Look for Good Deals
Same as last year, the department store remains the top destination for back to school shopping, although the proportion of respondents saying they will shop there declined 4.7 percentage points year over year to 52.5%. However, discount stores overtook online as the second biggest channel with 50.1% expecting to shop at discount stores. According to Prosper’s survey, rates of online shopping are set to be around seven percentage points lower than last year, at 48.8% of shoppers.
Surprisingly, almost every channel saw a decrease in the proportion of people shopping, except for local/small business. The proportion of respondents saying they will shop at a local/small business expanded 2.1 percentage points to 15.9% from last year, up 4 percentage points from 2017.
[caption id="attachment_93711" align="aligncenter" width="700"]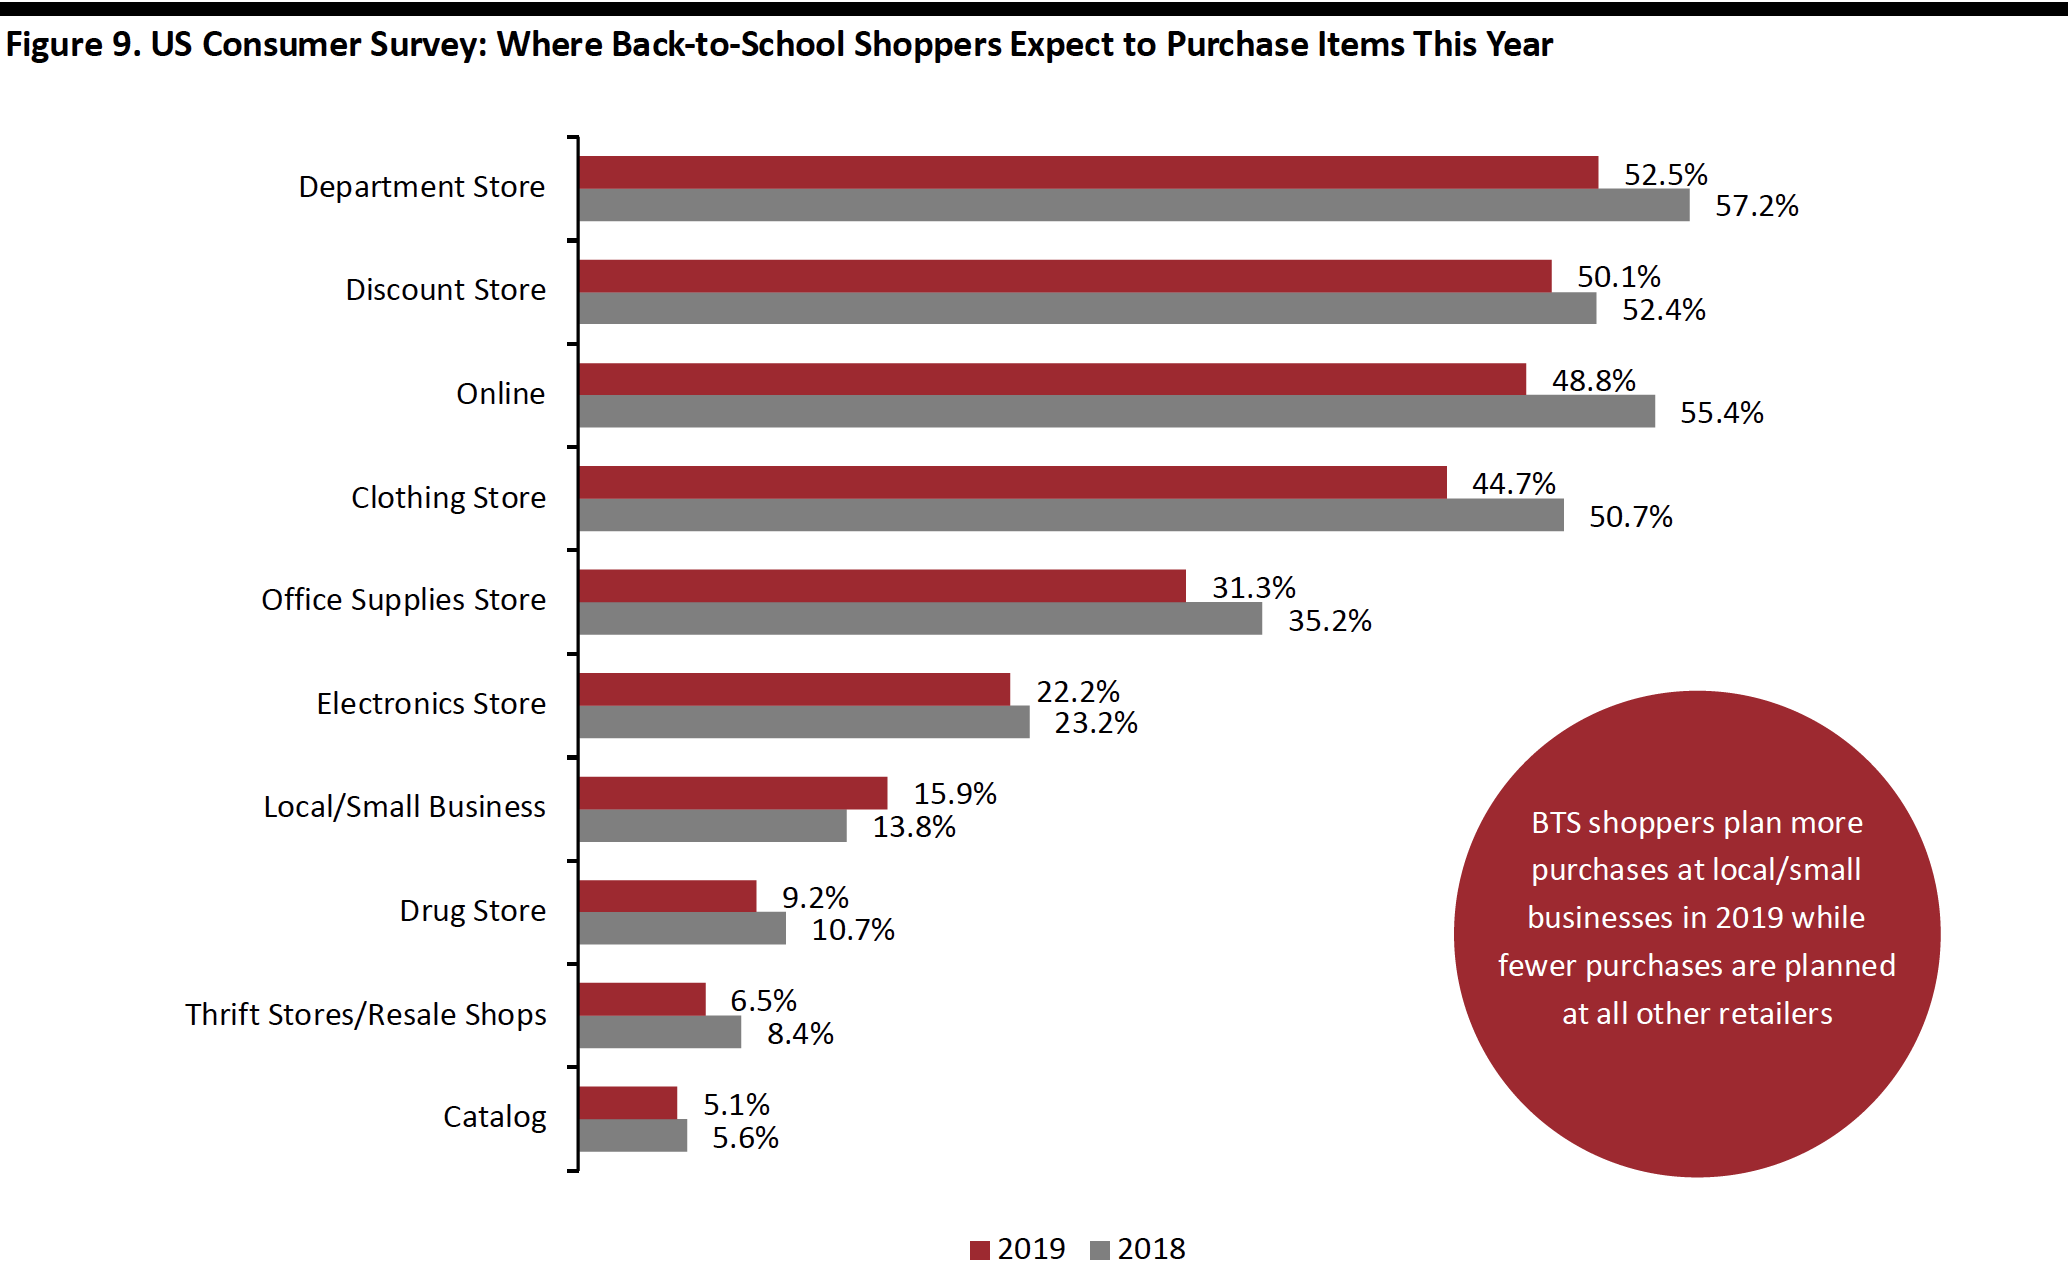 Base: 2,000+ US back-to-school shoppers aged 18+ each year
Source: Prosper Insights & Analytics[/caption] Amazon extended the Prime Day shopping event to two full days this year. Surveys suggested 59.1% of back-to-school shoppers would shop Amazon Prime Day deals, and only 24.9% of shoppers said they did not plan to participate in the Prime Day sale, whether from Amazon or other retailers. [caption id="attachment_93712" align="aligncenter" width="700"]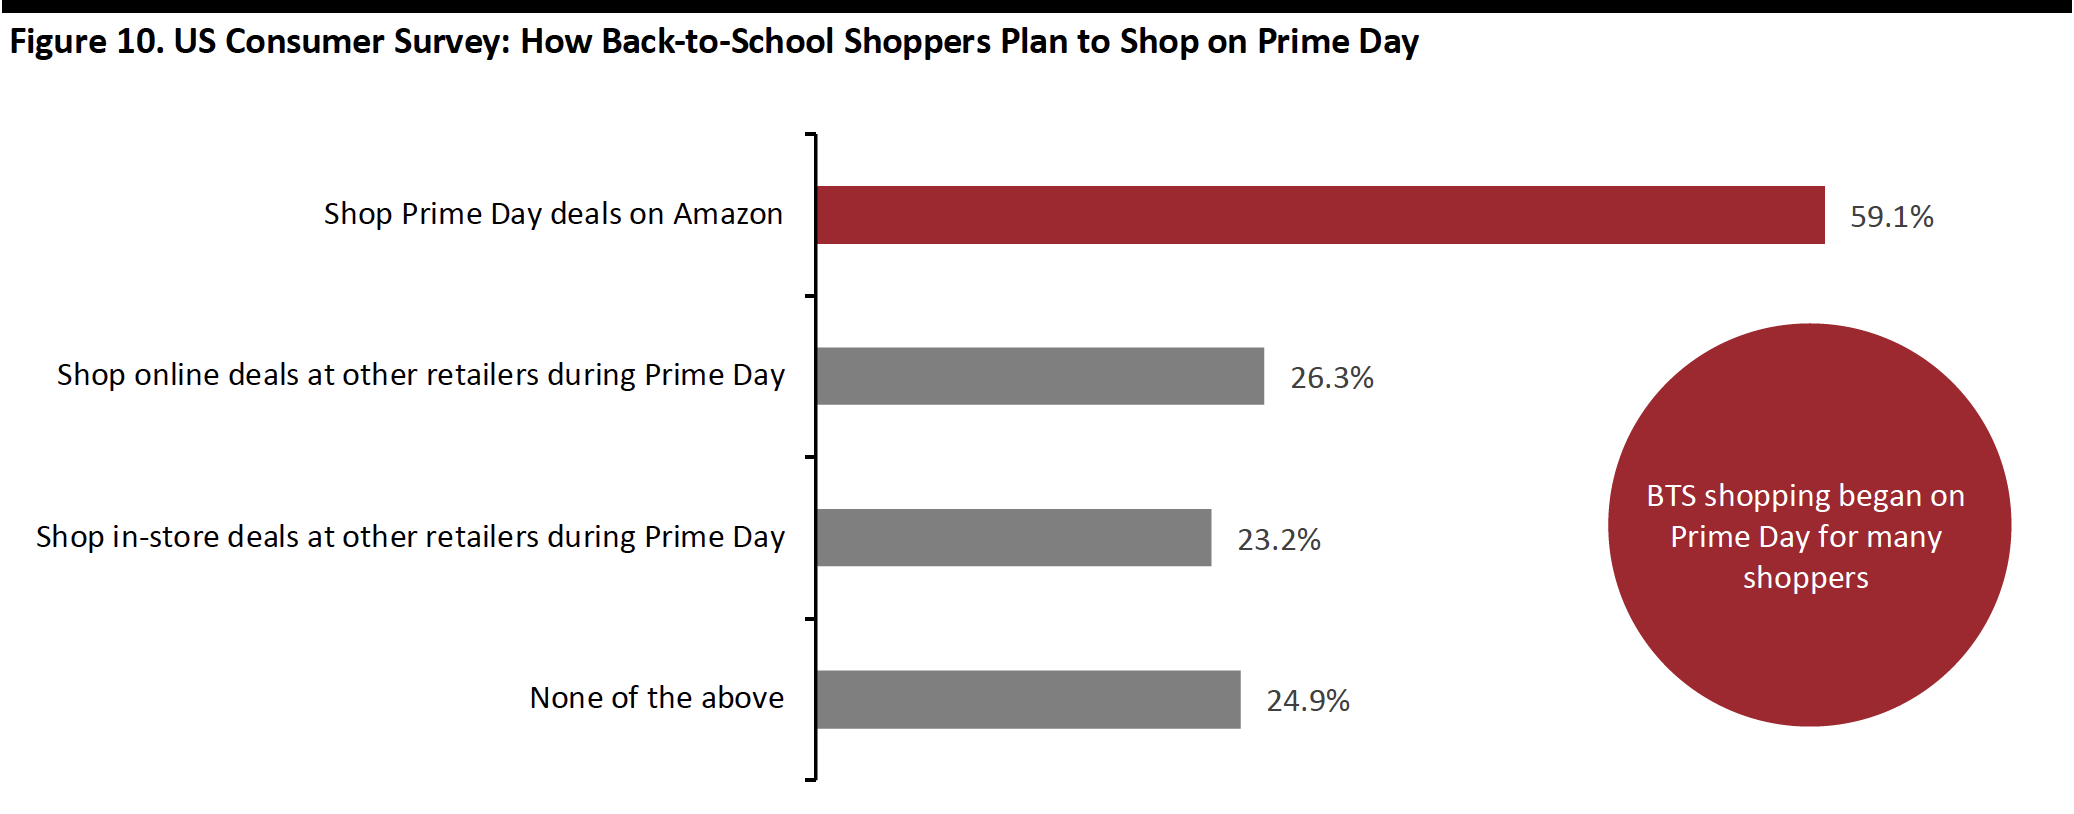 Base: 2,000+ US back-to-school shoppers aged 18+
Source: Prosper Insights & Analytics[/caption] Online vs. Offline Shopping A survey by Deloitte found that respondents plan to make 56% of their purchases in stores and order 29% online, up from last year’s 23% online. The remaining 15% are undecided about where they will spend. [caption id="attachment_93713" align="aligncenter" width="700"]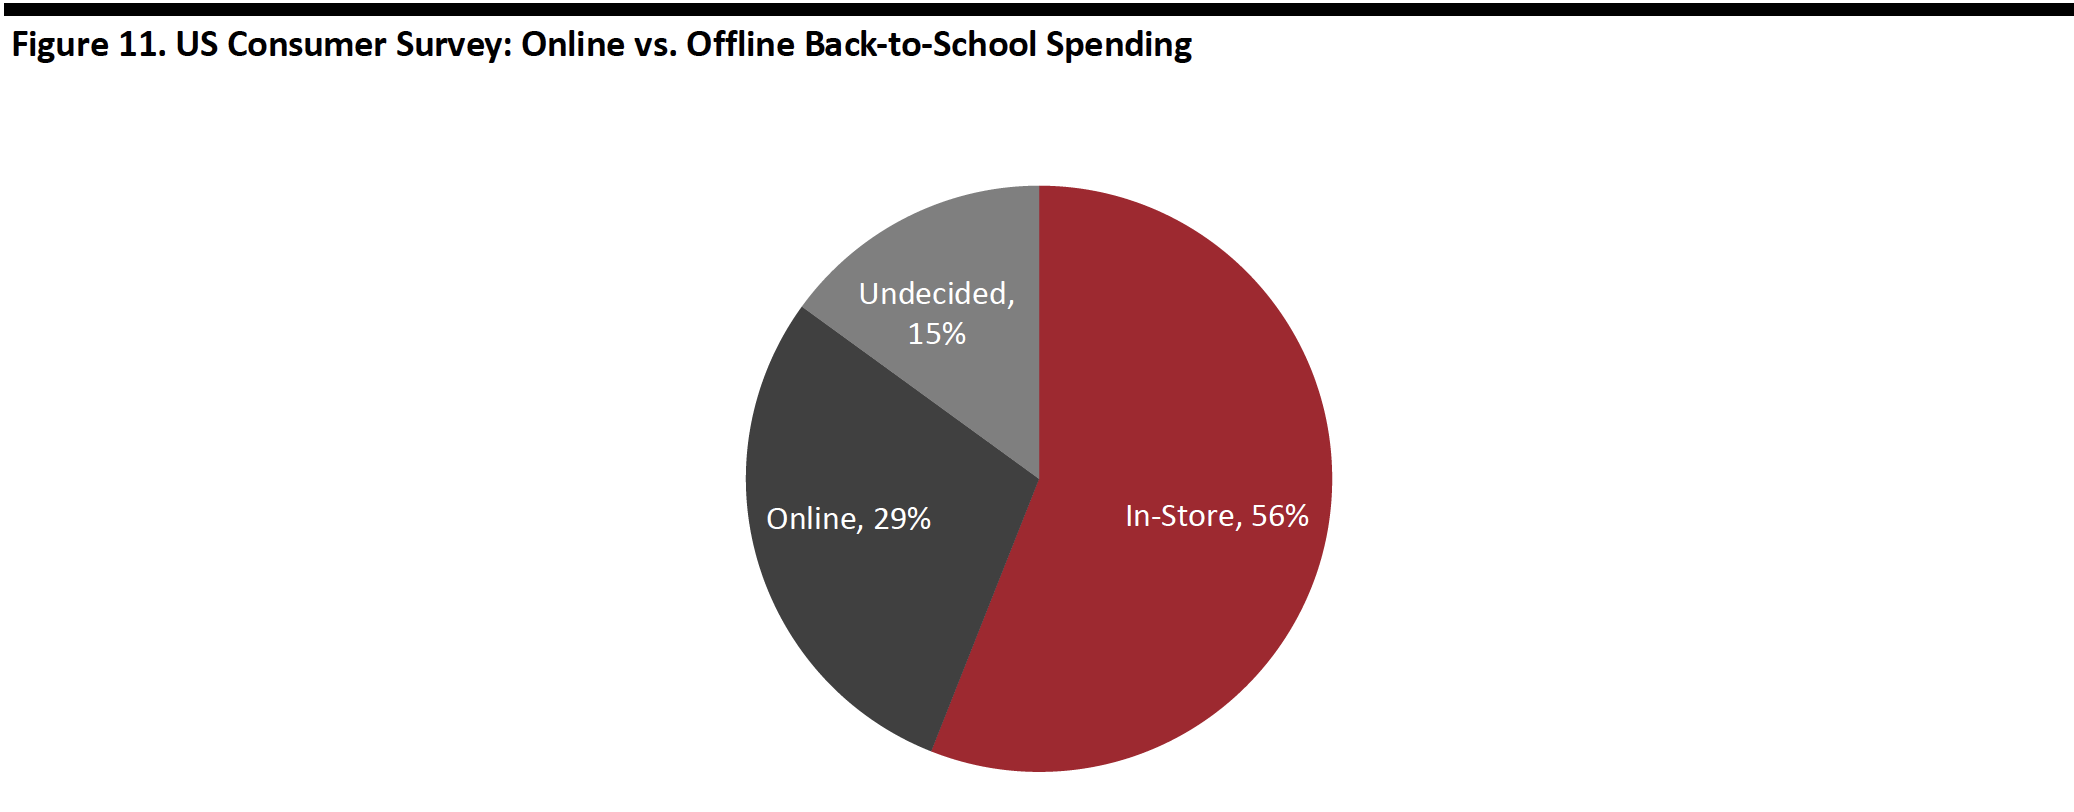 Source: Deloitte[/caption]
Most Shopping Will Happen in Early August
The back-to-school shopping period begins in mid-July and continues until September. The overall trend will be fairly consistent with last year. According to Deloitte, the first two weeks of August remain the most popular shopping period, with 64% of consumers shopping during that time. However, results suggest a higher percentage of consumers plan to shop in late July, up 4 percentage points to 58%, possibly taking advantage of the Prime Day sales. Only 27% will shop in early July, 10% before July and 10% in September.
[caption id="attachment_93714" align="aligncenter" width="700"]
Source: Deloitte[/caption]
Most Shopping Will Happen in Early August
The back-to-school shopping period begins in mid-July and continues until September. The overall trend will be fairly consistent with last year. According to Deloitte, the first two weeks of August remain the most popular shopping period, with 64% of consumers shopping during that time. However, results suggest a higher percentage of consumers plan to shop in late July, up 4 percentage points to 58%, possibly taking advantage of the Prime Day sales. Only 27% will shop in early July, 10% before July and 10% in September.
[caption id="attachment_93714" align="aligncenter" width="700"]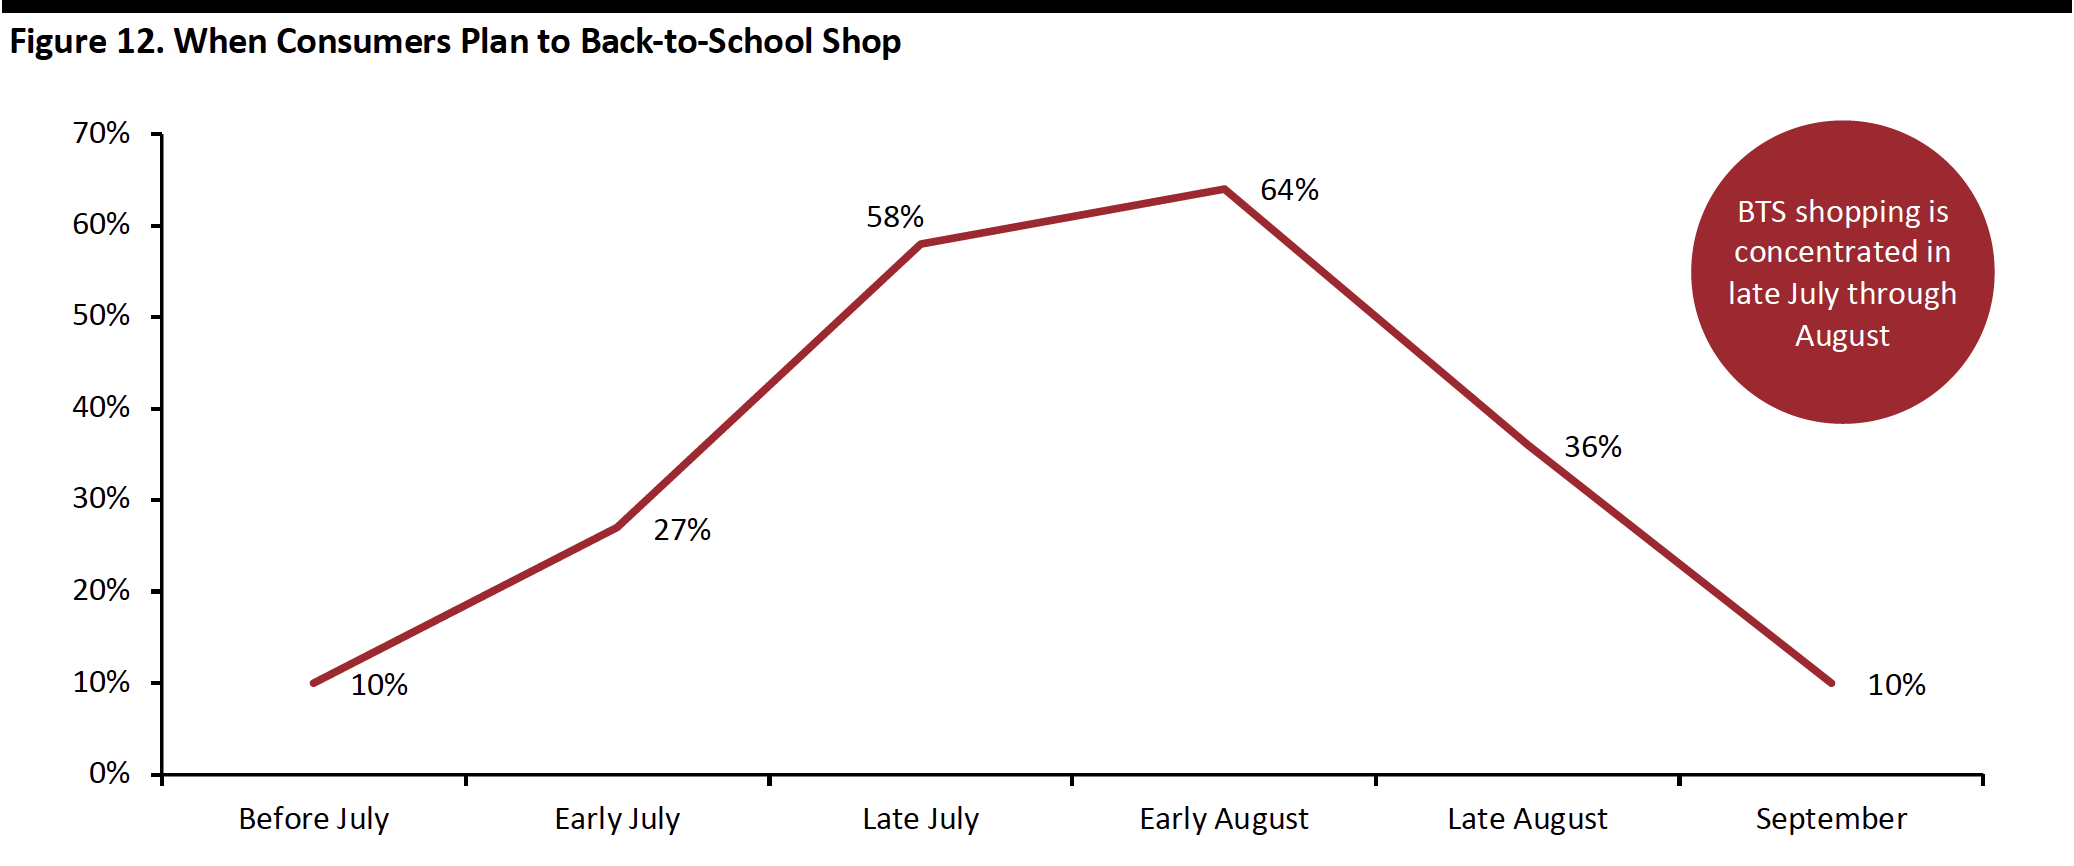 Measured in two-week intervals.
Source: Deloitte[/caption] Key Insights
Source: US Census Bureau/Coresight Research[/caption]
A mixed economic backdrop frames this year’s back-to-school shopping season. Higher wage growth and lower gas prices point to the potential for higher sales. However, nonfood retailer sales have risen just 3.2% year to date (through June), a significant slowdown from the 5.1% growth in the first six month of 2018.
Total retail sales growth has slowed this year, too: In June 2019 (latest), total retail sales grew by a modest 2.1% year over year. In June 2018, sales were growing at double that pace.
Our estimates are informed by June survey data from Prosper Insights & Analytics, which finds that only 17.1% of back-to-school shoppers expect to spend more this year than last, while some 60% say they will spend the same amount. Last year we saw a net 22.8% of back-to-school consumers expecting to spend more, which is higher than this year’s number, indicating a slowdown in spending growth for 2019.
[caption id="attachment_93704" align="aligncenter" width="700"] Base: 7,553 US adults aged 18+Source: Prosper Insights & Analytics[/caption] Positive economic indicators for this back-to-school season include:
- Lower gas prices: $2.80 average in June versus $2.97 a year earlier.
- A higher S&P CoreLogic Case-Shiller 20-City Composite Home Price Index: Up 0.81% in April to 215.68, versus 210.17 a year earlier.
- Lower unemployment: 3.7% in June versus 4.0% last year.
- University of Michigan Index of Consumer Sentiment: 98.4 in July versus 97.9 last year.
- Higher wage growth: Up 3.9% in June from 3.2% a year earlier.
- Slightly lower savings rate: Down to 6.1% in May, versus 6.6% last year.
- Slowing growth for nonfood retailers and total retail sales.
- Fewer tax-free shopping days: Three days fewer than last year.
Source: US Bureau of Economic Analysis/US Department of Labor Statistics/S&P Global/University of Michigan/Federation of Tax Administrators/Coresight Research[/caption]
The number of state sales tax holidays is 52 days, three days fewer than last year, due to Wisconsin’s absence, offsetting the two days added by Florida.
[caption id="attachment_93706" align="aligncenter" width="700"] Source: Federation of Tax Administrators[/caption]
The NRF Expects a Slight Dip to $80.7 Billion
The NRF takes a more pessimistic view of this back-to-school season than we do, based on fewer people shopping. According to its annual back-to-school and back-to-college survey, conducted by Prosper Insights & Analytics, back-to-school spending will decline for a second year, to $26.2 billion, and back-to-college spending will retreat from its peak to $54.5 billion. Total back-to-school and back-to-college spending is expected to reach $80.7 billion, falling short of last year’s $82.8 billion by 2.5%.
[caption id="attachment_93707" align="aligncenter" width="700"] Source: NRF/Prosper Insights & Analytics[/caption]
Across the major back-to-school purchase categories of apparel, electronics, shoes and school supplies, the NRF forecasts the average family with children in elementary school through high school will spend $696.70, up 1.7% from last year’s $684.79.
The NRF expects average spend per household for back-to-college shoppers to increase 3.7% to $976.78, the highest spend in NRF records. Despite increased average spending, the NRF forecasts a decline in total spending due to the decreased number of total shoppers.
[caption id="attachment_93708" align="aligncenter" width="700"] Source: NRF/Prosper Insights & Analytics[/caption]
Spending by Category
The biggest category for back-to-school spending is clothing and accessories, with expected per-household expenditure of $239.82, followed by electronics at $203.44. Shoes and school supplies are expected to reach $135.96 and $117.49 per household, respectively. Spending on electronics during this season will increase from $187.10 last year but remain slightly below the $204.33 seen in 2017.
[caption id="attachment_93709" align="aligncenter" width="700"] Source: NRF/Prosper Insights & Analytics[/caption]
Electronics is the biggest category for spending by college students and their families, at an estimated $234.69 per household, around $5 more than last year. Other than electronics, purchases of dormitory and apartment furnishings is forecast to increase almost $11 to $120.19, but spending on clothes will decline to an average of $148.54 from last year’s $153.32.
[caption id="attachment_93710" align="aligncenter" width="700"] Source: NRF/Prosper Insights & Analytics[/caption]
Where Shoppers Plan to Shop: Consumers Look for Good Deals
Same as last year, the department store remains the top destination for back to school shopping, although the proportion of respondents saying they will shop there declined 4.7 percentage points year over year to 52.5%. However, discount stores overtook online as the second biggest channel with 50.1% expecting to shop at discount stores. According to Prosper’s survey, rates of online shopping are set to be around seven percentage points lower than last year, at 48.8% of shoppers.
Surprisingly, almost every channel saw a decrease in the proportion of people shopping, except for local/small business. The proportion of respondents saying they will shop at a local/small business expanded 2.1 percentage points to 15.9% from last year, up 4 percentage points from 2017.
[caption id="attachment_93711" align="aligncenter" width="700"] Base: 2,000+ US back-to-school shoppers aged 18+ each yearSource: Prosper Insights & Analytics[/caption] Amazon extended the Prime Day shopping event to two full days this year. Surveys suggested 59.1% of back-to-school shoppers would shop Amazon Prime Day deals, and only 24.9% of shoppers said they did not plan to participate in the Prime Day sale, whether from Amazon or other retailers. [caption id="attachment_93712" align="aligncenter" width="700"]
Base: 2,000+ US back-to-school shoppers aged 18+Source: Prosper Insights & Analytics[/caption] Online vs. Offline Shopping A survey by Deloitte found that respondents plan to make 56% of their purchases in stores and order 29% online, up from last year’s 23% online. The remaining 15% are undecided about where they will spend. [caption id="attachment_93713" align="aligncenter" width="700"]
Source: Deloitte[/caption]
Most Shopping Will Happen in Early August
The back-to-school shopping period begins in mid-July and continues until September. The overall trend will be fairly consistent with last year. According to Deloitte, the first two weeks of August remain the most popular shopping period, with 64% of consumers shopping during that time. However, results suggest a higher percentage of consumers plan to shop in late July, up 4 percentage points to 58%, possibly taking advantage of the Prime Day sales. Only 27% will shop in early July, 10% before July and 10% in September.
[caption id="attachment_93714" align="aligncenter" width="700"] Measured in two-week intervals.Source: Deloitte[/caption] Key Insights
- We expect to see 2.0-2.5% growth in our back-to-school sales benchmark this year — total nonfood retailers’ sales in the July-to-September period. This is against a mixed economic backdrop that includes a slowdown in nonfood retailers’ sales growth and total retail sales growth.
- As with last year, apparel will be the biggest category for back-to-school shoppers, and electronics the biggest for back-to-college.
- The busiest time for back-to-school shopping will be the first two weeks of August, followed by the last two weeks of July.
- Back-to-school shoppers are looking for good deals, with discount stores expected to become the second-most-shopped channel this year.
- Digital Trends
- Apparel Trends