US Back-to-School 2018, Part 1: Solid Season Expected with 3.0%–4.0% Spending Growth Forecast
Against a solid economic backdrop, we expect US back-to-school sales to increase by 3.0%–4.0% year over year. A largely positive economic backdrop frames this year’s back-to-school shopping season. Higher wage growth, coupled with increased consumer confidence and spending, indicate potential for higher sales. Raised gas prices are the cloud on the horizon, but we expect that to have a limited impact on back-to-school sales. So far this year, general merchandise sales have risen solidly despite jumps in gas prices, and total retail sales excluding gasoline were up by a strong 4.5% year over year in the first six months of the year.
One force softening back-to-school spending growth is consumers’ apparent de-prioritization of apparel, which is the biggest back-to-school category. Apparel spending is growing more slowly than total retail sales year to date, and total retail sales are being boosted by non-back-to-school categories such as home improvement.
Our estimates are informed by June survey data from Prosper Insights & Analytics, which finds that a net 22.8% of back-to-school shoppers expect to spend more this year than last.
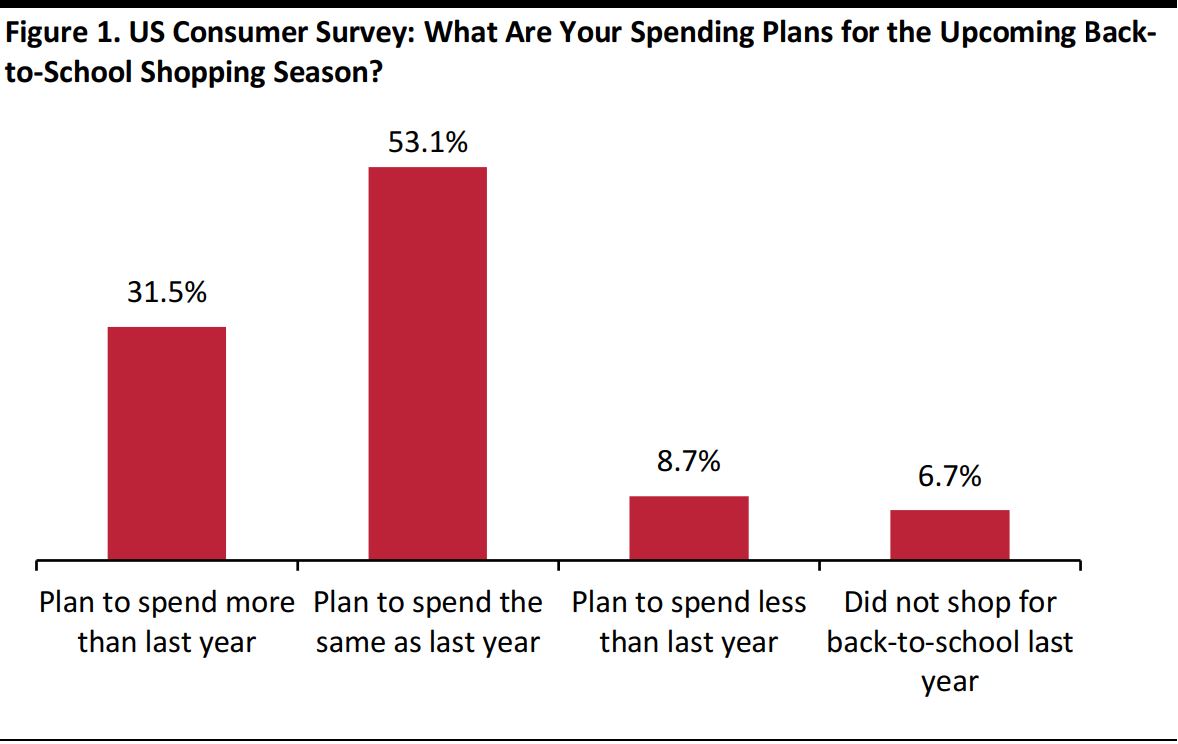
Base: 7,199 back-to-school shoppers ages 18+
Source: Prosper Insights & Analytics
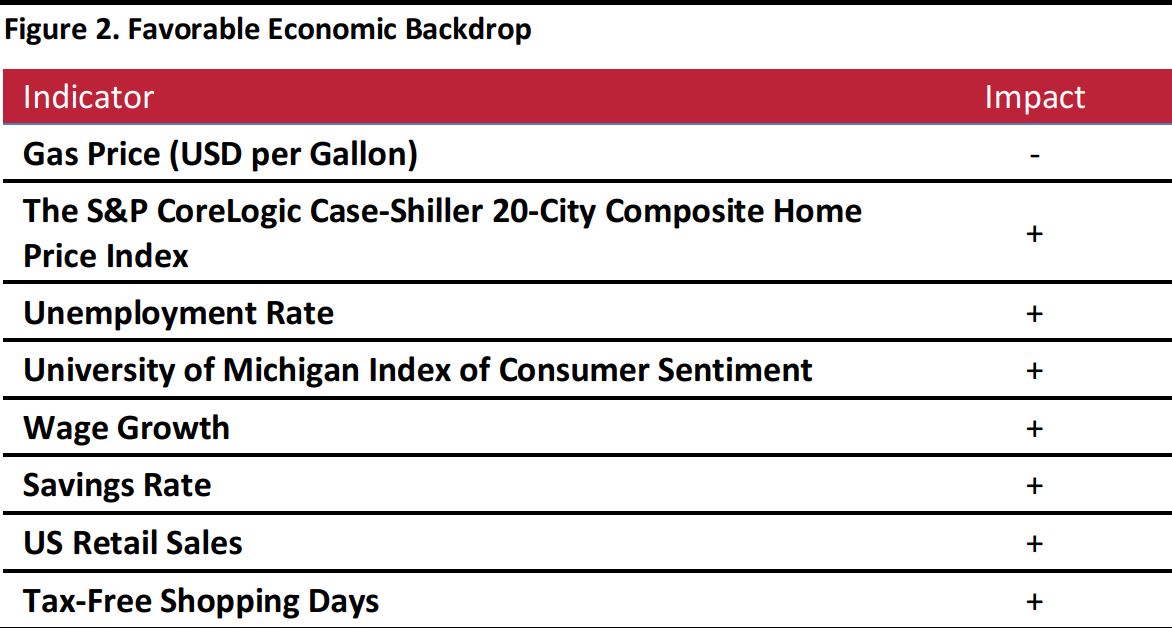
Positive economic indicators for this back-to-school season include:
- Lower unemployment: 0% in June versus 4.4% last year
- A higher University of Michigan Index of Consumer Sentiment: 1 in July from 93.4 last year
- A higher S&P CoreLogic Case-Shiller 20-City Composite Home Price Index: up 6.6% in April to 210.17, versus 197.24 a year earlier
- Increases in consumer spending: core retail sales are up 4.5% from last year across the first six months of 2018
- Higher wage growth: up 2.7% in June from 2.5% a year earlier
- Slightly lower savings rate: down to 3.2% in May, versus 3.8% last year
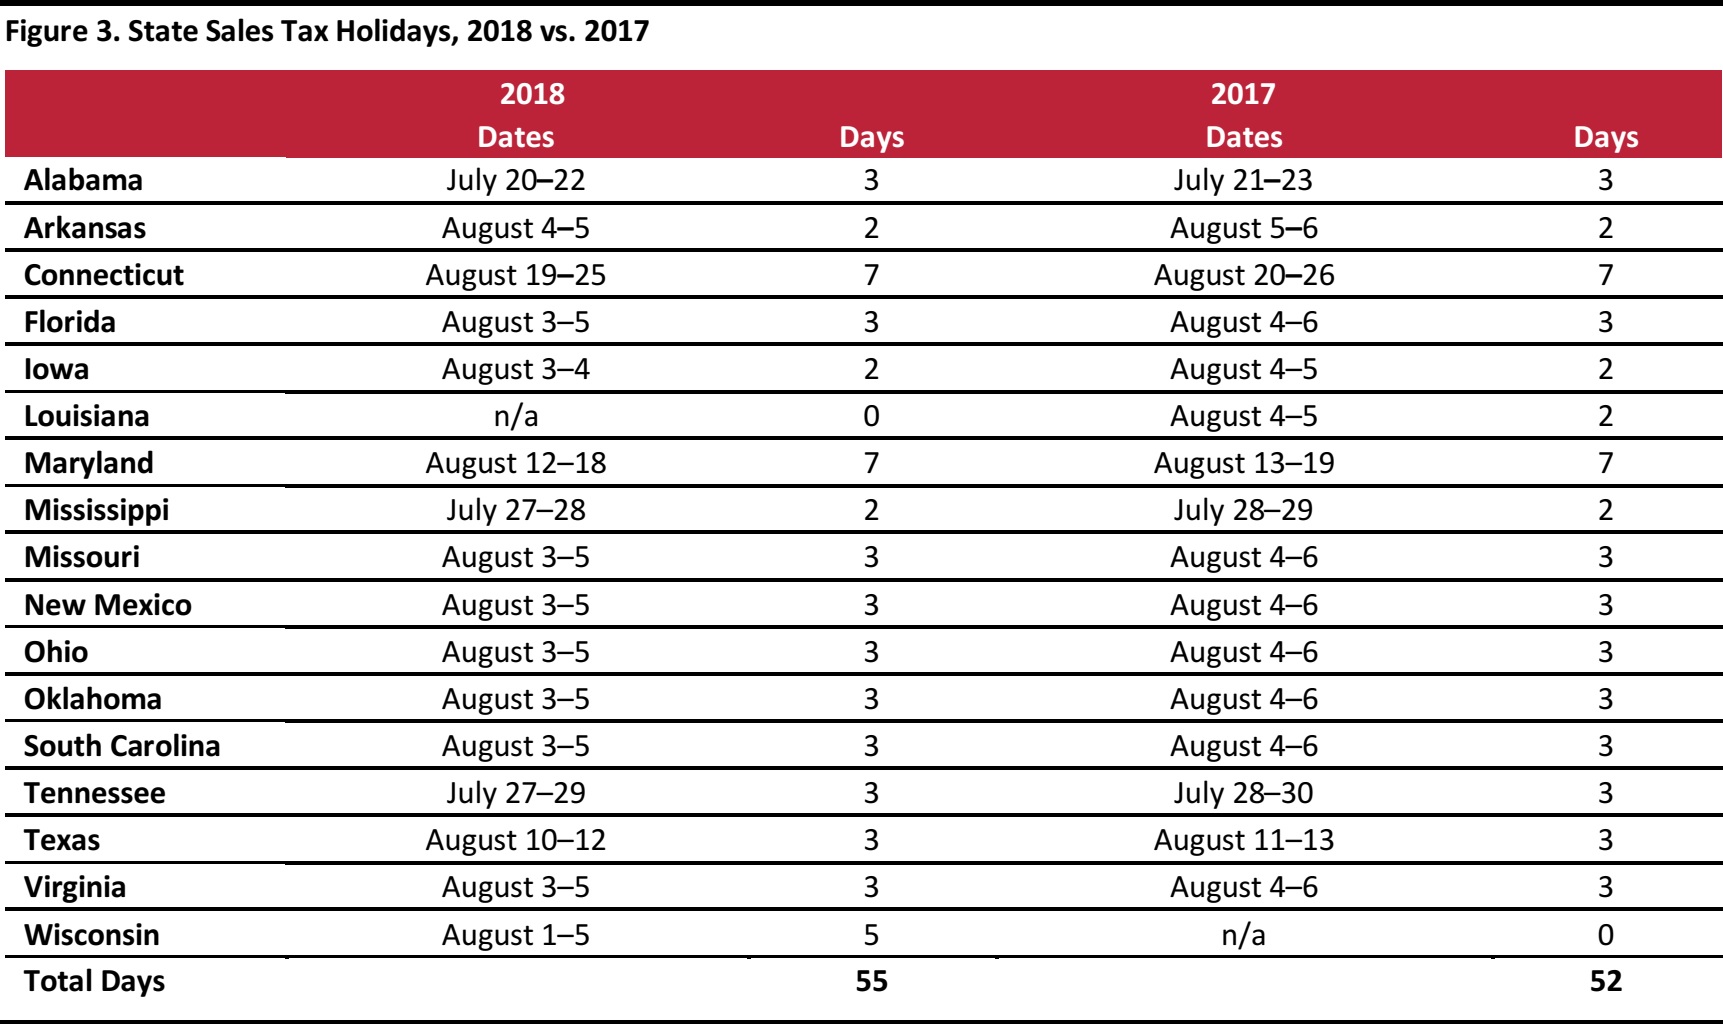
- More tax-free shopping days: three days more than last year
Negative economic indicators include:
- Higher gas prices: $3.25 in June versus $2.51 a year earlier
- Increases in home improvement sales: not a category in back-to-school spending, but driving total retail growth
Source: US Bureau of Economic Analysis/US Department of Labor Statistics/S&P Global/University of Michigan/Federation of Tax Administrators/Coresight Research
Source: Federation of Tax Administrators
eMarketer Forecasts the Power of Deals
Research firm eMarketer expects discounts will be essential in retailers’ back-to-school planning. Nearly 80% of consumers surveyed said they would buy from a new retailer or brand if it offered a good deal. Running from July 12 to September 8, back-to-school is the longest shopping season in the US. Shopping habits fluctuate across days: weekdays rank the most popular time for e-commerce purchases, while brick-and-mortar stores will see their most business on weekends. Overall, more than 75% of retailers are adjusting their strategies this year. While only 44% are increasing offline advertisements, 72% are upping their social media investments.
The NRF Expects a Slight Dip to $82.8 Billion
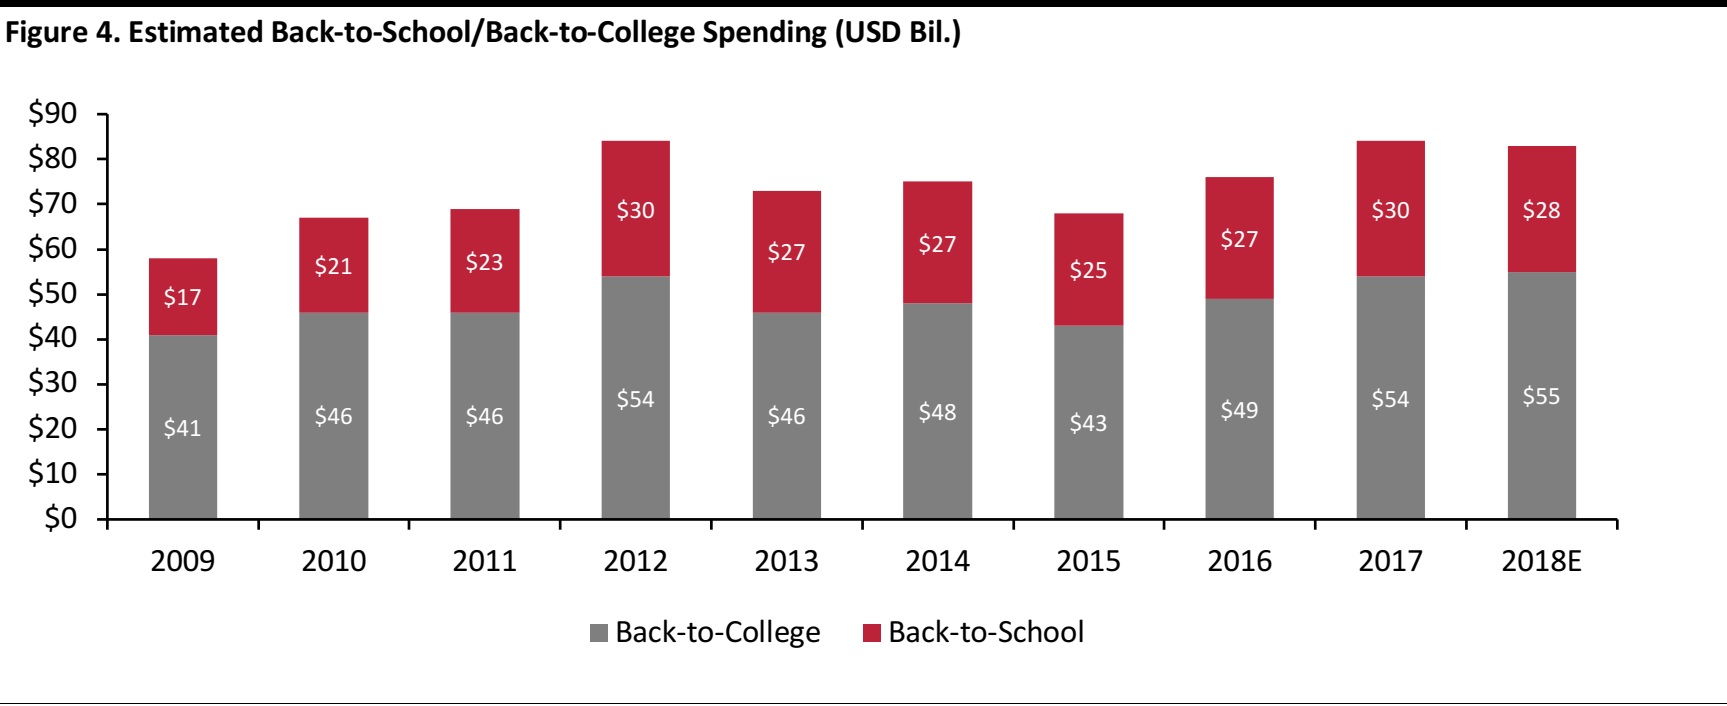
The NRF takes a more pessimistic view of this back-to-school season than we do. According to its annual back-to-school and back-to-college survey, which is conducted by Prosper Insights & Analytics, back-to-school spending will fall slightly short of last year to mark the third-highest-ever spending level, and back-to-college spending will reach its peak, driven by tax reform and growing consumer confidence. Total back-to-school and back-to-college spending is expected to reach $82.8 billion, falling short of last year’s $83.6 billion by 1%.
Source: NRF/Prosper Insights & Analytics
The NRF uses its annual consumer survey as the basis for its total expenditure forecast; this survey asks shoppers to predict an absolute value of their back-to-school spending. Based on recent retail sales data, we are less pessimistic than the NRF is. As we noted earlier, core retail sales are up 4.5% year over year across the first six months of 2018, while sales at general merchandise, apparel, furniture and other nonfood stores (GAFO) are up 3.4% year-over-year so far this year. Total retail growth is being supported by categories that are not typical back-to-school purchases.
Apparel and Electronics, the Two Biggest Categories in Back-to-School Spending
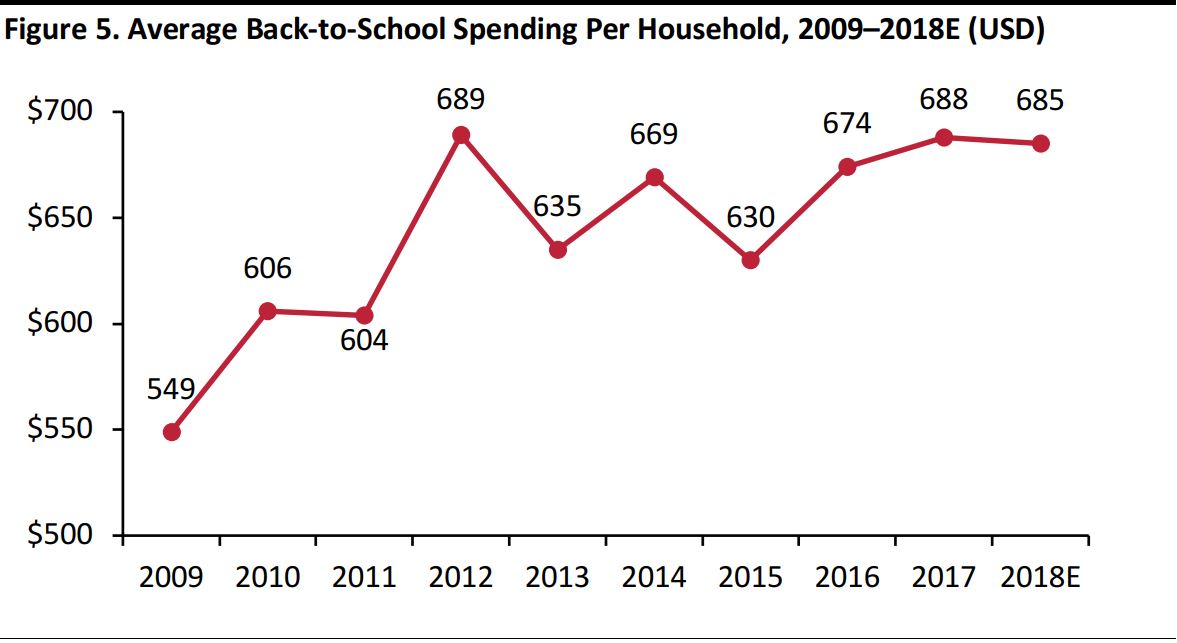
Across the major back-to-school purchase categories of apparel, electronics, shoes and school supplies, the NRF forecasts that the average family with children in elementary school through high school will spend $684.79, down just 0.4% from last year’s $687.72. This anticipated small decline in per-household spending is the basis for the NRF’s forecast for an overall fall in back-to-school spending this year.
Source: NRF/Prosper Insights & Analytics
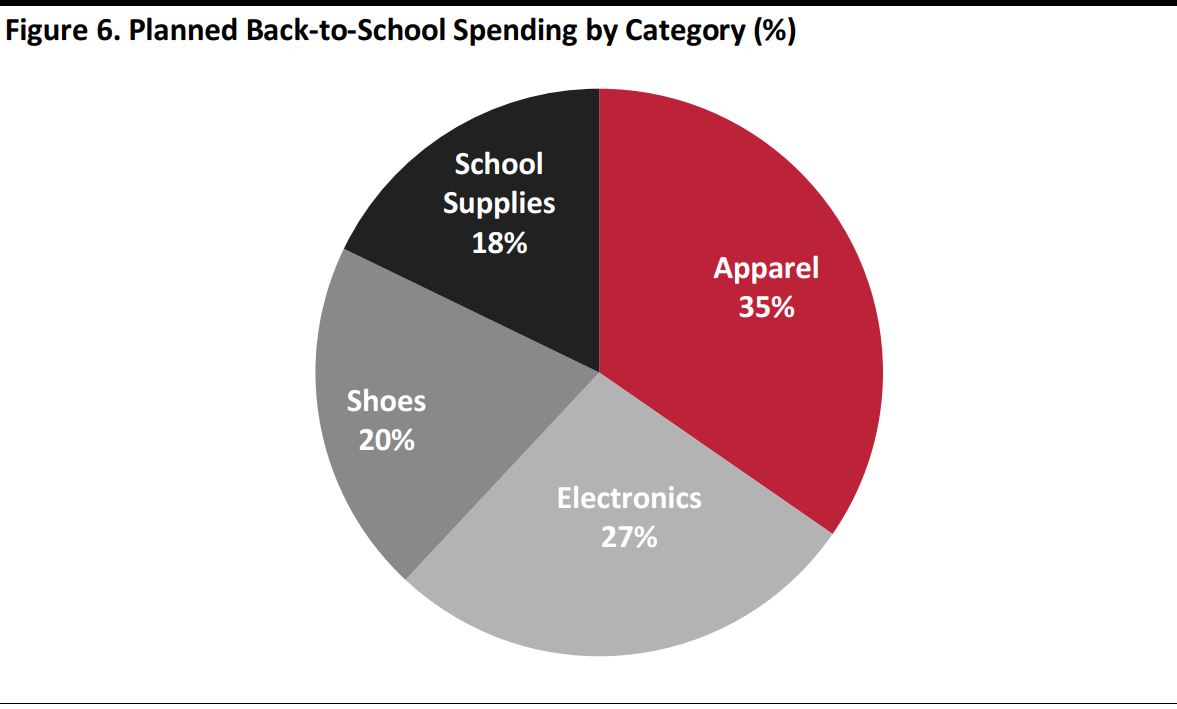
The biggest category for back-to-school spending is clothing and accessories, with expected per-household expenditure of $236.90, followed by electronics at $187.10. Shoes and school supplies are expected to reach $138.66 and $122.13 per household, respectively. Spending on electronics during this season has fallen from $204.33 last year, as technology becomes a bigger part of everyday life, rather than a purchase saved for back-to-school time.
Source: NRF/Prosper Insights & Analytics
Back-to-College Spending
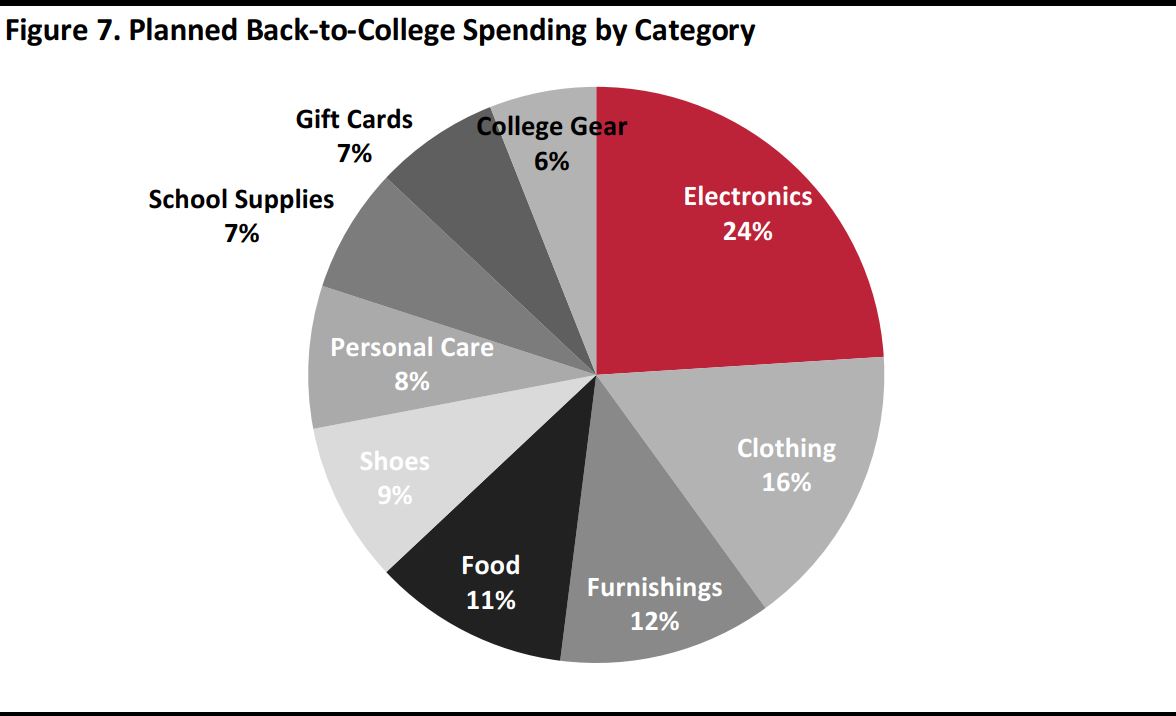
Electronics is the biggest category for spending by college students and their families, at an estimated $229.21 per household. Other than electronics, their major purchases are forecast to cost them an average of $153.32 on clothes and $109.29 on dorm and apartment furnishings. College shoppers spend across a wider array of sectors in their back-to-college shopping than grade-school shoppers.
Source: NRF/Prosper Insights & Analytics
Where Shoppers Plan to Shop: E-Commerce Set to Make Headway
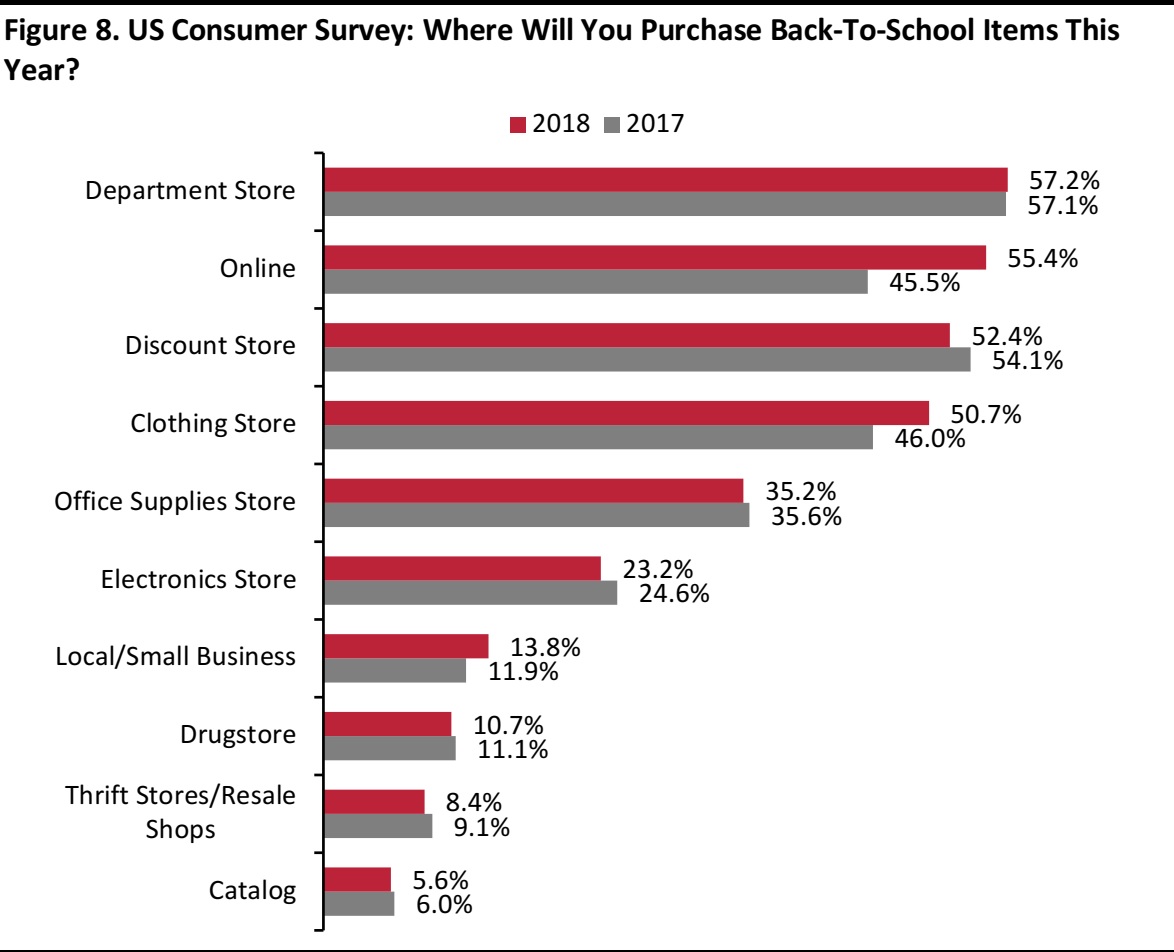
Perhaps unsurprisingly, online is set to be the big winner this back-to-school season. According to Prosper’s July survey, rates of online shopping are set to be around 10 percentage points higher than last year, at 55% of shoppers.
By a slim margin, department stores remain the top retail sector overall, with the proportion of respondents saying that they will shop there changing little year over year, at 57%.
The apparent slight migration away from discount stores this back-to-school season adds weight to our expectations for a solid increase in total sales.
Base: 7,000+ US back-to-school shoppers in each year
Source: Prosper Insights & Analytics
Online vs. Offline Shopping
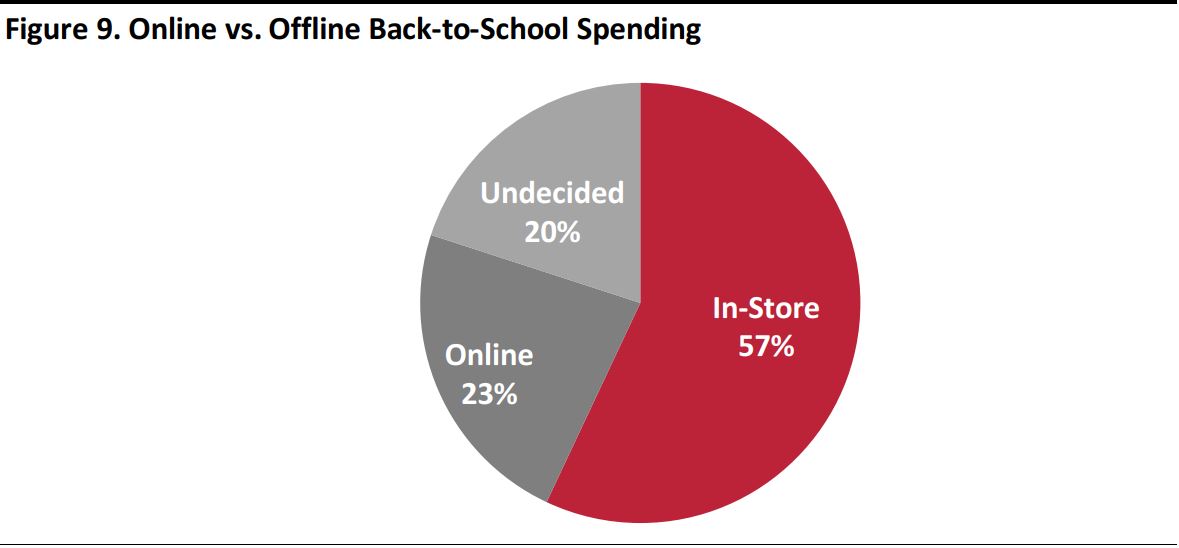
A survey by Deloitte found that the average spending per family across back-to-school and back-to-college shopping will total $510. Of that sum, survey respondents reported that they plan to make 57% of their purchases in stores, order 23% online and are undecided about where they will spend the remaining 20%.
Source: Deloitte
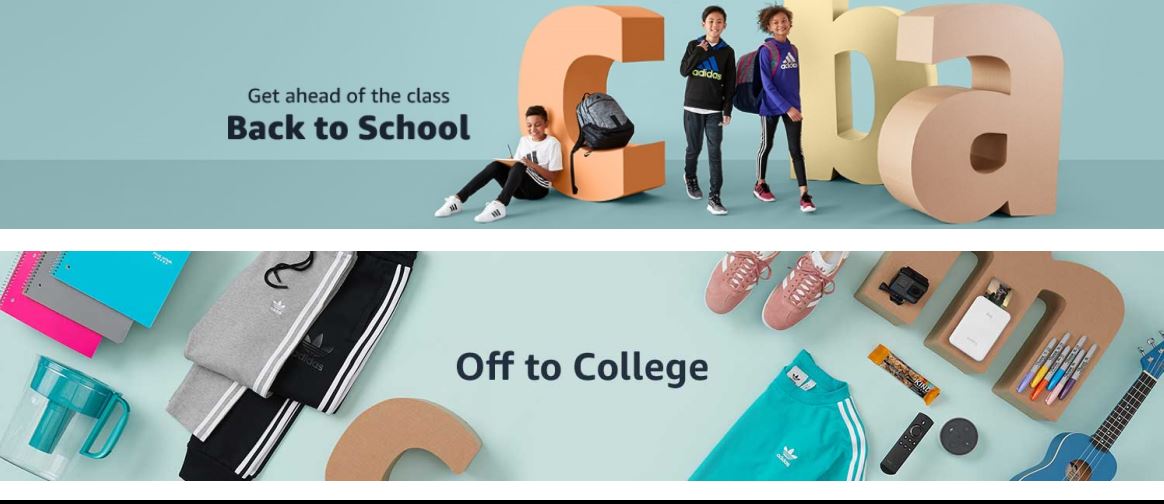
Many retailers are seeking to attract back-to-school shoppers by offering convenient and simplifying shopping solutions. In late June, Amazon launched both back-to-school and back-to-college pages to bring onto one page all the categories of goods shoppers seek. The back-to-school page features major categories—school supplies, clothing, electronics, and a deals section. Shoppers can select a grade-level filter, which includes Pre-K through 5, 6 through 8 and 9 through 12, to view most relevant products. In October 2017, Amazon came out with a new type of account for teens that allows them to connect to their parents’ accounts, while giving parents options to restrict spending and purchases.
Source: Amazon.com
The primary categories on the back-to-college page include dorm essentials, textbooks, and electronics, along with a deals feature and an apparel section. Other sites such as those from JCPenney and Kohl’s have similar interfaces. Target’s School List Assist enables parents to view their children’s schools’ back-to-school items, add any goods to their carts and choose to pick up their order or have it delivered to their homes.
Source: Target.com
Most Shopping Will Happen in Early August
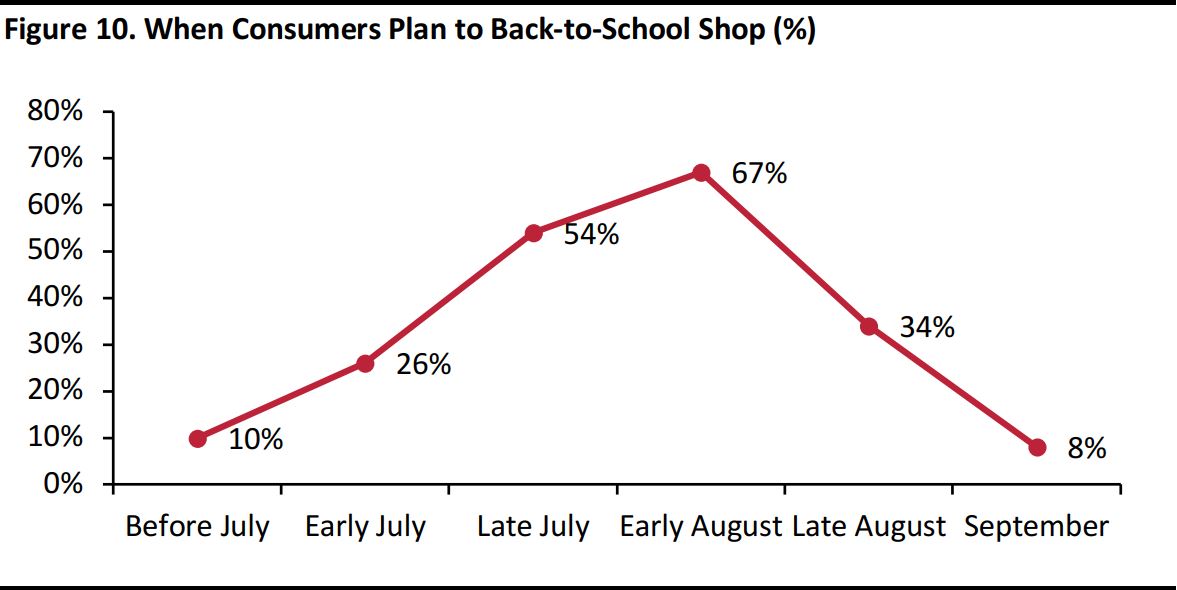
The back-to-school shopping period begins in mid-July and continues until September. According to Deloitte, the most popular shopping period is the first two weeks of August, with 67% of consumers shopping during that time, followed by 54% shopping in the last two weeks of July. Only 26% of shoppers are out in early July, and 10% and 8% shop before July or in September, respectively.
Measured in two-week intervals
Source: Deloitte
Key Takeaways
- We expect to see 3.0%–4.0% growth in back-to-school sales this year. Growth in wages, higher consumer confidence and increased spending set a positive economic backdrop for this year’s back-to-school season. Total retail sales are growing, but apparel growth, a key back-to-school category, has slowed. Another negative economic indicator is rising gas prices.
- Apparel is the biggest category for back-to-school shoppers, and electronics is the biggest for back-to-college.
- The busiest time for back-to-school shopping is the first two weeks of August, followed by the last two weeks of July.
- Back-to-school shoppers seek discounts and convenience. Both online and brick-and-mortar retailers are creating solutions to simplify the back-to-school shopping process.
Upcoming Back-to-School Reports
Keep an eye out for further reports in our
Back-to-School series in the coming weeks:
- Retail-Tech Trends
- Uniforms and Apparel Trends
