Nitheesh NH
US Apparel and Beauty Spending Tracker: February 2022
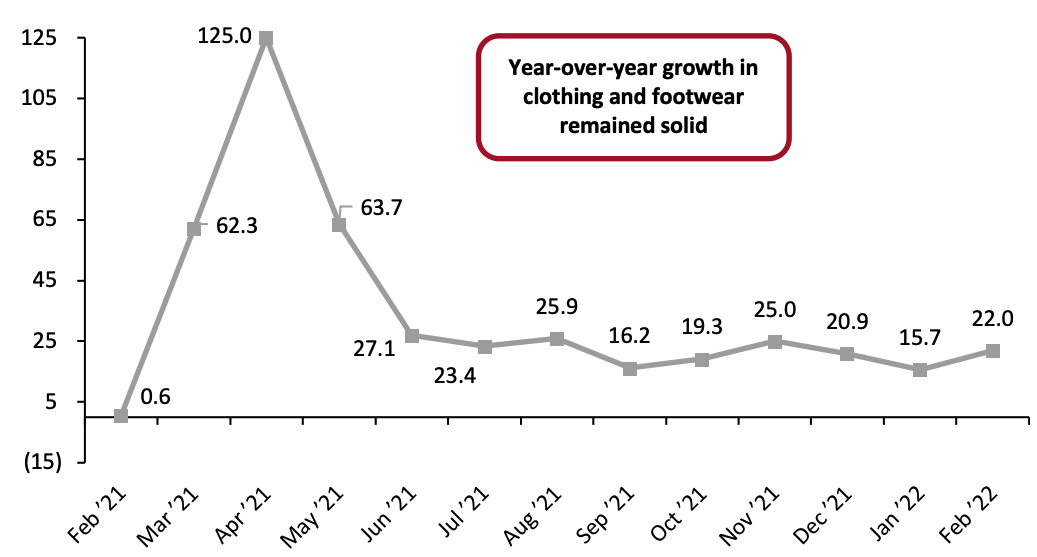
The Coresight Research US Apparel and Beauty Spending Tracker provides a monthly update on the trajectory of consumer spending on beauty, clothing and footwear. The data presented in this report refer to consumer spending through any channel and so differ from retail sales data, which include product category sales by type of retailer. The year-over-year changes that are the focus of this report are inferred from US Bureau of Economic Analysis (BEA) data. Clothing and Footwear Spending Update Consumer spending on clothing and footwear remained solid in February 2022. Shoppers upped their spending by 22.0% year over year, higher than January’s revised 15.7% growth. Although against weak comparatives (0.6% growth on a year-ago basis), February 2022’s growth reflects a very strong recovery in category spending. Apparel and footwear spending recovered strongly amid the pandemic, exceeding pre-pandemic levels from 2019 in every month in 2021. The strong growth momentum has continued in January and February 2022. On a two-year basis, February 2022 growth stood at 22.7% versus 23.5% growth in January 2022.Figure 1. US Consumer Spending on Clothing and Footwear (YoY % Change) [caption id="attachment_144615" align="aligncenter" width="700"]
 Expenditure data are seasonally adjusted
Source: BEA/Coresight Research[/caption] Clothing and Footwear Spending by Subcategory We track four subcategories of clothing and footwear: footwear, children’s and infants’ clothing, men’s and boys’ clothing, and women’s and girls’ clothing. Spending on clothing overall saw a solid year-over-year increase of 22.4% in February, higher than the revised 17.5% growth in January. Figure 2 shows spending on clothing by category type. Category sales growth followed the same growth pattern as clothing overall, with a peak in April 2021, followed by strong growth from May 2021 to January 2022. In February 2022, category sales growth accelerated further.
Figure 2. US Consumer Spending on Clothing by Category (YoY % Change) [wpdatatable id=1856]
Source: BEA/Coresight Research
Spending on footwear increased by 21.8% year over year in February, higher than the 10.9% increase in January.Figure 3. US Consumer Spending on Footwear (YoY % Change) [wpdatatable id=1857]
Source: BEA/Coresight Research
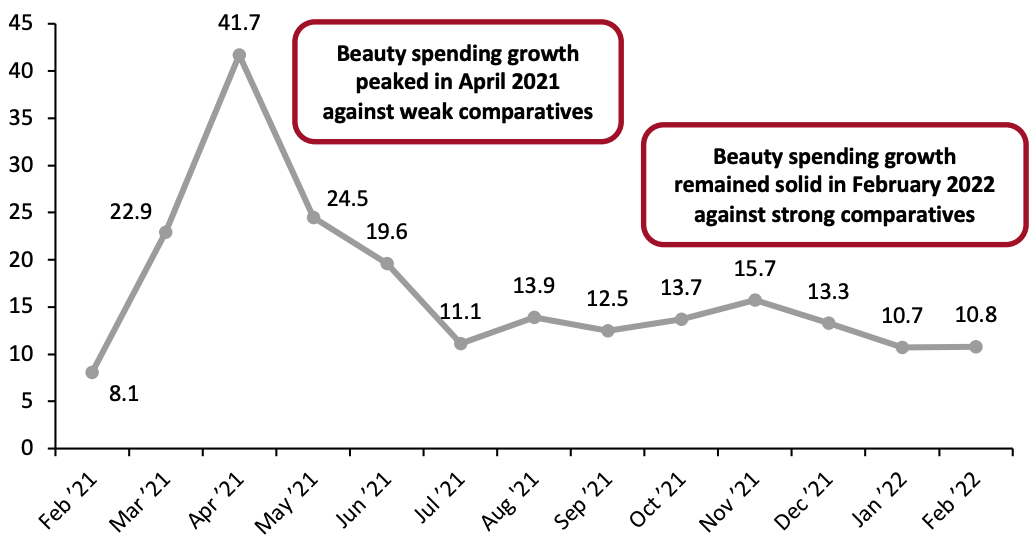
Beauty Spending Update Our tracker follows the US BEA definition of the beauty category, including bath products, cosmetics, nail products and tools, and perfumes. Against strong comparatives, consumer spending on beauty increased by a very solid 10.8% year over year in February, slightly higher than the 10.7% growth seen in January. Spending on beauty recovered quickly amid the pandemic and has seen positive year-over-year growth since July 2020.Figure 4. US Consumer Spending on Selected Beauty Categories (YoY % Change) [caption id="attachment_144619" align="aligncenter" width="700"]
 The beauty category is defined as bath products, cosmetics, nail products and tools, and perfumes
Source: BEA/Coresight Research[/caption]