DIpil Das
US and China Quarterly Economic Update, 4Q21
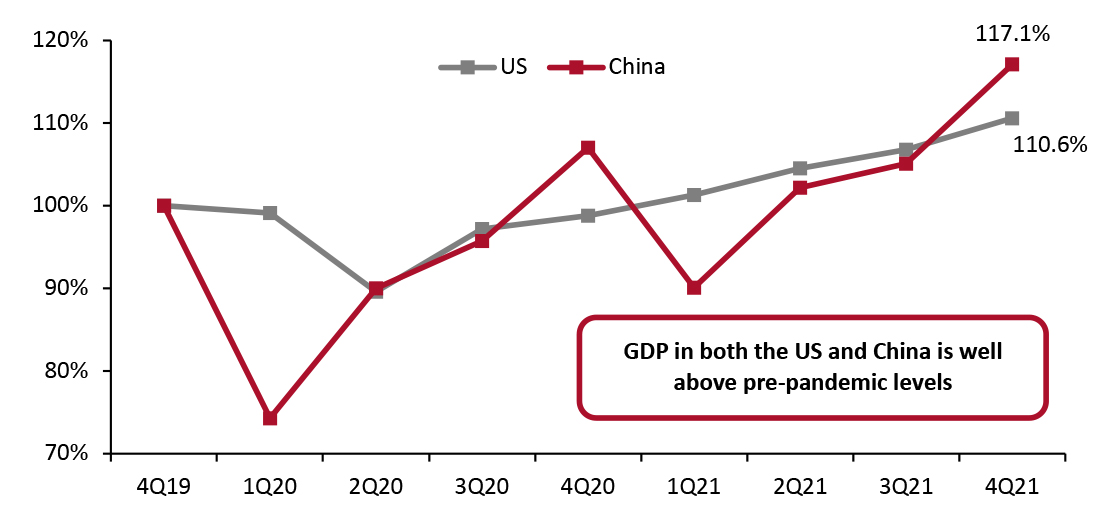
Our Quarterly Economic Update discusses macroeconomic indicators from the US and China, including GDP and industrial production. In this report, we look at recently released data for the fourth quarter of 2021. US GDP Growth Stays Healthy While China’s GDP Growth Continues To Slow The Chinese economy has witnessed a volatile recovery from the pandemic. In the early stages of the pandemic, amid stricter restrictions, the Chinese economy saw a much deeper decline than the US economy. However, from the second quarter of 2020, China’s GDP started recovering quickly, and in the fourth quarter of 2020, Chinese GDP surpassed its value from the final quarter of 2019, which was the last quarter unaffected by the pandemic. In the first quarter of 2021, the Chinese economy slightly declined compared to its pre-pandemic level before recovering solidly in the second quarter. In the third quarter, the Chinese economy posted moderate growth. In the fourth quarter, growth continued to slow albeit remaining at a healthy level. Nevertheless, China’s GDP growth in the first half of 2021 far outpaced growth in the back half of 2021 as economic recovery is losing momentum. Compared to China, the US economy suffered a shallower decline at the beginning of the pandemic and has witnessed a steadier recovery. US GDP surpassed its 2019 final-quarter value later than China’s GDP and had since outpaced China’s GDP recovery up until the third quarter of 2021. As of the fourth quarter of 2021, China’s GDP growth has surpassed US GDP growth, indexed to the fourth quarter of 2019—the last quarter before the pandemic. The figure below illustrates the GDP recoveries of the two countries, indexed to the last quarter of 2019.Figure 1. US and China GDP, Indexed to 4Q19 (Annualized; %) [caption id="attachment_140543" align="aligncenter" width="700"]
 Source: US Bureau of Economic Analysis/National Bureau of Statistics of China[/caption]
US Fourth Quarter Sees Strongest GDP Growth of 2021
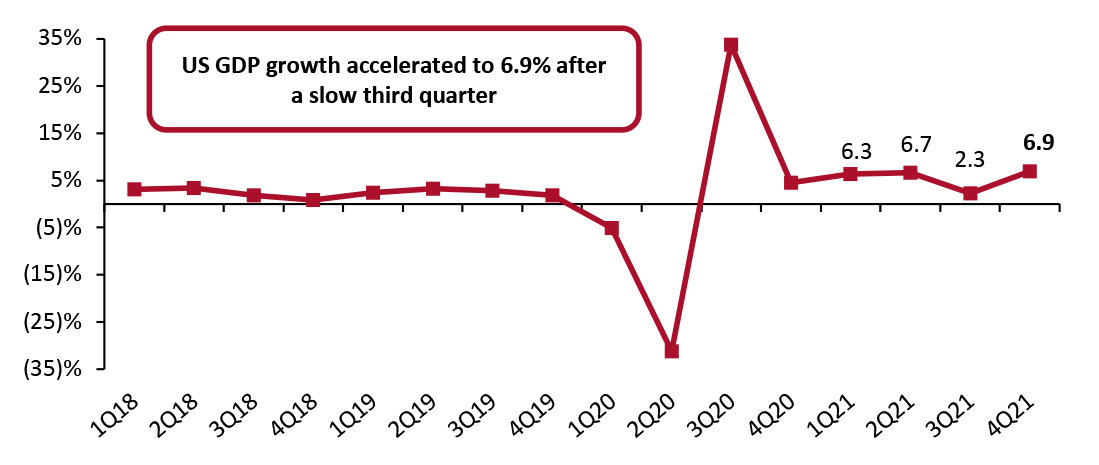
The US economy accelerated at an annual seasonally adjusted rate of 6.9% in the fourth quarter of 2021, according to GDP growth estimates published by the US Bureau of Economic Analysis (BEA) on January 27, 2022. The BEA also revised its advance estimate for GDP growth in the third quarter of 2021 from 2.0% to 2.3%.
The fourth-quarter growth was a strong acceleration from a third-quarter slowdown, which was heavily impacted by the Delta variant. The 6.9% annualized growth rate in the fourth quarter marks the fastest quarter of growth in 2021. GDP growth in the quarter was led by increases in private inventory investment, exports, personal consumption expenditures and nonresidential fixed investment.
Figure 2. US GDP: Change from Preceding Quarter (Annualized; %) [caption id="attachment_140544" align="aligncenter" width="700"]
 Source: US Bureau of Economic Analysis[/caption]
The increase in private inventory investment was led by the retail and wholesale trade industries. Within retail, inventory investment by motor vehicle dealers was the greatest contributor to overall private inventory investment increases. The fourth quarter also saw a widespread increase in exports of goods–leading categories included consumer goods; industrial supplies and materials; and foods, feeds and beverages, according to the BEA.
US Industrial Production Growth Accelerates
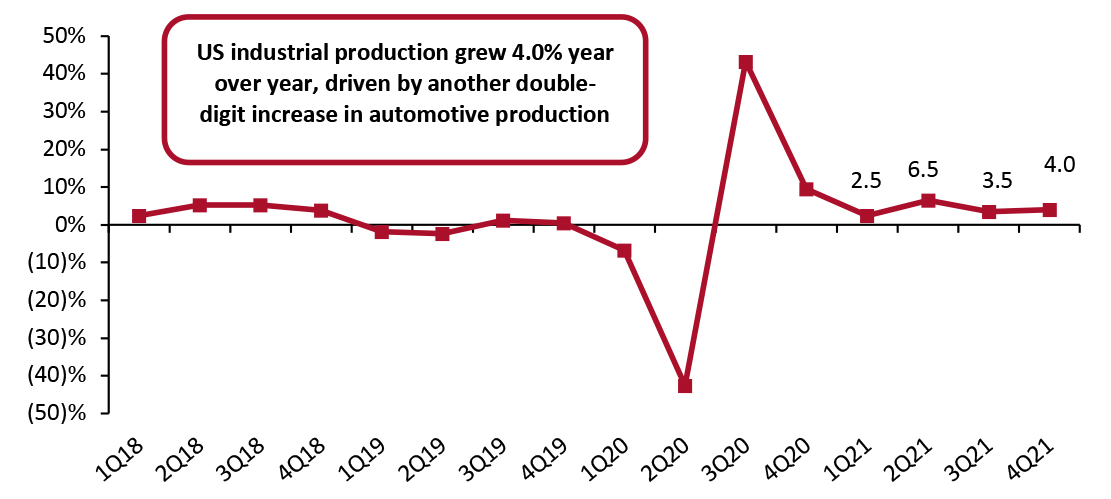
In the fourth quarter of 2021, US industrial production increased by an annualized rate of 4.0%, a slight acceleration from 3.5% revised growth in the third quarter.
The output of consumer goods rose marginally, by just 0.2%, versus a revised increase of 2.0% in the third quarter of 2021 on a seasonally adjusted annualized basis. Durable goods output grew 9.0% while nondurable goods saw production decline by 2.1% year over year. Growth in durable goods production was driven by a 12.2% increase in automotive production: the sector gained speed in the second half of 2021 after seeing double-digit declines in production during the first part of the year. Production growth for non-durable goods was propelled forward by 9.1% growth in paper products while being set back by a 5.0% year-over-year decline in clothing production.
Figure 3. US Industrial Production: Change from Preceding Quarter (Annualized; %) [caption id="attachment_140545" align="aligncenter" width="700"]
 Source: US Federal Reserve[/caption]
Consumer Spending Rises Despite Omicron Variant
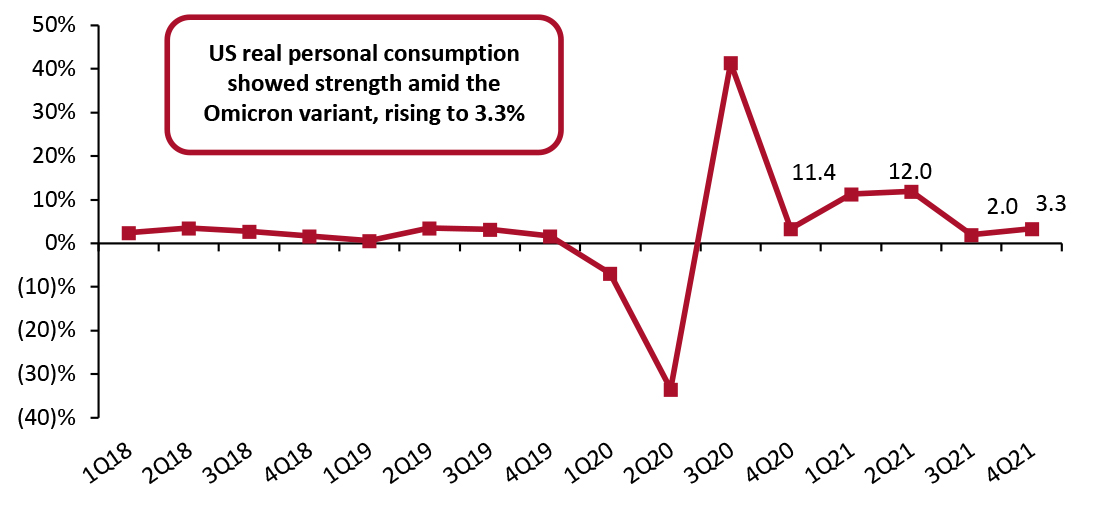
In the fourth quarter, US real personal consumption expenditures (PCE, or consumer spending) rose at an annual rate of 3.3%, a steady increase from the third quarter’s revised 2.0% increase in consumer spending—a stark slowdown amid the spread of the Delta variant. Consumers spent more strongly in the fourth quarter, despite the Omicron variant, than they did in the third quarter.
Overall spending on goods grew marginally, by 0.5% compared to the fourth quarter of 2020. Within goods spending, durable goods spending grew 1.6% at an annualized rate. Meanwhile, nondurable goods spending declined by just 0.1% year over year. Despite a slowdown in spending on services in the fourth quarter due to the Omicron variant, spending remained healthy with 4.7% growth year over year.
Figure 4. US Real-Terms Personal Consumption Expenditures: Change from Preceding Quarter (Annualized; %) [caption id="attachment_140546" align="aligncenter" width="700"]
 Source: US Bureau of Economic Analysis[/caption]
China’s GDP Growth Slows in the Back Half of 2021
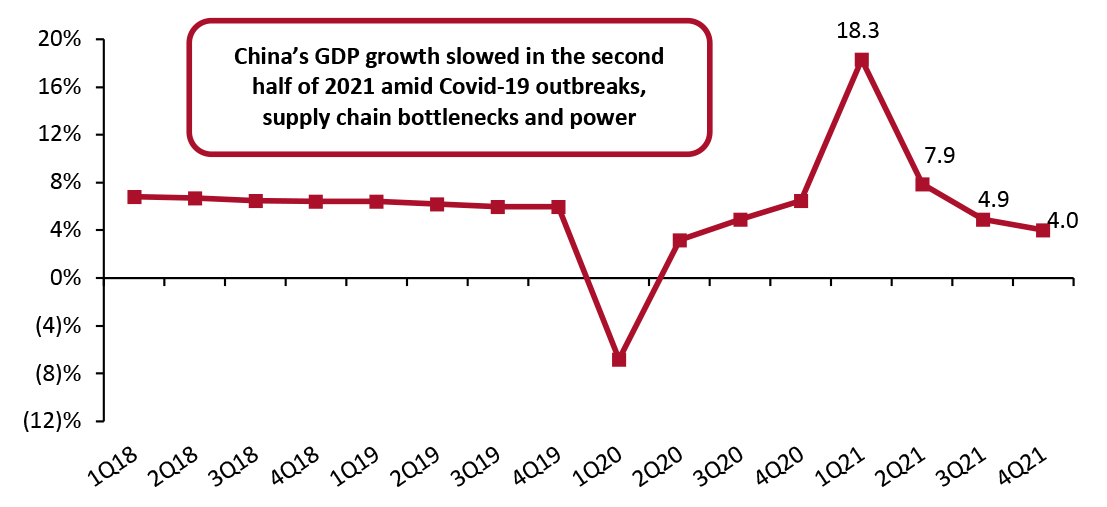
In the fourth quarter of 2021, China’s economy grew 4.0% year over year, a more positive sign for the economy than its low 2.3% retail sales growth in December. However, the government’s zero-tolerance policy to contain Covid-19 outbreaks is still limiting business activity and consumer spending, presenting two headwinds to economic recovery.
Year-over-year, China’s GDP continues to decelerate from the first quarter’s strong double-digit growth. This dip in year-over-year growth was expected: China’s first-quarter 2021 sales growth was much stronger, due to weaker comparatives in 2020. However, its second quarter of 2020 saw positive year-over-year growth, acting as a moderating effect on the growth in the second quarter of 2021. In the third quarter of 2021, China’s GDP continued to see positive growth against strong 2020 comparatives. In the fourth quarter, growth remained healthy at 4.0% although it is continuing to slow. In aggregate, GDP grew 8.1% in 2021 compared to 2020, surpassing the 6% growth the government set out in its latest five-year plan, launched in March 2021.
Figure 5. China GDP: YoY % Change [caption id="attachment_140547" align="aligncenter" width="700"]
 Source: National Bureau of Statistics of China[/caption]
China’s Industrial Production Growth Remains Strong
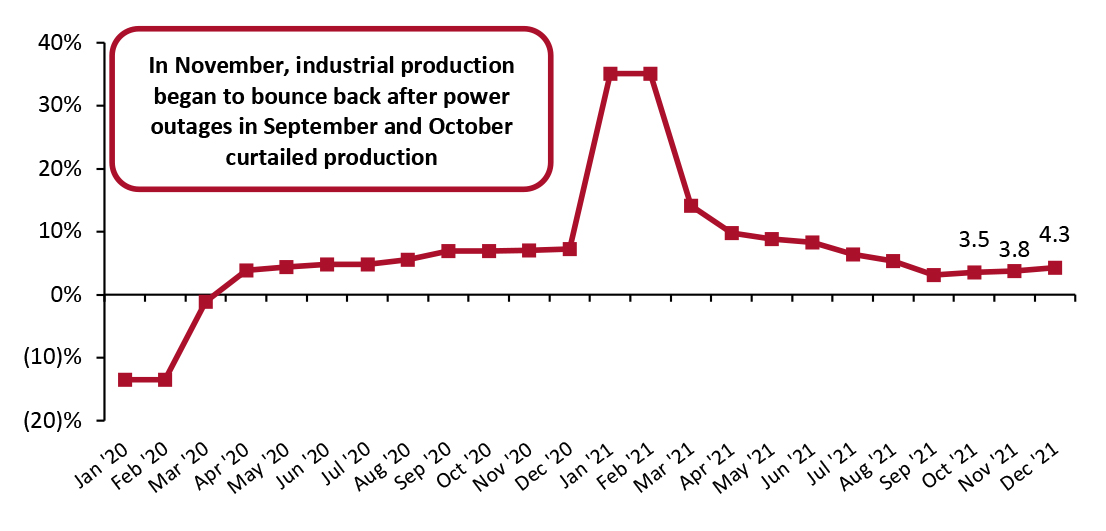
In the fourth quarter, Chinese industrial production grew an average 3.9% year over year against strong 2020 comparatives, versus 4.9 % growth in the third quarter of 2021. All three months in the fourth quarter of 2021 posted low single-digit increases in production, although industrial production appears to be steadily recovering momentum since power outages in September and October caused a slowdown.
Figure 6. China Real-Terms Industrial Production: YoY % Change [caption id="attachment_140548" align="aligncenter" width="700"]
 Source: National Bureau of Statistics of China[/caption]
Accumulated industrial production increased by 9.6% year over year, or by 6.1% on a two-year basis in 2021. Performance varied across the sector, as shown in Figure 7 below.
Figure 7. China Real-Terms Industrial Production by Sector (Accumulated): YoY % Change in 2021 [wpdatatable id=1672 table_view=regular]
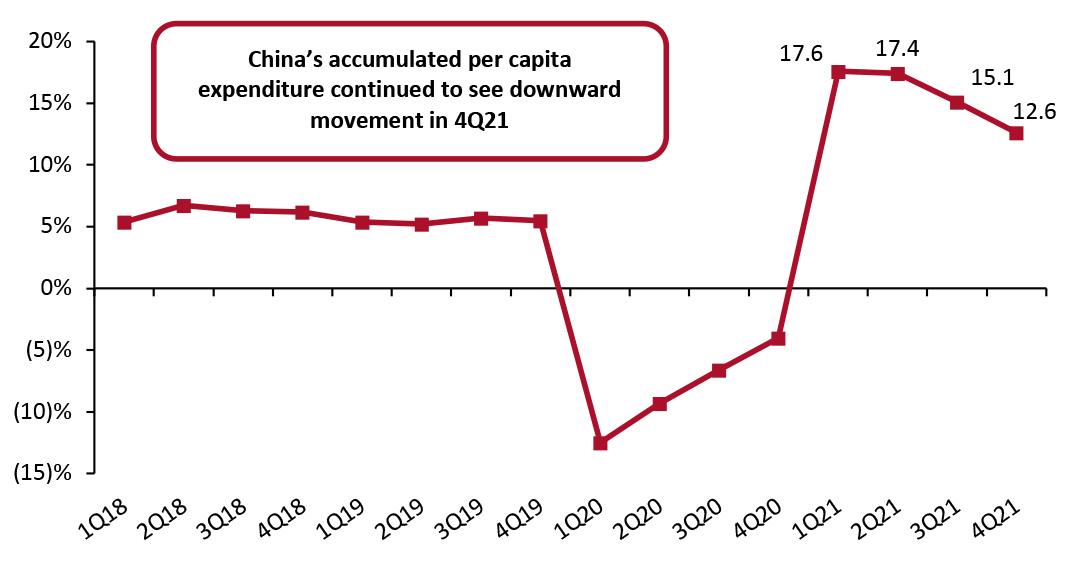
Source: National Bureau of Statistics of China China Real-Terms Per Capita Expenditure Outperforms 2019 and 2020 Levels Per capita expenditure in real terms increased by 12.6% year over year in China in the final quarter of 2021. On a two-year basis, per capita expenditure increased by 11.8%. By region, urban areas saw expenditure growth of 11.1% in the fourth quarter, while expenditure growth in rural areas increased by 15.3%. In the fourth quarter, per capita expenditure on household goods and services increased by 13.0% on the year, accounting for 5.9% of total per capita expenditure growth. Leading the way was consumption of food or beverages, increasing by 12.2% compared to 2020 and accounting for roughly 30% of total per capita expenditure growth. Per capita clothing expenditure increased by 14.9% year over year, accounting for 5.9% of total per capita expenditure growth.
Figure 8. China Real-Terms per Capita Expenditure: YoY % Change (Accumulated) [caption id="attachment_140551" align="aligncenter" width="700"]
 Source: National Bureau of Statistics of China[/caption]
We expect growth to continue to slow in the first quarter of 2022 as the government’s zero-tolerance policy approach to containing Covid-19 outbreaks is restricting travel, business activity and consumer spending.