
albert Chan
The US and China Post Strong Quarterly Growth
The Chinese economy has witnessed a volatile recovery from the pandemic. In the early stages of the pandemic, amid stricter restrictions, the Chinese economy saw a much deeper decline than the US economy. However, from the second quarter of 2020, China’s GDP started recovering quickly, and in the fourth quarter of 2020, Chinese GDP surpassed its value from the final quarter of 2019, which was the last quarter unaffected by the pandemic. In the first quarter of 2021, the Chinese economy slightly declined compared to its pre-pandemic level before recovering solidly in the second quarter. In the third quarter, the Chinese economy posted moderate growth. Although third-quarter growth slowed from the second quarter, GDP remains above pre-pandemic values.
Compared to China, the US economy suffered a shallower decline at the beginning of the pandemic and has witnessed a steadier recovery. US GDP surpassed its 2019 final-quarter value later than China’s GDP but has since outpaced China’s recovery throughout 2021.
The figure below illustrates the GDP recoveries of the two countries, indexed to the last quarter of 2019.
Figure 1. US and China GDP, Indexed to 4Q19 (Annualized; %)
[caption id="attachment_135504" align="aligncenter" width="700"]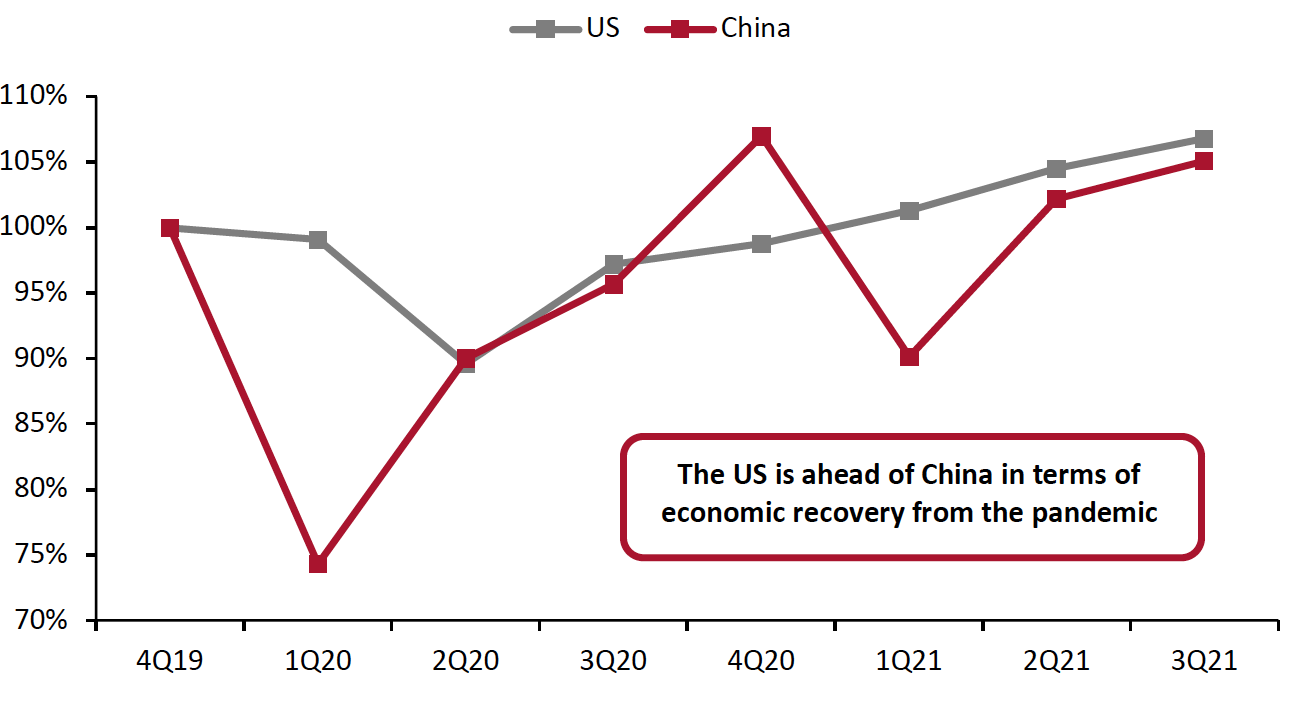 Source: US Bureau of Economic Analysis/National Bureau of Statistics of China[/caption]
US GDP Growth Slows
The US economy accelerated at an annual seasonally adjusted rate of 2.0% in the third quarter of 2021, according to GDP growth estimates published by the US Bureau of Economic Analysis (BEA) on October 28, 2021. The BEA also revised its advance estimate for GDP growth in the second quarter of 2021 from 6.5% to 6.7%. The third-quarter growth was a sharp slowdown from a strong second quarter and is the slowest growth seen in any quarter since the pandemic began. We believe the wearing off of stimulus payments, the elimination of supplemental unemployment benefits, and a surge in Covid-19 Delta cases in late July and August were likely the causes of slow growth in the third quarter.
Figure 2. US GDP: Change from Preceding Quarter (Annualized; %)
[caption id="attachment_135505" align="aligncenter" width="700"]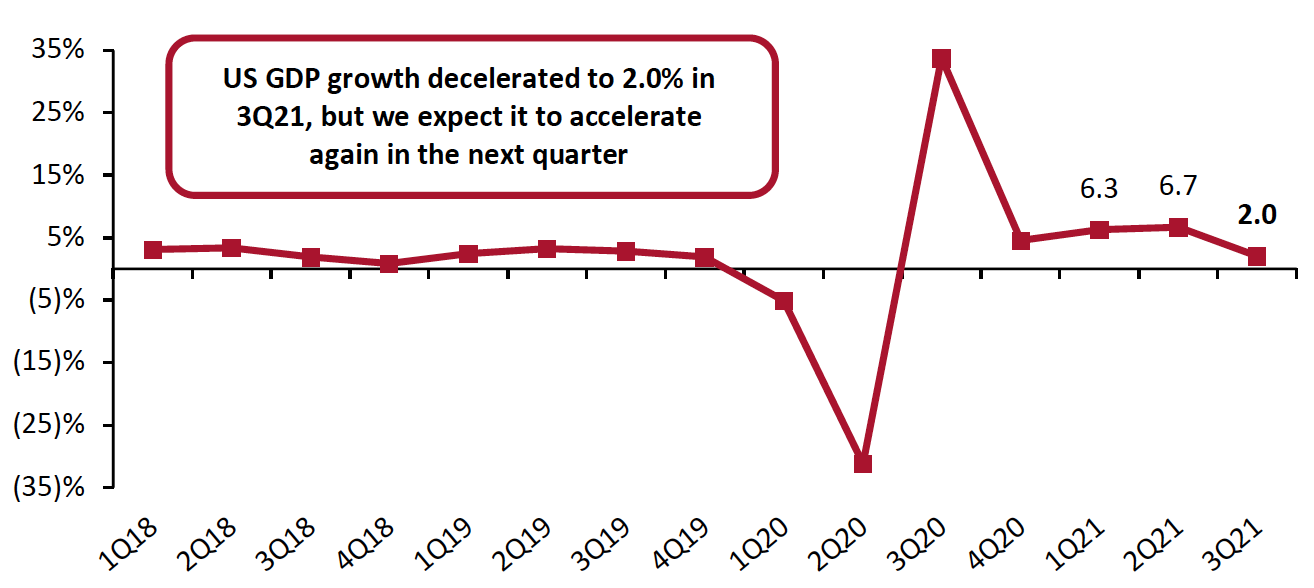 Source: US Bureau of Economic Analysis[/caption]
The third quarter’s slow growth was primarily driven by a fall in consumer spending on goods amid the surge in Covid-19 Delta cases in late July and throughout August. Personal consumption expenditures rose by just 1.6% in the third quarter compared to the 12.0% (revised) consumer expenditure growth in the second quarter. The deceleration of consumer expenditures did result in an 11.7% growth in gross private domestic investment—a catalyst for future economic activity. Growth in government expenditures and investment rose to 0.8% from the second quarter’s (2.0)%.
US Industrial Production Growth Accelerates
In the third quarter of 2021, US industrial production increased by an annualized rate of 4.3%, a slight deceleration from the 5.5% growth in the second quarter.
The output of consumer goods increased by 2.6% in the third quarter of 2021, versus a revised increase of 0.1% in the second quarter of 2021 on a seasonally adjusted annualized basis. Durable goods output grew by 11.4% and nondurable goods grew just 0.3% on a seasonally adjusted annualized basis. Growth in durable goods production was driven by a 15.0% increase in automotive production, after a double-digit decline in the second quarter. Non-durable goods production growth was propelled forward by mid-single-digit growth in clothing and chemical product production.
Figure 3. US Industrial Production: Change from Preceding Quarter (Annualized; %)
[caption id="attachment_135506" align="aligncenter" width="700"]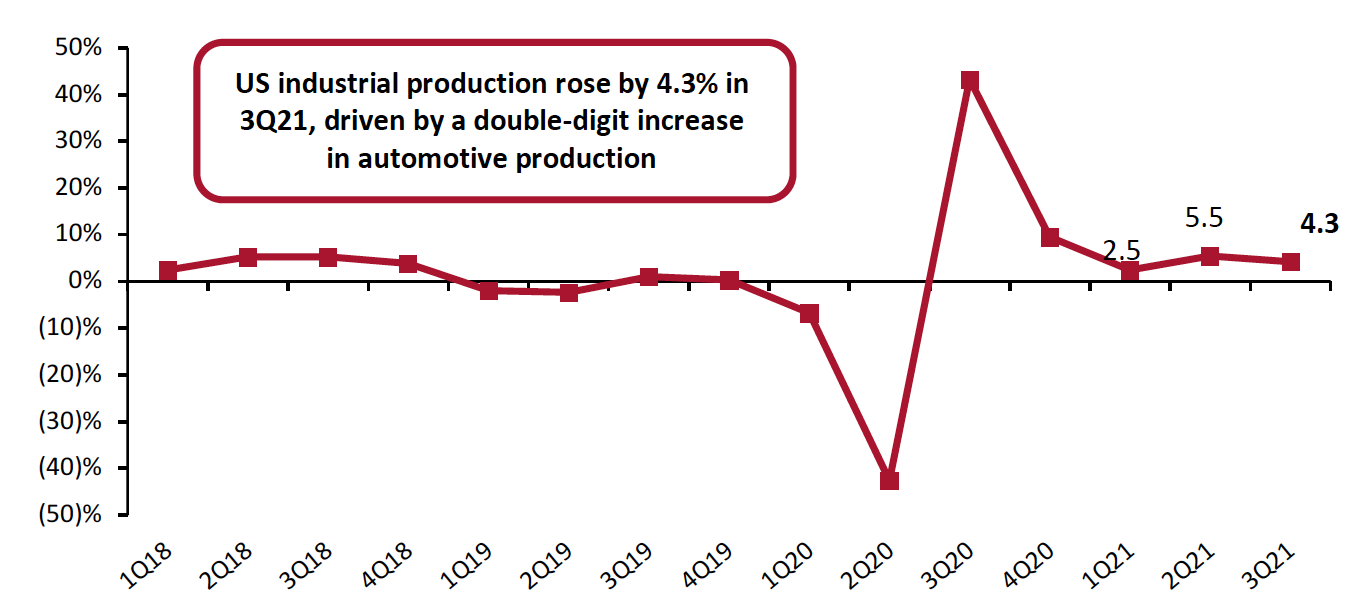 Source: US Federal Reserve[/caption]
Delta Variant Causes Drop-Off in Consumer Spending
In the third quarter, US real personal consumption expenditures (PCE, or consumer spending) rose at an annual rate of 1.6%, a sharp decline from the second quarter’s revised 12.0% increase in consumer spending. A brief surge in Covid-19 Delta cases in late July and throughout August exposed the severity of current supply chain issues and labor shortages, as businesses are currently challenged to meet consumer demand. Consumer spending on goods dropped by 9.2% in the third quarter, while spending on services slowed but remained healthy, growing by 7.9% in the third quarter, slightly down from 11.5% in the second quarter.
Within goods spending, durable goods led overall negative growth as consumers posted a 26.2% decline in durable goods spending. Nondurable goods spending posted a positive 2.6% growth, although this is a significant deceleration from the 13.9% increase in consumer spending on nondurable goods in the second quarter.
Figure 4. US Real-Terms Personal Consumption Expenditures: Change from Preceding Quarter (Annualized; %)
[caption id="attachment_135507" align="aligncenter" width="700"]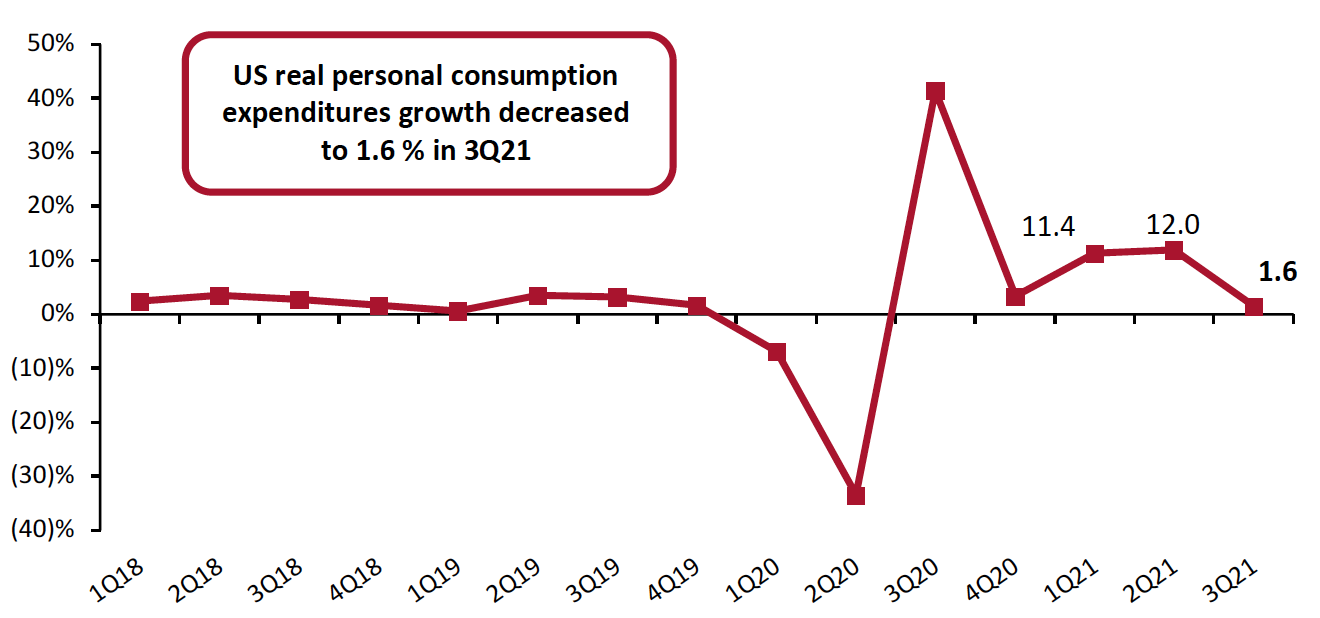 Source: US Bureau of Economic Analysis[/caption]
China Posts Moderate Year-over-Year Growth Amid Supply Chain and Power Shortage Challenges
In the third quarter of 2021, China’s economy grew 4.9% year over year. Despite slightly missing market estimates for 5.2% growth, the third quarter represented the sixth consecutive quarter that the country has experienced positive GDP growth.
Year-over-year, China’s GDP continued to decelerate from the first quarter’s strong double-digit growth. This dip in year-over-year growth was expected: China’s first-quarter 2021 sales growth was much stronger, largely due to weaker comparatives in 2020. However, its second quarter of 2020 saw positive year-over-year growth, acting as a moderating effect on the growth in the second quarter of 2021. In the third quarter of 2021, China’s GDP continued to see positive growth against strong 2020 comparatives. However, growth is slowing amid supply chain challenges, power shortages and a struggling real-estate market. As part of its latest five-year plan, the Chinese government expects year-over-year GDP growth to reach 6% over the course of 2021.
On a quarter-over-quarter basis, China’s GDP growth decelerated to 0.2% in the third quarter of 2021, from 1.3% in the second quarter of 2021.
Figure 5. China GDP: YoY % Change
[caption id="attachment_135508" align="aligncenter" width="700"]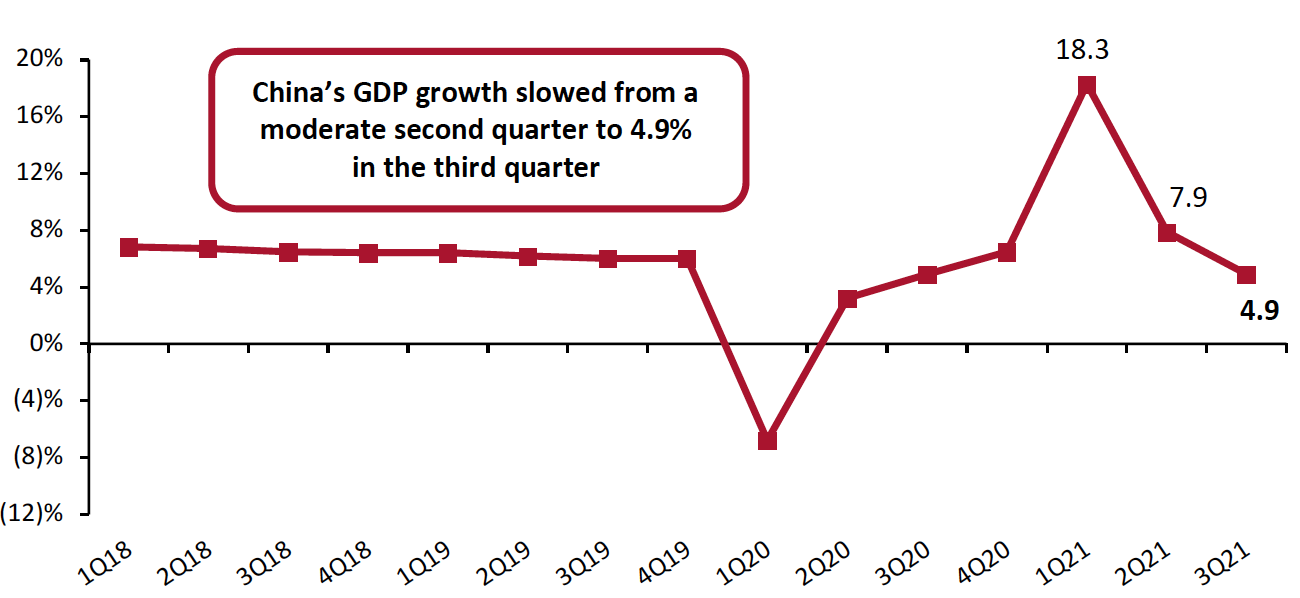 Source: National Bureau of Statistics of China[/caption]
China’s Industrial Production Growth Remains Strong
In the third quarter, Chinese industrial production grew 4.9% year over year against strong 2020 comparatives, versus 8.9 % growth in the second quarter of 2021. All three months in the third quarter of 2021 posted single-digit increases in production. Despite the year-over-year growth in industrial production in the third quarter, production is trending downward month over month amid power shortages affecting factory production.
Figure 6. China Real-Terms Industrial Production: YoY % Change
[caption id="attachment_135509" align="aligncenter" width="700"]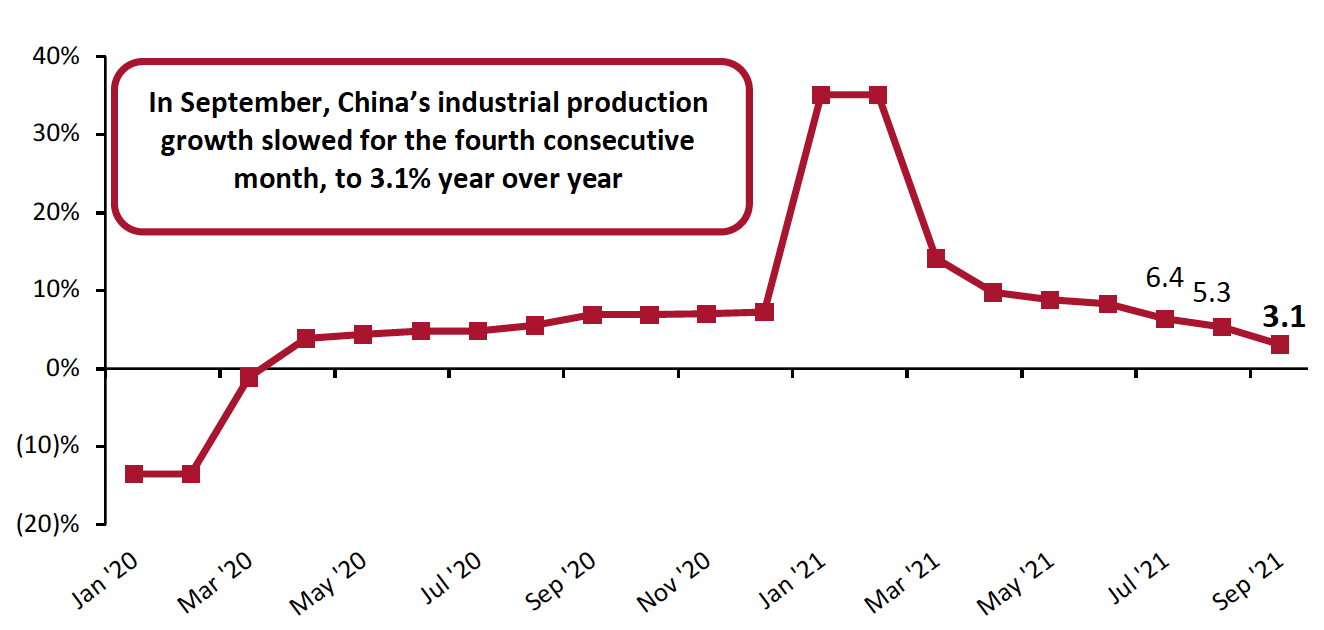 Source: National Bureau of Statistics of China[/caption]
Accumulated (year-to-date) industrial production increased by 11.8% year over year, or by 6.4% on a two-year basis. Performance varied over the sector, as shown in Figure 7 below.
Figure 7. China Real-Terms Industrial Production by Sector (Accumulated): YoY % Change
[caption id="attachment_135510" align="aligncenter" width="700"]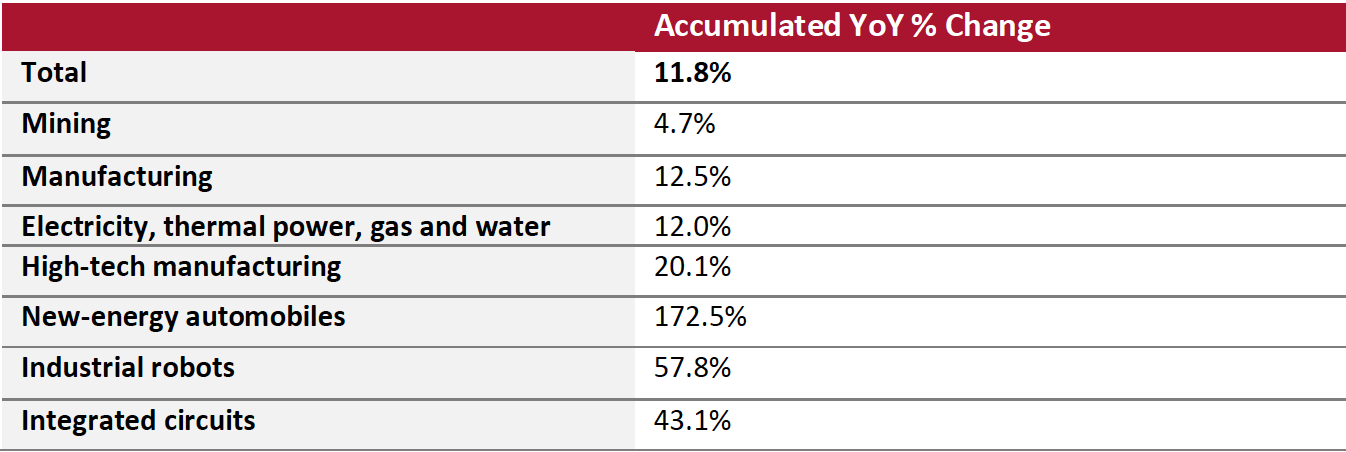 Source: National Bureau of Statistics of China[/caption]
China Real-Terms per Capita Expenditure Far Outpaces 2020 Levels
Accumulated per capita expenditure in real terms increased by 15.1% year over year in China as of the third quarter of 2021, a small downtick from the 17.4% increase as of the second quarter. Rural households increased their spending by 18.1%, outpacing their urban counterparts at 13.4%.
Recovering from a historic plunge in 2020, spending on education, culture and recreation continued to lead the way in the third quarter of 2021, with accumulated spending rising by 46.3% year over year. Similar to the second quarter of 2021, every other category of expenditure, except for spending on residence, also saw double-digit growth, with miscellaneous goods and services seeing the second-strongest growth among the categories at 26.3% and clothing the third-strongest at 18.2%.
Figure 8. China Real-Terms per Capita Expenditure: YoY % Change (Accumulated, January–September)
[caption id="attachment_135511" align="aligncenter" width="700"]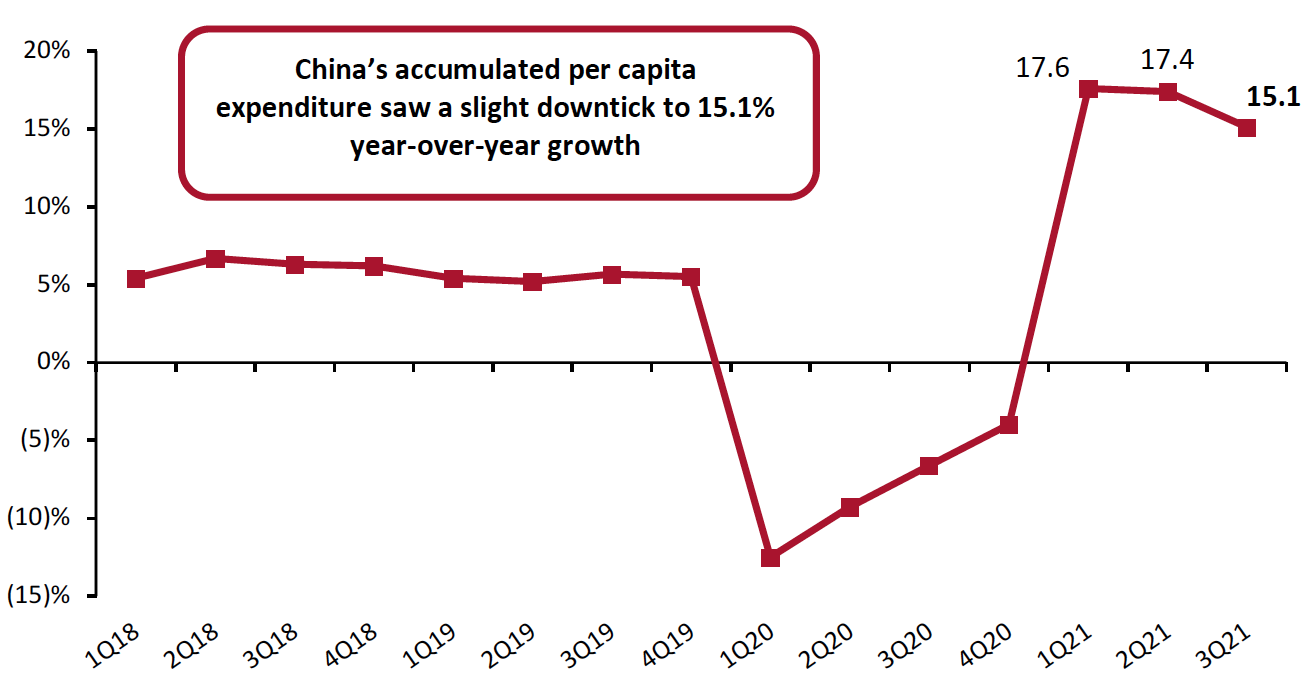 Source: National Bureau of Statistics of China[/caption]
We anticipate fourth-quarter expenditure growth will continue to be modest due to further demanding 2020 comparatives and continued hurdles related to power shortages, supply chain issues and the implementation of the five-year plan. We expect the rises in consumer spending to continue to drive Chinese economic growth over the remainder of the year.