albert Chan
US and China Post Strong Quarterly Growth
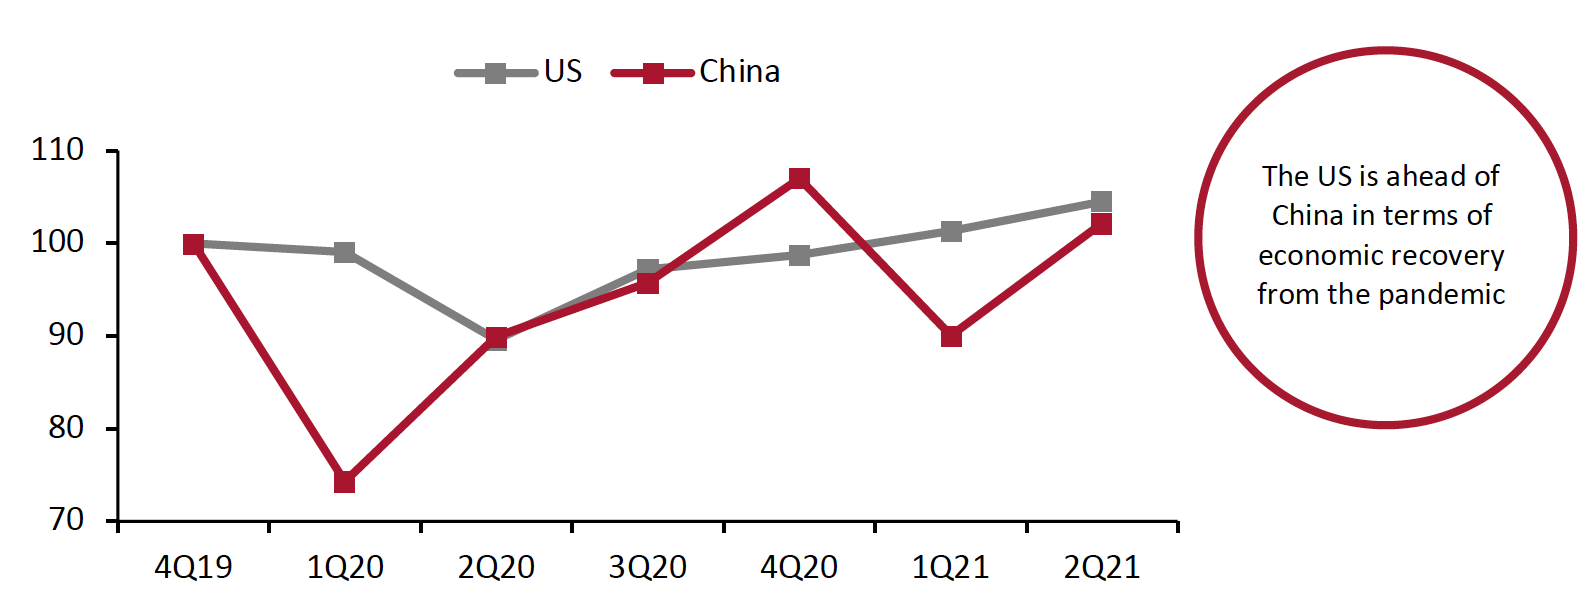
The Chinese economy has witnessed a volatile recovery from the pandemic. In the early stages of the pandemic, amid stricter restrictions, the Chinese economy saw a much deeper decline than the US economy. However, from the second quarter of 2020, China’s GDP started recovering quickly, and in the fourth quarter of 2020, Chinese GDP surpassed its value from the final quarter of 2019, which was the last quarter unaffected by the pandemic. In the first quarter of 2021, the Chinese economy slightly declined compared to its pre-pandemic level before recovering solidly in the second quarter.
As compared to China, the US economy suffered a shallow decline at the beginning of the pandemic and has witnessed a steadier recovery. US GDP surpassed its 2019 final-quarter value later, but outpaced China’s recovery in both the first two quarters of 2021.
The figure below illustrates the GDP recoveries of the two countries, indexed to the last quarter of 2019.
Figure 1. US and China GDP, Indexed to 4Q19 (Annualized; %) [caption id="attachment_130829" align="aligncenter" width="700"]
 Source: US Bureau of Economic Analysis/National Bureau of Statistics of China[/caption]
US GDP Growth Accelerates
The US economy accelerated at an annual seasonally adjusted rate of 6.5% for the second quarter of 2021, according to GDP growth estimates published by the US Bureau of Economic Analysis (BEA) on July 29, 2021. The BEA also revised its advance estimate for GDP growth in the first quarter of 2021 from 6.4% to 6.3%. The second-quarter growth outpaced the prior quarter’s growth, but narrowly missed consensus estimates of 8.0%. We believe the $1.9 trillion Covid-19 economic relief bill signed by President Joe Biden in mid-March—which includes measures such as direct payments of up to $1,400 to most Americans, $300 per week unemployment insurance and an expansion of child tax credit—likely helped support total GDP growth in the second quarter of 2021.
Figure 2. US GDP: Change from Preceding Quarter (Annualized; %)
[caption id="attachment_130836" align="aligncenter" width="700"]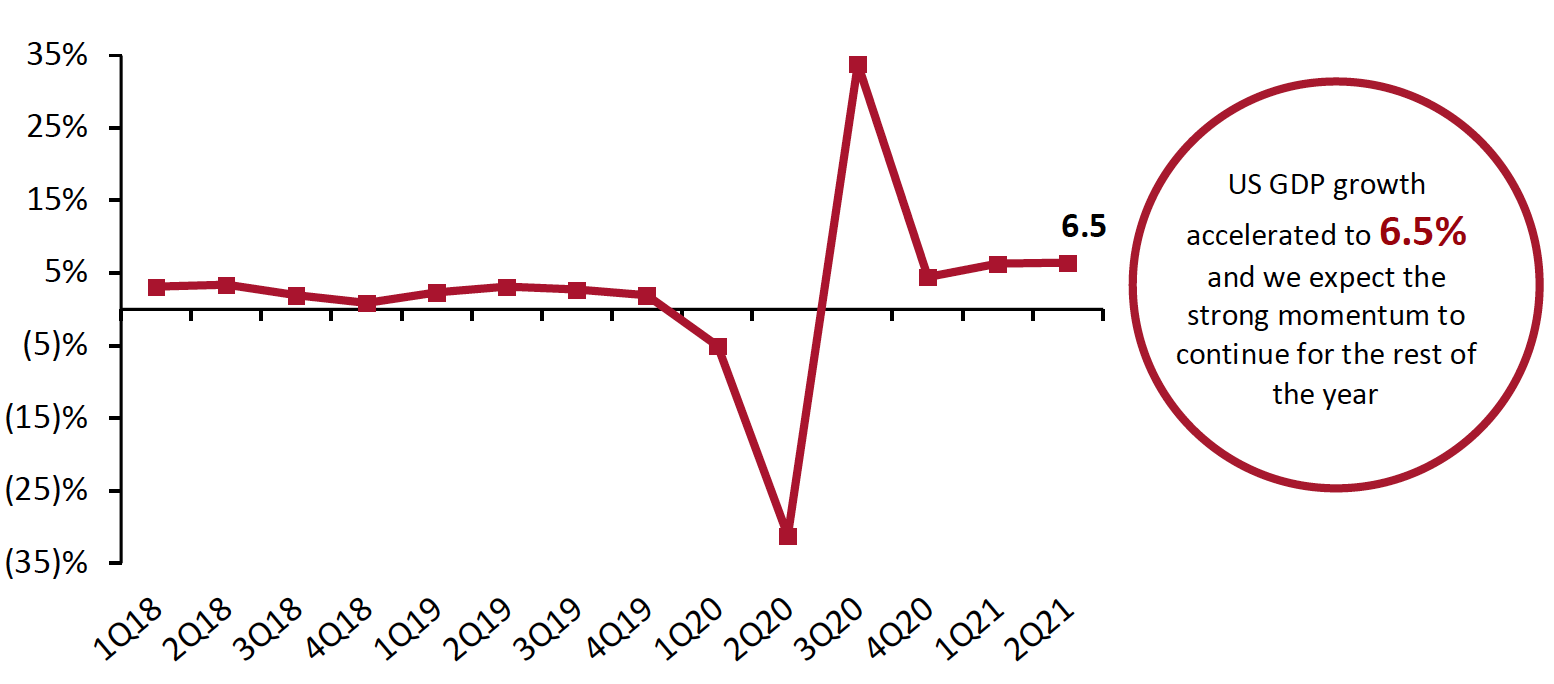 Source: US Bureau of Economic Analysis[/caption]
The second quarter’s growth was primarily driven by a rise in consumer spending as Americans, many now vaccinated against Covid-19, returned to bars, entertainment venues, hotels, restaurants, sports events and vacations. Personal consumption expenditures rose by 11.8%, making up for a 3.5% drop in private domestic investment—a catalyst of economic productivity. Government expenditures and investment fell by 1.5%, while net exports declined by 0.4%.
US Industrial Production Growth Accelerates
In the second quarter of 2021, US industrial production increased by an annualized rate of 5.5%, accelerating from 2.5% growth in the first quarter of 2021.
The output of consumer goods decreased by 0.2% in the second quarter of 2021, versus a revised 3.2% increase in the first quarter of 2021 on a seasonally adjusted annualized basis. Durable goods output fell by 9.8% and nondurable goods production grew 2.7% on a seasonally adjusted annualized basis. Growth in nondurable goods production was driven by high-single-digit increases in the outputs of clothing and chemical products, while durable goods production growth was held back by a double-digit decline in automotive production.
Figure 3. US Industrial Production: Change from Preceding Quarter (Annualized; %)
[caption id="attachment_130831" align="aligncenter" width="700"]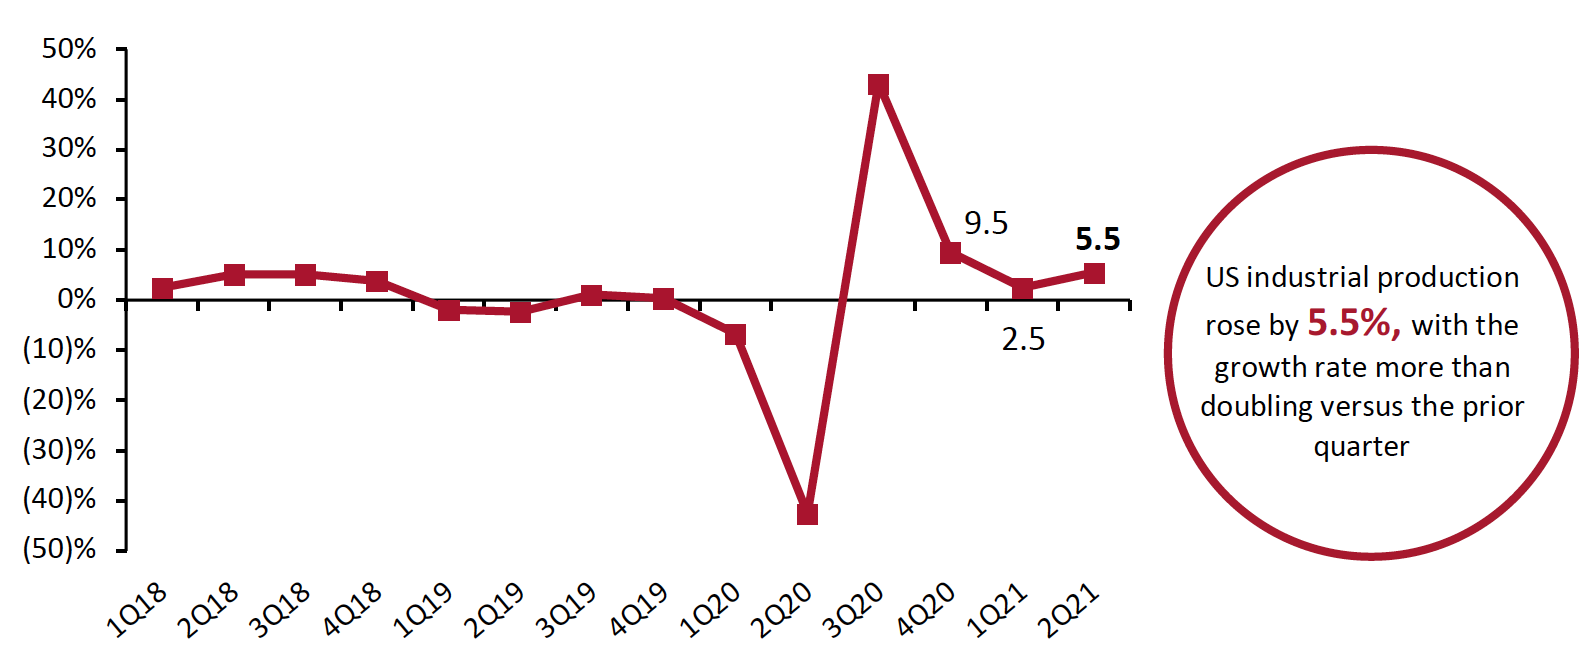 Source: US Federal Reserve[/caption]
Easing of Restrictions Drives a Rise in US Personal Consumption Expenditures
Driven by easing Covid-19 restrictions, US real personal consumption expenditures (PCE, or consumer spending) rose at an annual rate of 11.8% in the second quarter of 2021, following an 11.3% revised rise in the first quarter of 2021. While both goods and services spending grew at strong double-digit rates, consumer spending shifted back toward services as restrictions on activities eased: Goods spending rose by 11.6%, down from 27.4% growth in the previous quarter, while services spending rose by 12.0%, up from 3.9% growth in the first quarter of 2021.
Within goods spending, nondurable goods posted stronger growth than durable goods: Nondurable goods spending grew 12.6%, versus 15.9% growth in the prior quarter, while durable goods spending rose by 9.9% versus 50.0% growth in the prior quarter.
Figure 4. US Real-Terms Personal Consumption Expenditures: Change from Preceding Quarter (Annualized; %)
[caption id="attachment_130832" align="aligncenter" width="700"]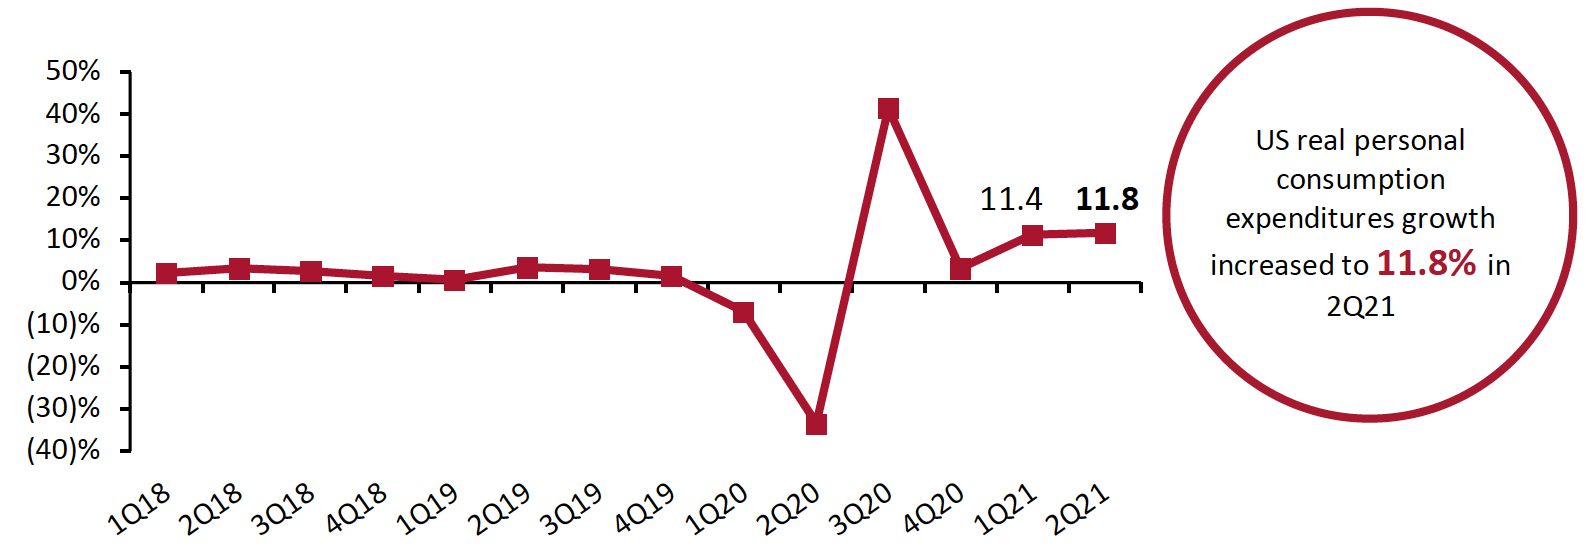 Source: US Bureau of Economic Analysis[/caption]
China’s Year-over-Year GDP Growth Slows Against Strong Comparatives, but Sequential Growth Accelerates
In the second quarter of 2021, China’s economy grew 7.9% year over year, representing the fifth consecutive quarter that the country has experienced positive GDP growth—largely in line with consensus expectations of an 8.1% increase.
Year-over-year growth decelerated sharply from double-digit growth seen in the previous quarter. This dip in year-over-year growth was expected: China’s first-quarter 2021 sales growth was much stronger, largely due to weak comparatives in 2020. However, its second quarter of 2020 saw positive year-over-year growth, acting as a moderating effect on the growth in the second quarter of 2021. As part of its latest five-year plan, the Chinese government expects year-over-year GDP growth to reach 6% over the course of 2021.
On a quarter-over-quarter basis, China’s GDP growth accelerated to 1.3% in the second quarter of 2021, from 0.4% in the first quarter of 2021.
Figure 5. China GDP: YoY % Change
[caption id="attachment_130833" align="aligncenter" width="700"]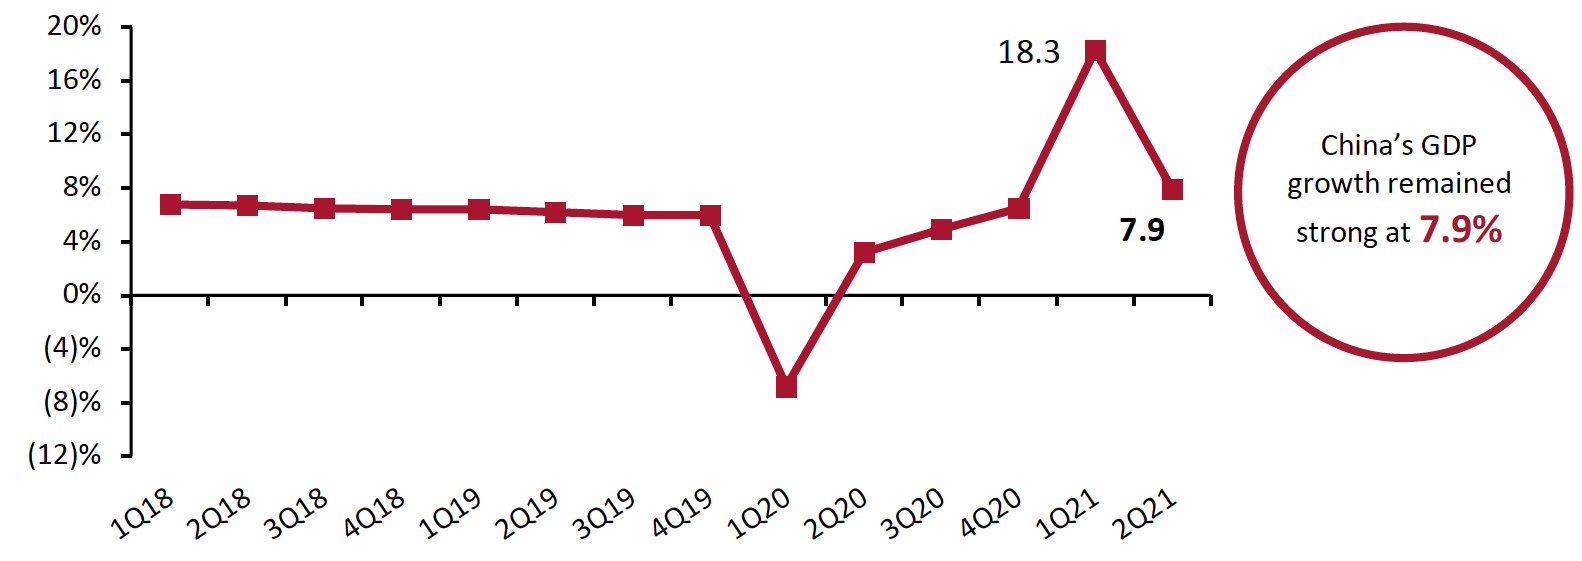 Source: National Bureau of Statistics of China[/caption]
China’s Industrial Production Growth Remains Strong
In the second quarter, Chinese industrial production grew 8.9% year over year against strong 2020 comparatives, versus 24.5% growth in the first quarter of 2021 (inflated by very weak 2020 comparatives). All three months in the second quarter of 2021 reported high-single-digit increases in industrial production.
Figure 6. China Real-Terms Industrial Production: YoY % Change
[caption id="attachment_130834" align="aligncenter" width="700"]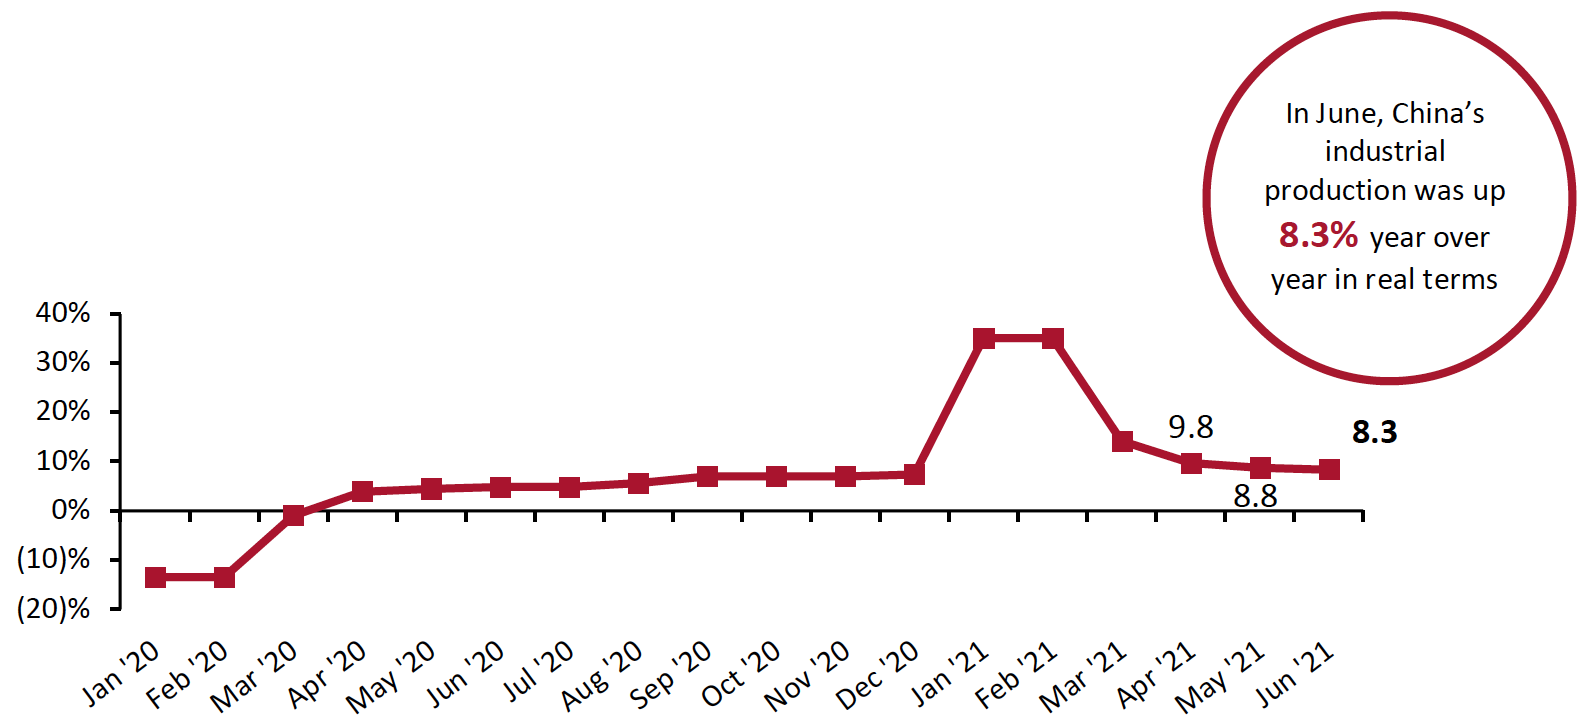 Source: National Bureau of Statistics of China[/caption]
Accumulated industrial production increased by 15.9% year over year, or by 7.0% on a two-year basis. The performance varied over the sector, as shown in Figure 7 below:
Figure 7. China Real-Terms Industrial Production by Sector (Accumulated): YoY % Change and Two-Year % Change
[caption id="attachment_130835" align="aligncenter" width="700"]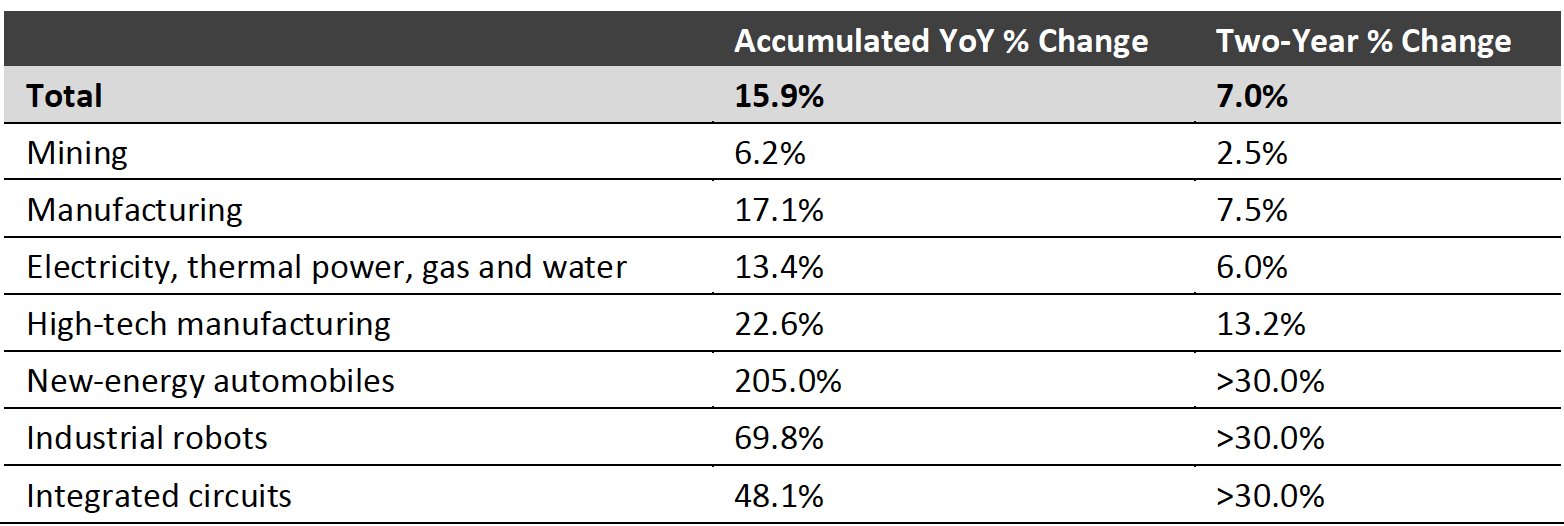 Source: National Bureau of Statistics of China[/caption]
China Real-Terms per Capita Expenditure Far Outpaces 2020 Levels
Accumulated per capita expenditure in real terms increased by 17.4% year over year in China in the first half of 2021. Rural households boosted their spending by 19.7%, slightly more than their urban counterparts, at 16.0%. On a two-year basis, the total increase was 11.0%.
Recovering from a historic plunge in 2020, education, culture and recreation spending saw the sharpest increase in the first half of 2021, with accumulated spending rising by 68.5% year over year. Every other category of expenditure, except for spending on residence, also saw double-digit growth, with miscellaneous goods and services seeing the second strongest growth among the categories at 33.0%, and clothing recording the third strongest at 21.4%.
In 2020, real-terms year-over-year growth in per capita expenditure was (12.5)% in 1Q and (9.3)% in 2Q.
We anticipate that third-quarter expenditure growth will be more modest due to more demanding 2020 comparatives—but we expect to see strong growth nevertheless given per capita expenditure growth was (6.6)% in the third quarter of 2020. We expect the rises in consumer spending to continue to drive Chinese economic growth over the remainder of the year.
Source: National Bureau of Statistics of China[/caption]
China Real-Terms per Capita Expenditure Far Outpaces 2020 Levels
Accumulated per capita expenditure in real terms increased by 17.4% year over year in China in the first half of 2021. Rural households boosted their spending by 19.7%, slightly more than their urban counterparts, at 16.0%. On a two-year basis, the total increase was 11.0%.
Recovering from a historic plunge in 2020, education, culture and recreation spending saw the sharpest increase in the first half of 2021, with accumulated spending rising by 68.5% year over year. Every other category of expenditure, except for spending on residence, also saw double-digit growth, with miscellaneous goods and services seeing the second strongest growth among the categories at 33.0%, and clothing recording the third strongest at 21.4%.
In 2020, real-terms year-over-year growth in per capita expenditure was (12.5)% in 1Q and (9.3)% in 2Q.
We anticipate that third-quarter expenditure growth will be more modest due to more demanding 2020 comparatives—but we expect to see strong growth nevertheless given per capita expenditure growth was (6.6)% in the third quarter of 2020. We expect the rises in consumer spending to continue to drive Chinese economic growth over the remainder of the year.