DIpil Das
US GDP Slumps at Record Rate amid Covid-19
On July 30, 2020, the US Bureau of Economic Analysis (BEA) published its advance estimate of GDP growth, estimating that the US economy nosedived at an annual seasonally adjusted rate of 32.9% in the second quarter of 2020, impacted by coronavirus-induced shutdowns. This is slightly better than market consensus of 34.7% reduction but is the greatest decline ever recorded.
The GDP collapse in the second quarter was dragged down by personal consumption expenditures, residential fixed investment, nonresidential fixed investment, exports, state and local government spending, and private inventory investment. These were partially offset by positive contributions from federal government spending. The BEA noted that the full economic effects of the coronavirus cannot be quantified in the second-quarter GDP estimate, which is based on source data that are incomplete and subject to updates.
While deep, the quarterly nature of these data mean they are blunt and not representative of current, or even recent, circumstances—the second quarter ranged from total lockdown to an economic reawakening. Retail sales—the best short-term indicator of the consumer spending that drives the US economy—saw a V-shaped bounce back in June, for example. Looking ahead, the US economy is poised for a gradual recovery in the next quarter as lockdown restrictions have now eased and businesses have begun to reopen. According to the CNBC/Moody’s Analytics poll of economists, the average forecast of third-quarter GDP is quarter-over-quarter annualized growth of 16.4%. However, the forecast could be threatened by a possible resurgence of the coronavirus and consequent state reopening rollbacks.
[caption id="attachment_114171" align="aligncenter" width="700"]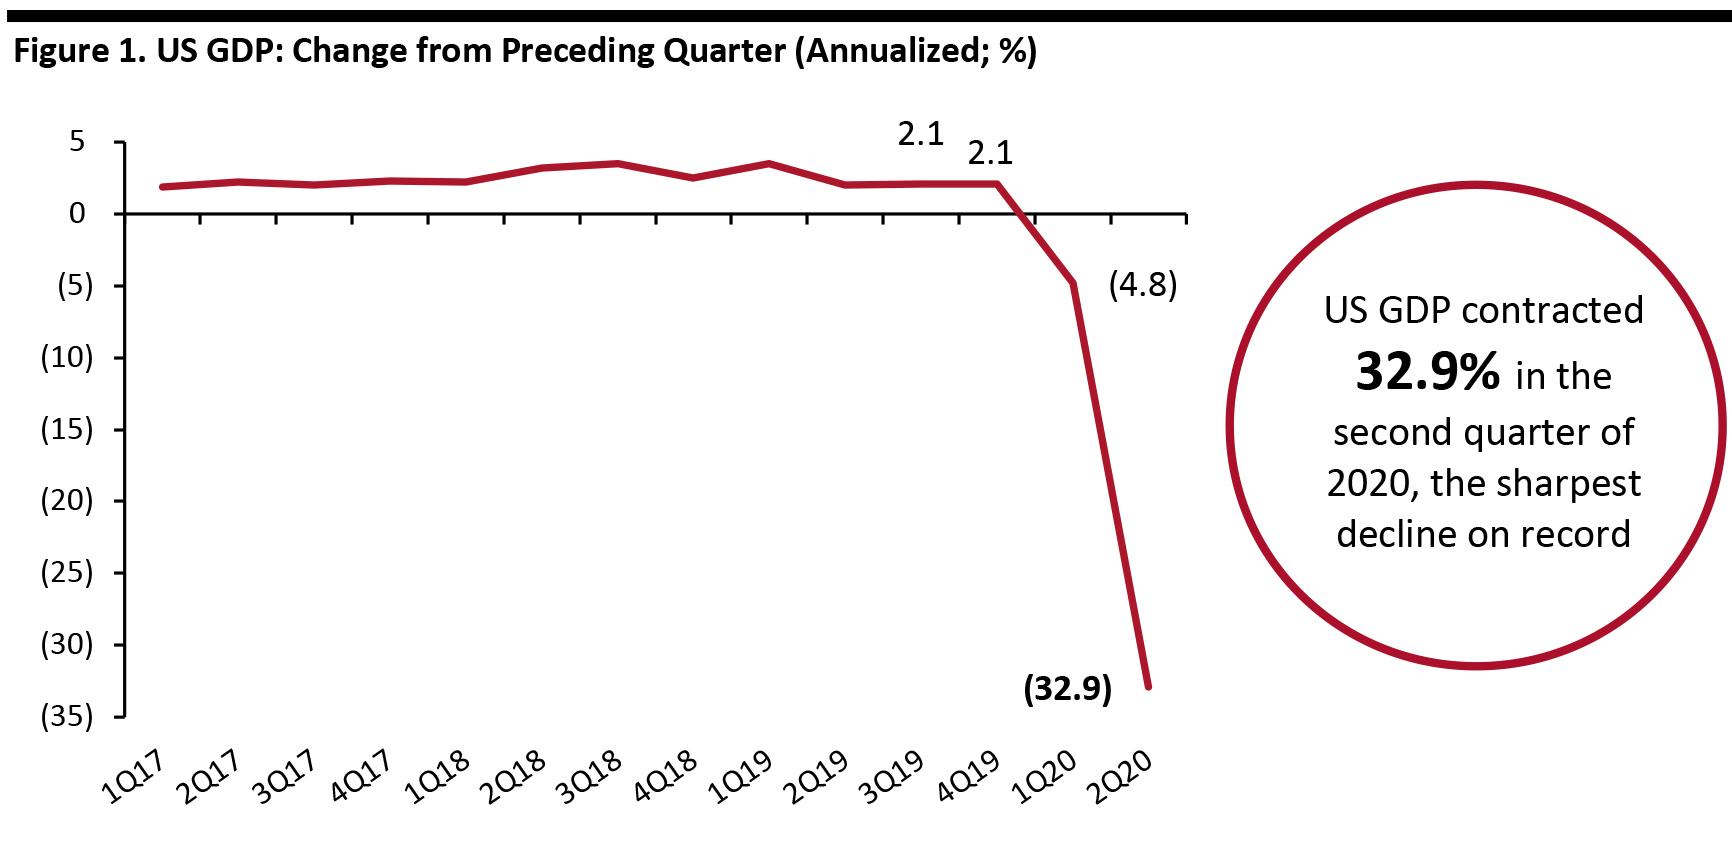 Source: BEA[/caption]
US Industrial Production Declines Steeply in the Second Quarter
US industrial production plummeted 42.6% in the second quarter, the largest quarterly decline since the end of World War II. US factories saw a rebound in May and June, but the uptick could not overcome April’s record decline.
The output of consumer goods dropped by 37.6% in the quarter, within which durable goods collapsed 77.9% while durable goods fell 19.7%. Clothing saw the largest decrease of 57.4% within durable goods in the quarter, while foods and tobacco declined by 28.4%.
[caption id="attachment_114172" align="aligncenter" width="700"]
Source: BEA[/caption]
US Industrial Production Declines Steeply in the Second Quarter
US industrial production plummeted 42.6% in the second quarter, the largest quarterly decline since the end of World War II. US factories saw a rebound in May and June, but the uptick could not overcome April’s record decline.
The output of consumer goods dropped by 37.6% in the quarter, within which durable goods collapsed 77.9% while durable goods fell 19.7%. Clothing saw the largest decrease of 57.4% within durable goods in the quarter, while foods and tobacco declined by 28.4%.
[caption id="attachment_114172" align="aligncenter" width="700"]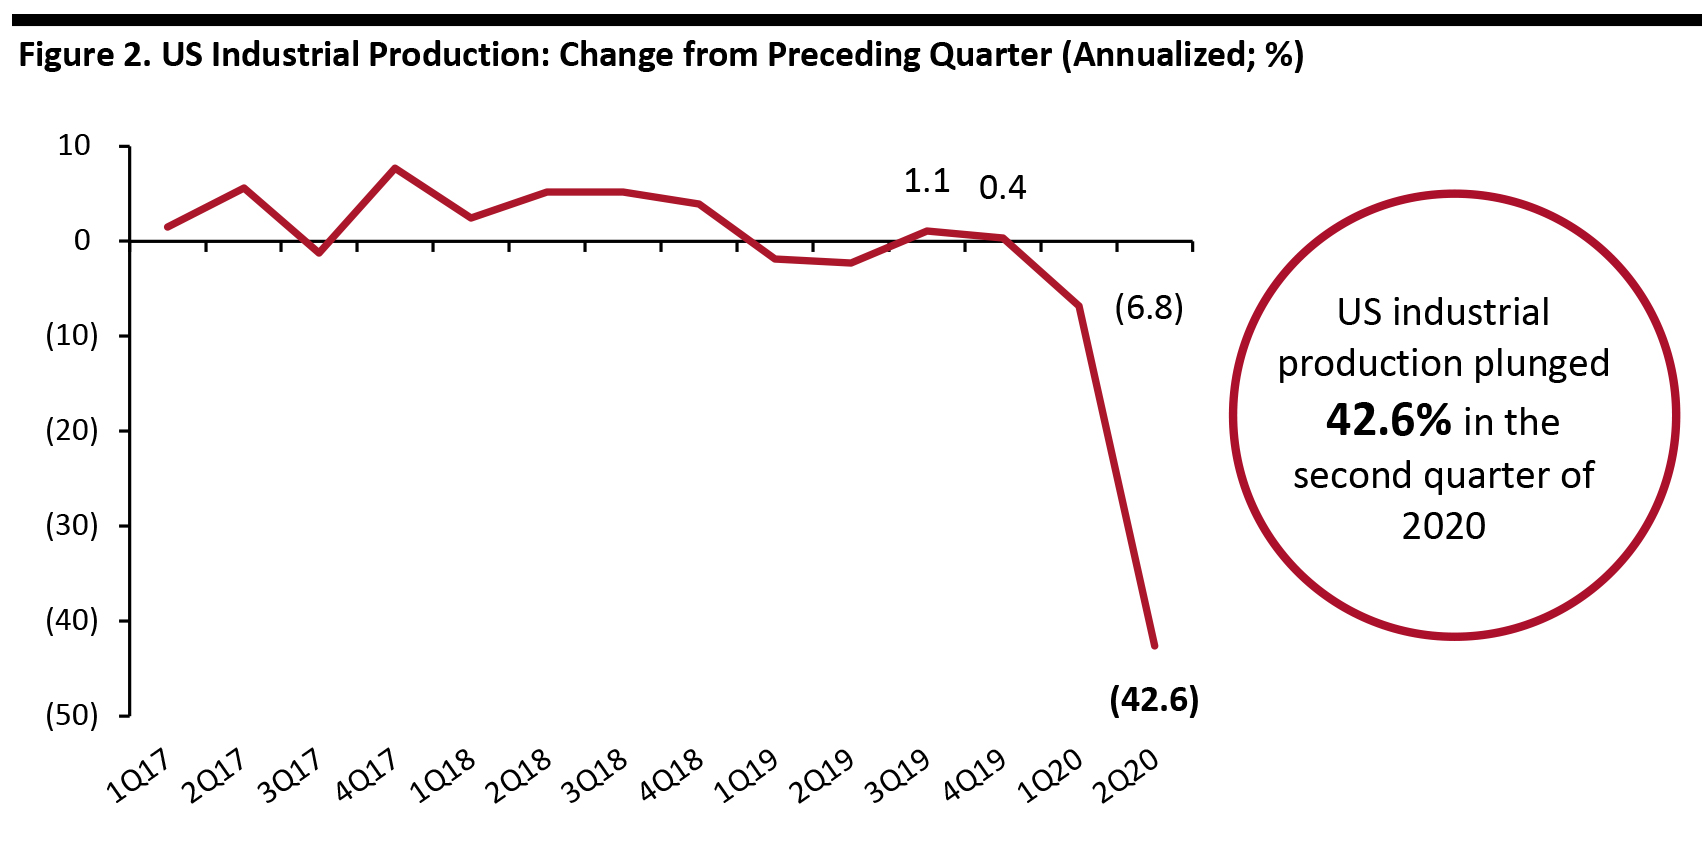 Source: US Federal Reserve[/caption]
Personal Consumption Expenditure Drops Sharply in the Second Quarter
US real personal consumption expenditures (PCE, or consumer spending) tumbled sharply at an annual rate of 34.6% during the second quarter of 2020, following the drop of 6.9% in the previous quarter.
As with GDP, the quarterly metric makes for a blunt metric that conceals highly volatile numbers. In June, real PCE increased by 5.2% month over month, while disposable personal income (DPI, income after paying tax and other deductions) decreased by 1.8%. The decrease in real DPI in June can be attributed to a decrease in government social benefits as payments made to individuals in response to the Covid-19, partially offset by increases in compensation, proprietors’ income and unemployment insurance benefits.
The growth in real PCE in June was a result of a month-over-month increase of $273.7 billion (a 5.7% increase) in spending on services and an expansion of $362.1 billion (a 5.0% increase) in spending on goods. Within services, the leading contributors of growth was spending on health care, as well as on food services and accommodation. The spending on goods was driven by a month-over-month recovery in clothing and footwear.
[caption id="attachment_114173" align="aligncenter" width="700"]
Source: US Federal Reserve[/caption]
Personal Consumption Expenditure Drops Sharply in the Second Quarter
US real personal consumption expenditures (PCE, or consumer spending) tumbled sharply at an annual rate of 34.6% during the second quarter of 2020, following the drop of 6.9% in the previous quarter.
As with GDP, the quarterly metric makes for a blunt metric that conceals highly volatile numbers. In June, real PCE increased by 5.2% month over month, while disposable personal income (DPI, income after paying tax and other deductions) decreased by 1.8%. The decrease in real DPI in June can be attributed to a decrease in government social benefits as payments made to individuals in response to the Covid-19, partially offset by increases in compensation, proprietors’ income and unemployment insurance benefits.
The growth in real PCE in June was a result of a month-over-month increase of $273.7 billion (a 5.7% increase) in spending on services and an expansion of $362.1 billion (a 5.0% increase) in spending on goods. Within services, the leading contributors of growth was spending on health care, as well as on food services and accommodation. The spending on goods was driven by a month-over-month recovery in clothing and footwear.
[caption id="attachment_114173" align="aligncenter" width="700"]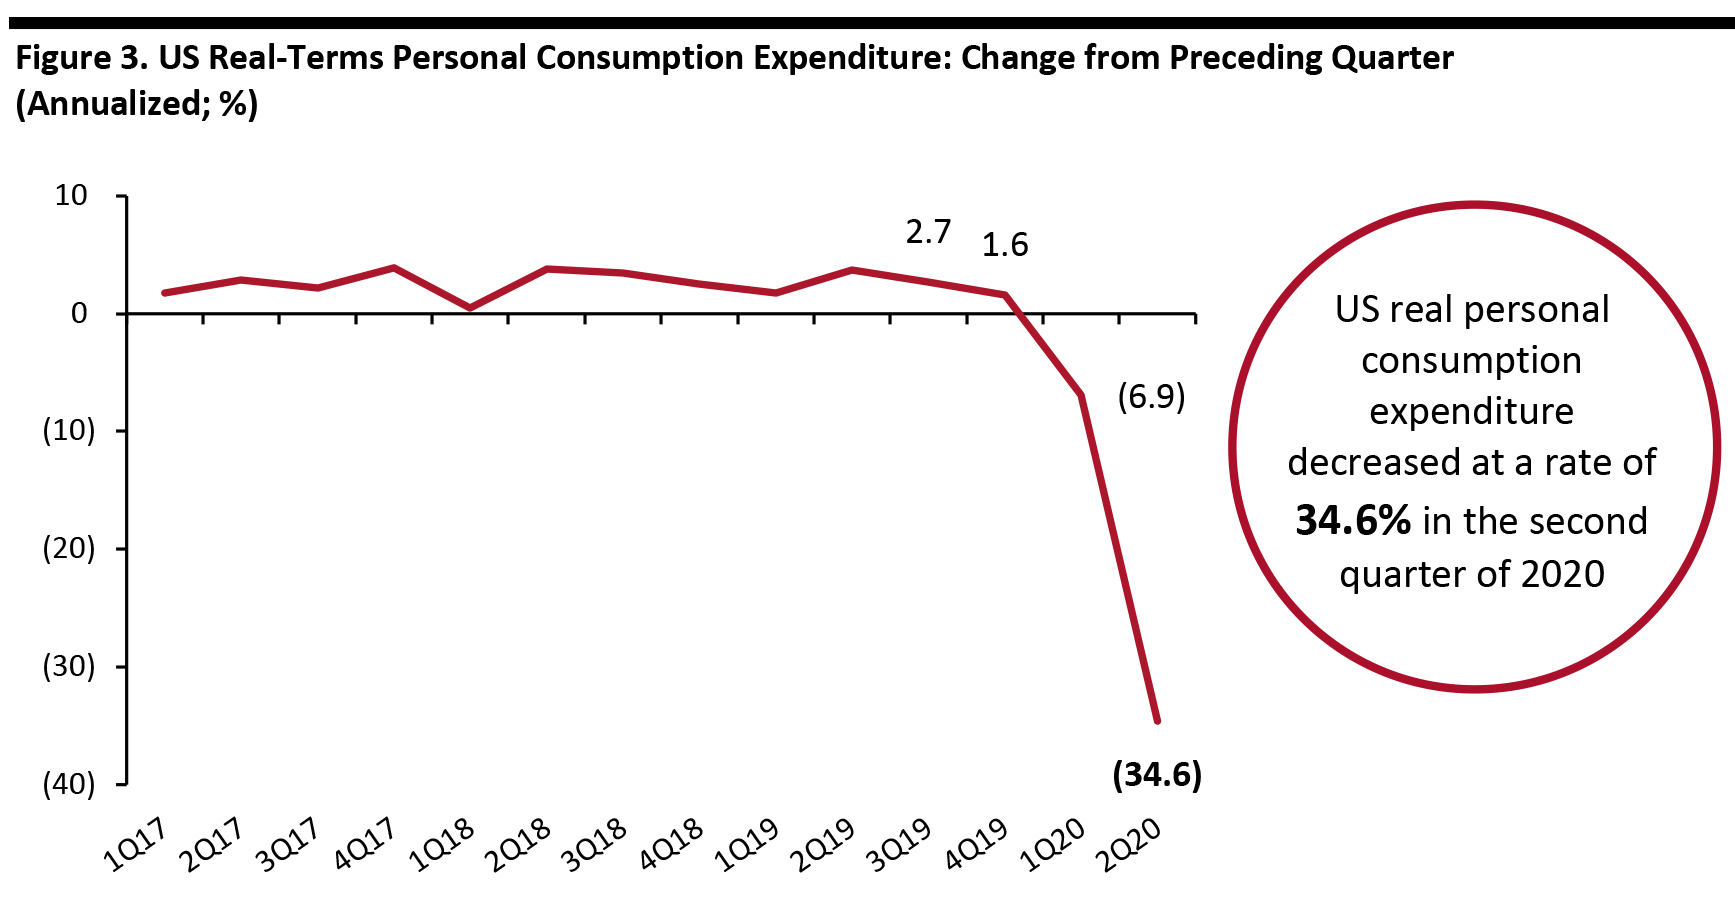 Source: Bureau of Economic Analysis[/caption]
China’s GDP Rebounds to Modest Growth
China’s economy grew by 3.2% year over year in the second quarter of 2020, after a decline of 6.8% in the previous quarter, according to the National Bureau of Statistics of China. This was above the 2.5% expansion that had been predicted by analysts surveyed in a Reuters poll.
The Chinese government has unleashed a range of stimulus measures—including more fiscal spending, tax relief and cuts in lending rates and banks’ reserve requirements—to boost the coronavirus-impacted economy and support employment. Still, challenges remain as the global economy falls into recession, hurting China’s exports.
[caption id="attachment_114174" align="aligncenter" width="700"]
Source: Bureau of Economic Analysis[/caption]
China’s GDP Rebounds to Modest Growth
China’s economy grew by 3.2% year over year in the second quarter of 2020, after a decline of 6.8% in the previous quarter, according to the National Bureau of Statistics of China. This was above the 2.5% expansion that had been predicted by analysts surveyed in a Reuters poll.
The Chinese government has unleashed a range of stimulus measures—including more fiscal spending, tax relief and cuts in lending rates and banks’ reserve requirements—to boost the coronavirus-impacted economy and support employment. Still, challenges remain as the global economy falls into recession, hurting China’s exports.
[caption id="attachment_114174" align="aligncenter" width="700"]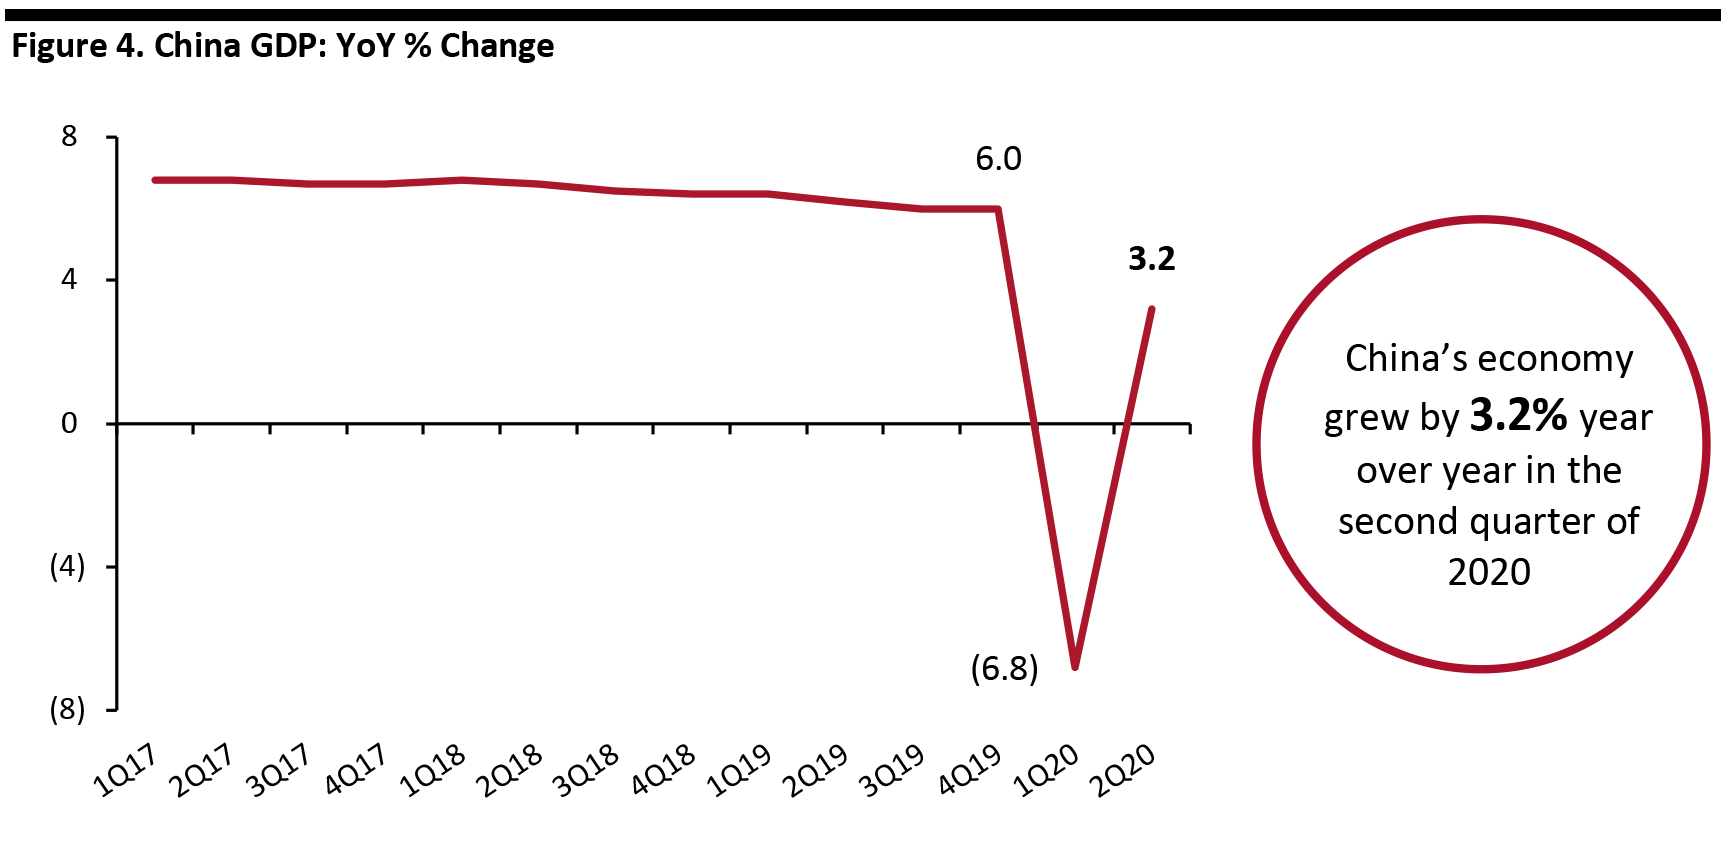 Source: National Bureau of Statistics of China[/caption]
China’s Industrial Production Continues To Expand
China’s industrial production increased by 4.8% year over year in June, expanding for the third consecutive month following declines in the first three months of the year. This was also slightly higher than the analyst consensus of 4.7% growth. For the second quarter, industrial output rose by 4.4% year over year.
Industrial production of mining and quarrying increased 1.7% year over year in June; manufacturing improved by 5.1%; and production and distribution of electricity, heating power, gas and water also went up by 5.5%.
[caption id="attachment_114175" align="aligncenter" width="700"]
Source: National Bureau of Statistics of China[/caption]
China’s Industrial Production Continues To Expand
China’s industrial production increased by 4.8% year over year in June, expanding for the third consecutive month following declines in the first three months of the year. This was also slightly higher than the analyst consensus of 4.7% growth. For the second quarter, industrial output rose by 4.4% year over year.
Industrial production of mining and quarrying increased 1.7% year over year in June; manufacturing improved by 5.1%; and production and distribution of electricity, heating power, gas and water also went up by 5.5%.
[caption id="attachment_114175" align="aligncenter" width="700"]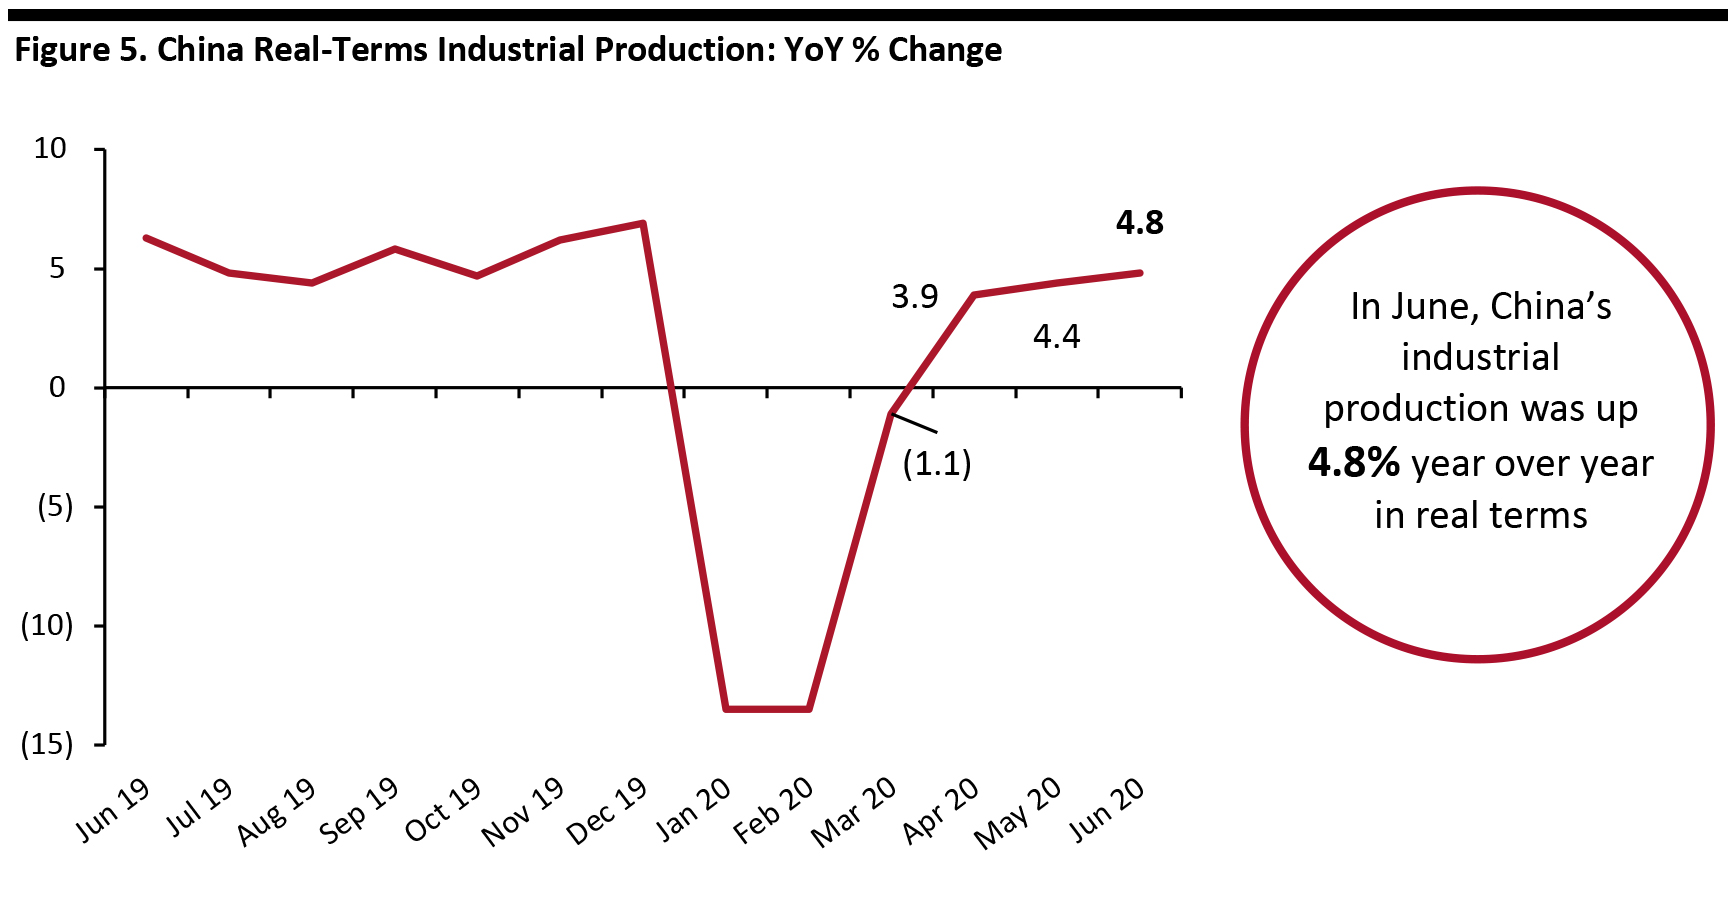 Source: National Bureau of Statistics of China[/caption]
China Real-Terms Per Capita Expenditure Slides
Accumulated per capita expenditure in real terms decreased by 9.3% year over year in China in the second quarter of 2020 but was less severe than the decline of 12.5% in the first quarter. Retail sales fell by 3.9% in the second quarter. In particular, retail sales in April tumbled by 7.5%, followed by gradual improvements of a 2.8% decline in May and a 1.8% drop in June.
[caption id="attachment_114176" align="aligncenter" width="700"]
Source: National Bureau of Statistics of China[/caption]
China Real-Terms Per Capita Expenditure Slides
Accumulated per capita expenditure in real terms decreased by 9.3% year over year in China in the second quarter of 2020 but was less severe than the decline of 12.5% in the first quarter. Retail sales fell by 3.9% in the second quarter. In particular, retail sales in April tumbled by 7.5%, followed by gradual improvements of a 2.8% decline in May and a 1.8% drop in June.
[caption id="attachment_114176" align="aligncenter" width="700"]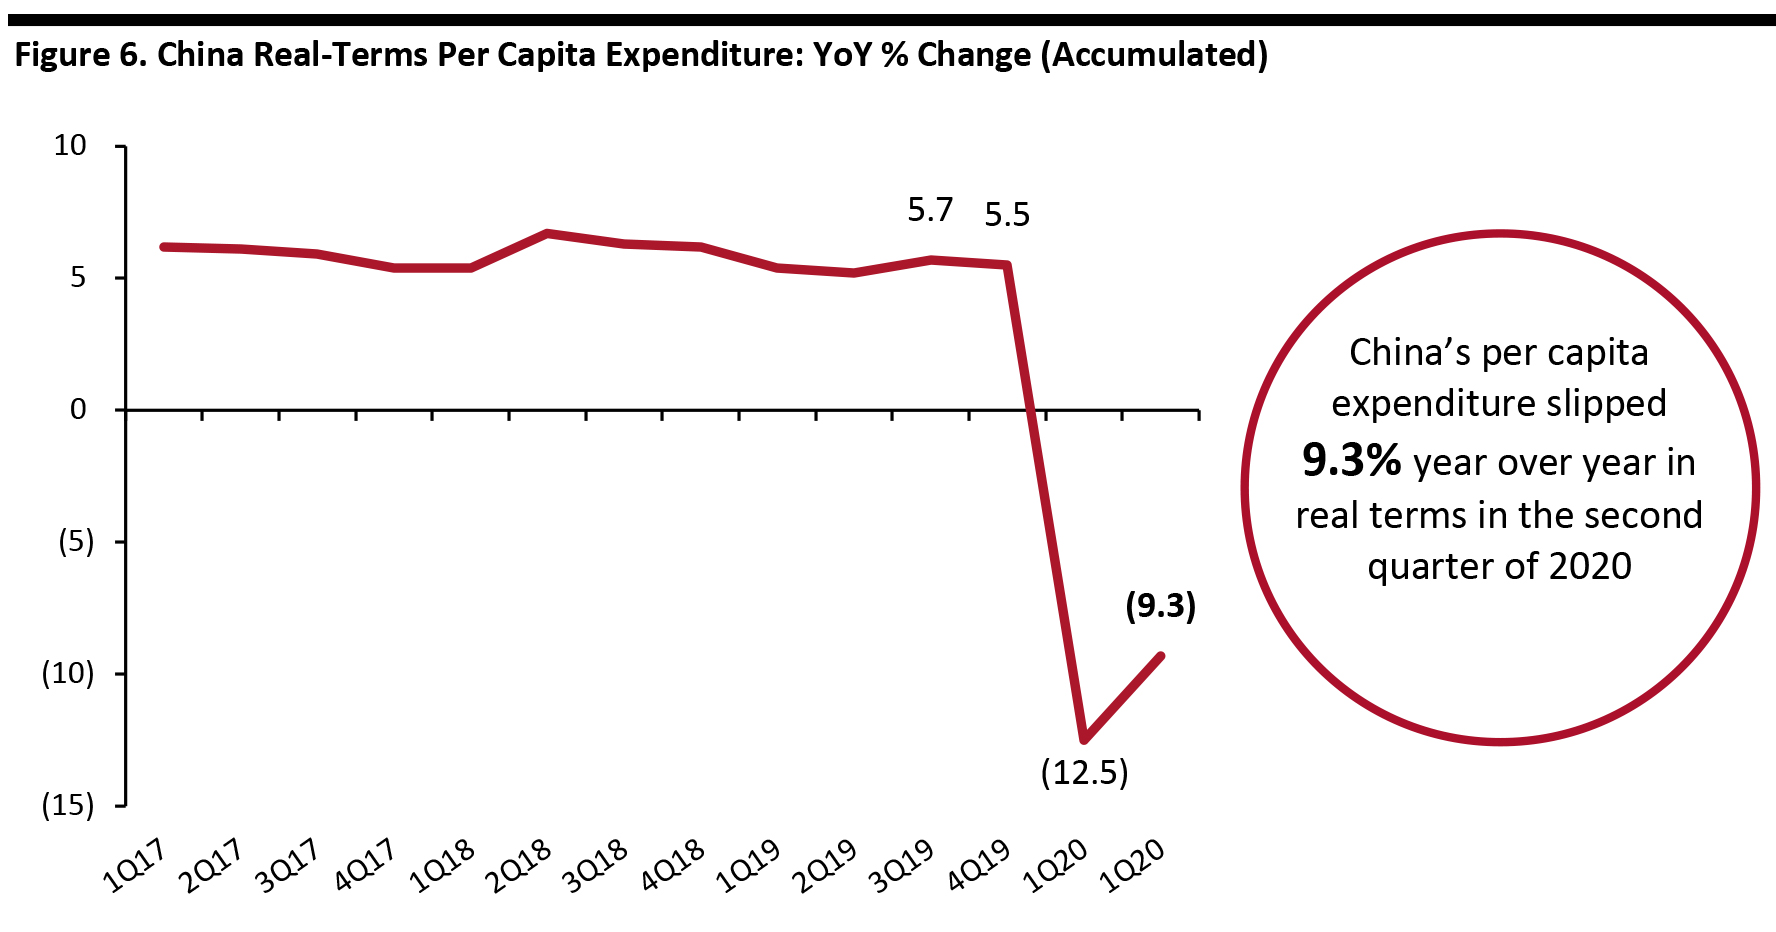 Source: National Bureau of Statistics of China[/caption]
Source: BEA[/caption]
US Industrial Production Declines Steeply in the Second Quarter
US industrial production plummeted 42.6% in the second quarter, the largest quarterly decline since the end of World War II. US factories saw a rebound in May and June, but the uptick could not overcome April’s record decline.
The output of consumer goods dropped by 37.6% in the quarter, within which durable goods collapsed 77.9% while durable goods fell 19.7%. Clothing saw the largest decrease of 57.4% within durable goods in the quarter, while foods and tobacco declined by 28.4%.
[caption id="attachment_114172" align="aligncenter" width="700"] Source: US Federal Reserve[/caption]
Personal Consumption Expenditure Drops Sharply in the Second Quarter
US real personal consumption expenditures (PCE, or consumer spending) tumbled sharply at an annual rate of 34.6% during the second quarter of 2020, following the drop of 6.9% in the previous quarter.
As with GDP, the quarterly metric makes for a blunt metric that conceals highly volatile numbers. In June, real PCE increased by 5.2% month over month, while disposable personal income (DPI, income after paying tax and other deductions) decreased by 1.8%. The decrease in real DPI in June can be attributed to a decrease in government social benefits as payments made to individuals in response to the Covid-19, partially offset by increases in compensation, proprietors’ income and unemployment insurance benefits.
The growth in real PCE in June was a result of a month-over-month increase of $273.7 billion (a 5.7% increase) in spending on services and an expansion of $362.1 billion (a 5.0% increase) in spending on goods. Within services, the leading contributors of growth was spending on health care, as well as on food services and accommodation. The spending on goods was driven by a month-over-month recovery in clothing and footwear.
[caption id="attachment_114173" align="aligncenter" width="700"] Source: Bureau of Economic Analysis[/caption]
China’s GDP Rebounds to Modest Growth
China’s economy grew by 3.2% year over year in the second quarter of 2020, after a decline of 6.8% in the previous quarter, according to the National Bureau of Statistics of China. This was above the 2.5% expansion that had been predicted by analysts surveyed in a Reuters poll.
The Chinese government has unleashed a range of stimulus measures—including more fiscal spending, tax relief and cuts in lending rates and banks’ reserve requirements—to boost the coronavirus-impacted economy and support employment. Still, challenges remain as the global economy falls into recession, hurting China’s exports.
[caption id="attachment_114174" align="aligncenter" width="700"] Source: National Bureau of Statistics of China[/caption]
China’s Industrial Production Continues To Expand
China’s industrial production increased by 4.8% year over year in June, expanding for the third consecutive month following declines in the first three months of the year. This was also slightly higher than the analyst consensus of 4.7% growth. For the second quarter, industrial output rose by 4.4% year over year.
Industrial production of mining and quarrying increased 1.7% year over year in June; manufacturing improved by 5.1%; and production and distribution of electricity, heating power, gas and water also went up by 5.5%.
[caption id="attachment_114175" align="aligncenter" width="700"] Source: National Bureau of Statistics of China[/caption]
China Real-Terms Per Capita Expenditure Slides
Accumulated per capita expenditure in real terms decreased by 9.3% year over year in China in the second quarter of 2020 but was less severe than the decline of 12.5% in the first quarter. Retail sales fell by 3.9% in the second quarter. In particular, retail sales in April tumbled by 7.5%, followed by gradual improvements of a 2.8% decline in May and a 1.8% drop in June.
[caption id="attachment_114176" align="aligncenter" width="700"] Source: National Bureau of Statistics of China[/caption]