
DIpil Das
US and China Quarterly Economic Update, 1Q22
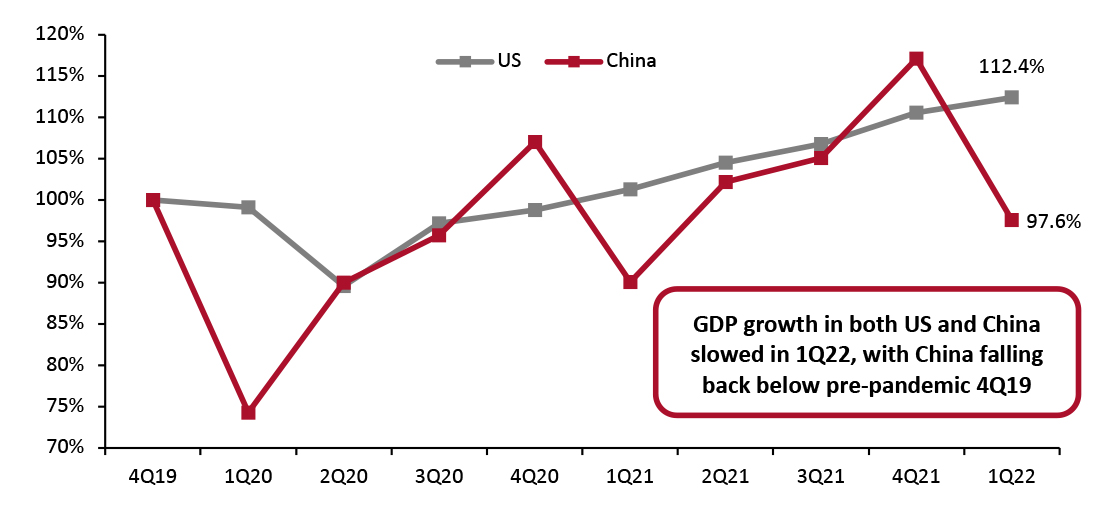
Our Quarterly Economic Update discusses macroeconomic indicators from the US and China, including GDP and industrial production. In this report, we look at recently released data for the first quarter of 2022. US GDP Growth Shrinks, While China’s GDP Falls Below Pre-Pandemic Values The Chinese economy has witnessed a volatile recovery from the pandemic. In the early stages of the pandemic, amid stricter restrictions, the Chinese economy saw a much deeper decline than the US economy. However, beginning in the second quarter of 2020, China’s GDP started recovering quickly and, in the fourth quarter of 2020, Chinese GDP surpassed its value from the final quarter of 2019 (the last quarter unaffected by the pandemic). In the first two quarters of 2021, China experienced strong growth; however, power outages and Covid-19 lockdowns slowed growth in the second half of 2021. In the first quarter of 2022, Covid-19 lockdowns stemming from China’s zero-tolerance approach to controlling outbreaks halted production and consumer spending. Consequently, GDP has fallen back below its value in the fourth quarter of 2019. Compared to China, the US economy suffered a shallower decline at the pandemic’s beginning and has witnessed a steadier recovery. While US GDP surpassed its 2019 fourth-quarter value later than China’s, it then outpaced China’s GDP recovery until the third quarter of 2021. In the first quarter of 2022, driven by a slow down in government spending, net exports and continued supply chain challenges, the US GDP shrank for the first time since 2020. In Figure 1 below, we illustrate the GDP recoveries of the US and China, indexed to the fourth quarter of 2019.Figure 1. US and China GDP, Indexed to 4Q19 (Annualized; %) [caption id="attachment_146625" align="aligncenter" width="700"]
 Source: National Bureau of Statistics of China/US Bureau of Economic Analysis[/caption]
US Sees First GDP Shrinkage Since 2020
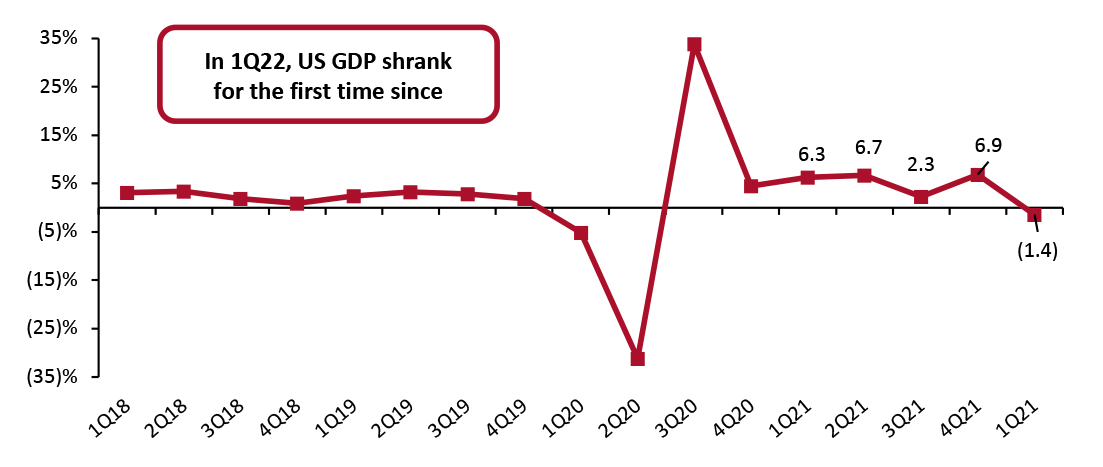
The US economy shrank at an annualized rate of 1.4% in the first quarter of 2022, representing the US’s first GDP shrinkage since the second quarter of 2020, when the onset of the pandemic drove the economy into a brief recession.
According to the Bureau of Economic Analysis (BEA), the slowdown in GDP growth was led by decreases in private inventory investment, exports and federal, state and local government spending, as well as an increase in imports.
Figure 2. US GDP: Change from Preceding Quarter (Annualized; %) [caption id="attachment_146598" align="aligncenter" width="699"]
 Source: US Bureau of Economic Analysis[/caption]
According to the BEA, the decrease in private inventory investment was driven by wholesale and retail trade decreases. Within wholesale trade, the decreases were driven by declines in the wholesale of motor vehicles. Similarly, within retail trade, the overall declines were led by “other” retailers and motor vehicle dealers. The decrease in government spending represented a decrease in defense spending, while the increase in imports was led by durable goods, notably nonfood and nonautomotive consumer goods.
US Industrial Production Growth Accelerates
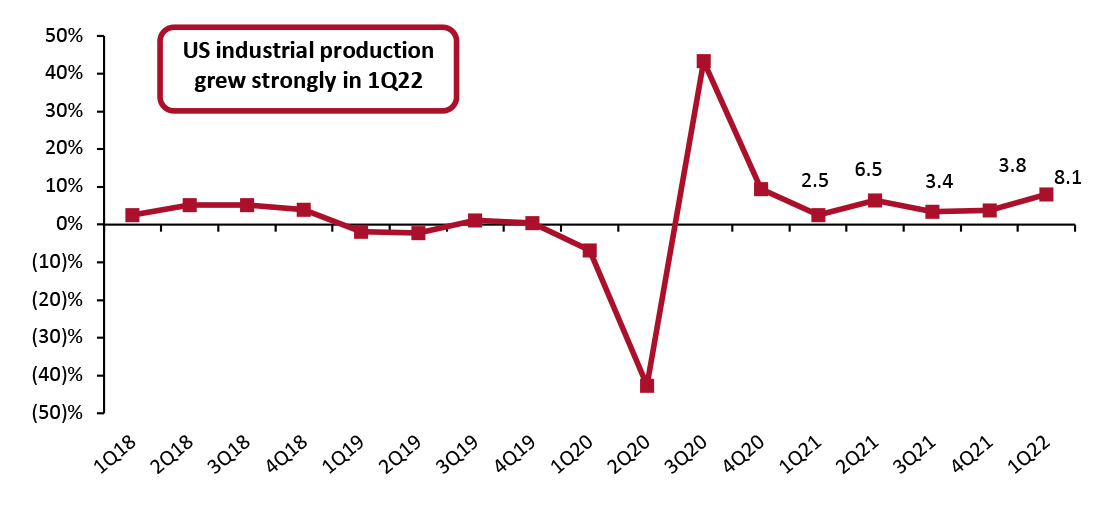
In the first quarter of 2022, US industrial production increased by an annualized rate of 8.1%, an acceleration from the fourth quarter’s revised 3.8% annualized industrial production growth, according to the Federal Reserve.
The output of consumer goods rose 7.1% versus a revised increase of just 0.3% in the fourth quarter of 2021, on a seasonally adjusted annualized basis. Durable goods output grew 6.9%, while nondurable goods production accelerated to 7.2% year-over-year growth, up from the fourth quarter of 2021’s 1.9% decline. Growth in durable goods production was driven by a 21.1% rise in the production of appliances, furniture and carpeting, propelled forward by 18.3% growth in energy production. Notably, however, clothing production declined by 12.9%.
Figure 3. US Industrial Production: Change from Preceding Quarter (Annualized; %) [caption id="attachment_146627" align="aligncenter" width="701"]
 Source: US Federal Reserve[/caption]
Consumer Spending Rises Amid Fastest Rising Prices in Four Decades
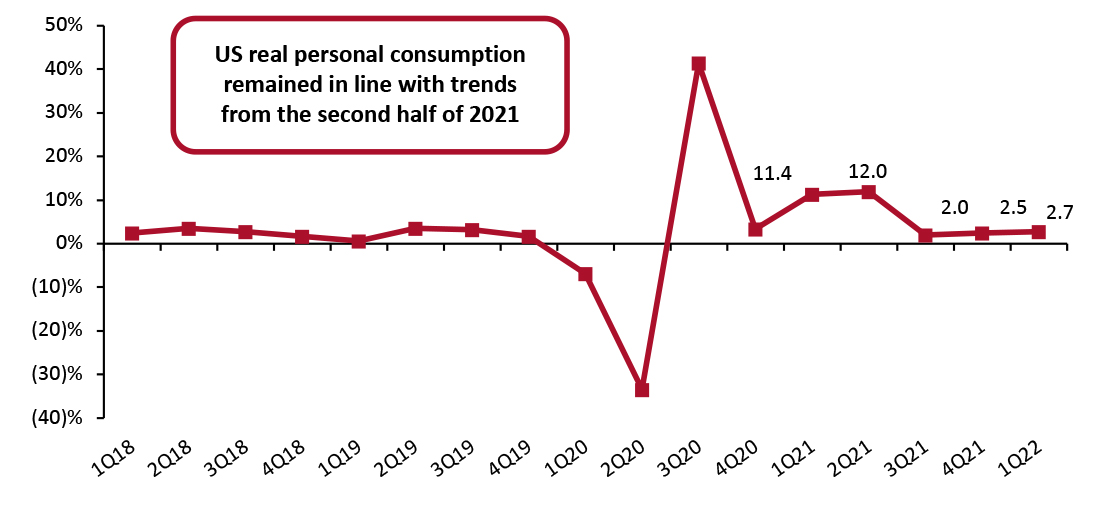
In the first quarter of 2022, US real personal consumption expenditures (PCE), also known as consumer spending, rose at an annual rate of 2.7%, a slight acceleration from the fourth quarter of 2021’s revised 2.5% PCE growth. Consumers spent strongly in the first two months of the year, amid the fastest rising prices in 40 years. However, according to retail sales estimates published monthly by the Census Bureau, it appears consumer spending is beginning to slow as of March. Retail sales grew just 4.0% in March, down from February’s strong 13.1% year-over-year growth.
Overall spending on goods declined marginally by 0.1%. Within goods spending, durable goods spending grew at an annualized 4.1%. Meanwhile, nondurable goods spending fell by 2.5% year over year. Spending on services continued to be strong, growing 4.3% from a year ago.
Figure 4. US Real-Terms Personal Consumption Expenditures: Change from Preceding Quarter (Annualized; %) [caption id="attachment_146600" align="aligncenter" width="699"]
 Source: US Bureau of Economic Analysis[/caption]
China’s GDP Growth Begins to Pick Up
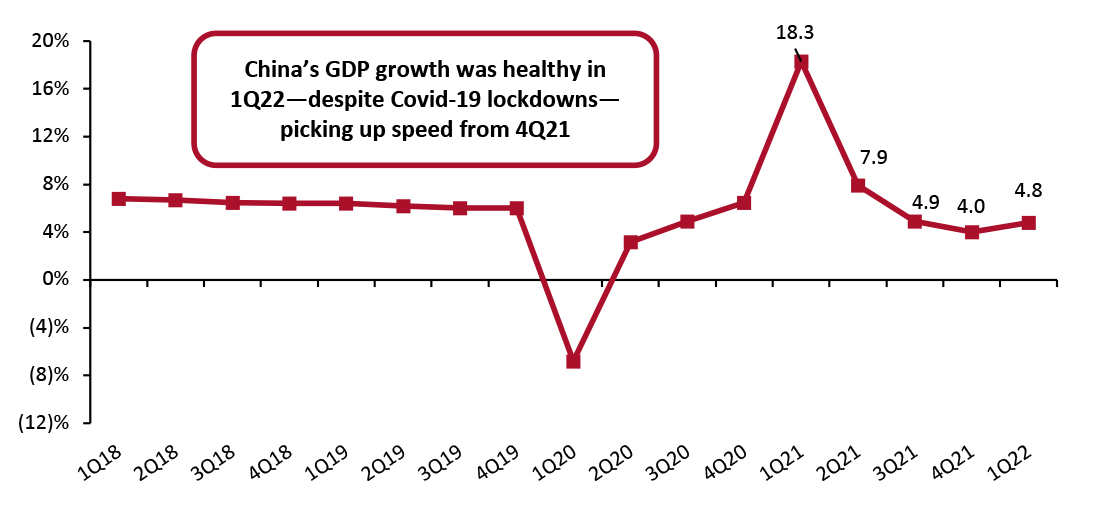
In the first quarter of 2022, China’s economy grew 4.8% year over year, a more positive sign for the economy than its 2.1% retail sales decline in March. However, the government’s zero-tolerance policy approach to controlling Covid-19 outbreaks is still limiting business activity and consumer spending, presenting headwinds to economic recovery.
Year over year, China’s GDP growth accelerated from a slowdown in the second half of 2021. Furthermore, the 4.8% year-over-year growth is against strong first quarter of 2021 comparatives, when GDP grew 18.3%.
Figure 5. China GDP: YoY % Change [caption id="attachment_146628" align="aligncenter" width="700"]
 Source: National Bureau of Statistics of China[/caption]
China’s Industrial Production Growth Remains Strong
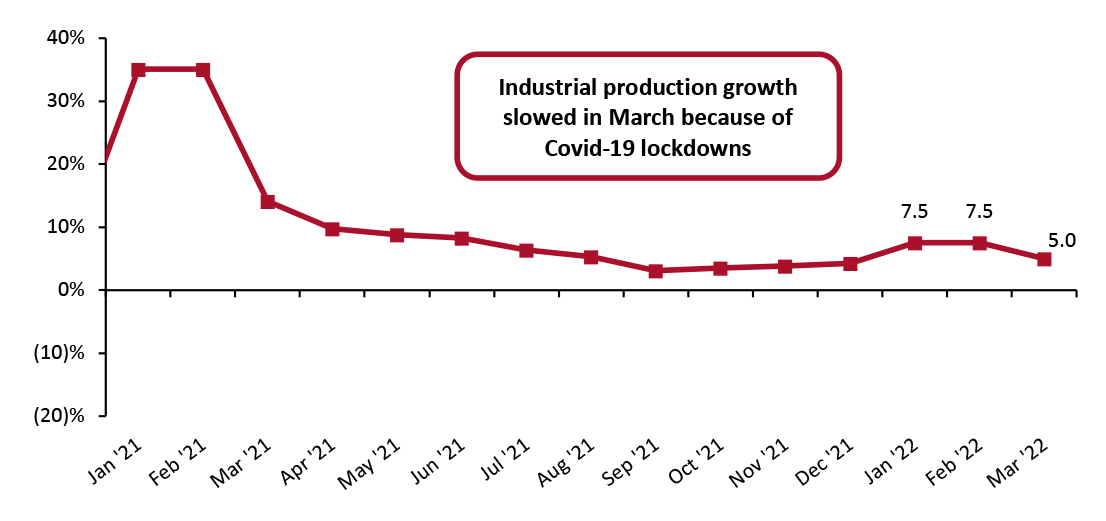
In the first quarter of 2022, Chinese industrial production grew an average 6.7% year over year against strong 2021 comparatives. January and February’s data are reported together in the month of March by the National Bureau of Statistics of China (NBS). In January and February, industrial production rose 7.5% compared to the previous year. In March, industrial production slowed due to the Chinese government’s zero-tolerance policy approach to controlling Covid-19 outbreaks, which resulted in city-wide lockdowns and production pauses.
Figure 6. China Real-Terms Industrial Production: YoY % Change [caption id="attachment_146602" align="aligncenter" width="701"]
 Source: National Bureau of Statistics of China[/caption]
So far, accumulated industrial production has increased 6.5% compared to last year. Performance has varied across sectors, as shown in Figure 7 below.
Figure 7. China Real-Terms Industrial Production by Sector (Accumulated): YoY % Change in 2021 [wpdatatable id=1935]
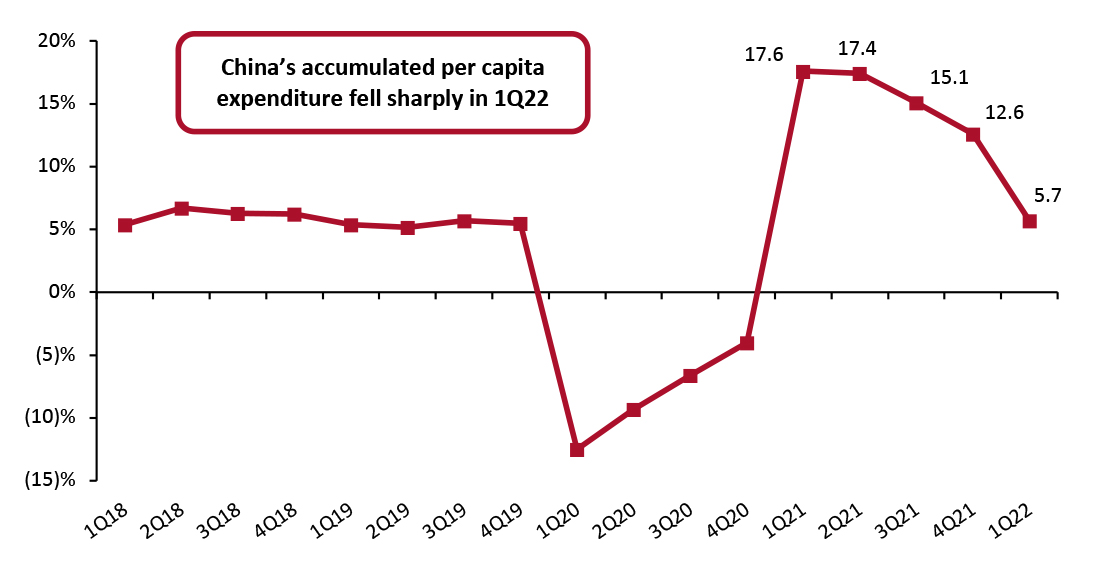
Source: National Bureau of Statistics of China China Real-Terms per Capita Expenditure Growth Sees Slowdown Per capita expenditure in real terms increased by 5.4% year over year in China, a considerable slowdown from the double-digit growth in per capita expenditure exhibited throughout 2021. Overall, per capita expenditure growth was led by 12.7% growth in transportation and communication spending, 9.1% growth in health care spending and 17.1% growth “other goods and services” spending, according to the NBS.
Figure 8. China Real-Terms per Capita Expenditure: YoY % Change (Accumulated) [caption id="attachment_146603" align="aligncenter" width="701"]
 Source: National Bureau of Statistics of China[/caption]
We expect China’s accumulated per capita expenditure growth to accelerate in the remainder of the year, barring any further Covid-19 breakouts. While lockdowns halted consumer spending and production, the government is starting to ease the restrictions in the second quarter of 2022.