Nitheesh NH
US Posts Stronger Quarterly Growth but Remains Behind China
Amid stricter lockdowns that tamed the virus more rapidly, the Chinese economy recovered far more quickly in the early stages of the pandemic than the US economy. In fact, the US continues to lag behind China in recovery—2021 first-quarter growth pulled US GDP back within one percentage point of its GDP in the final quarter of 2019, which was the last quarter to not feel the impact of the pandemic. However, Chinese GDP surpassed its final quarter 2019 value much earlier—in the second quarter of 2020. The figure below illustrates the respective recoveries by the two countries, indexed to the last quarter of 2019.
Figure 1. US and China GDP, Indexed to 4Q19 (Annualized; %)
[caption id="attachment_126857" align="aligncenter" width="720"]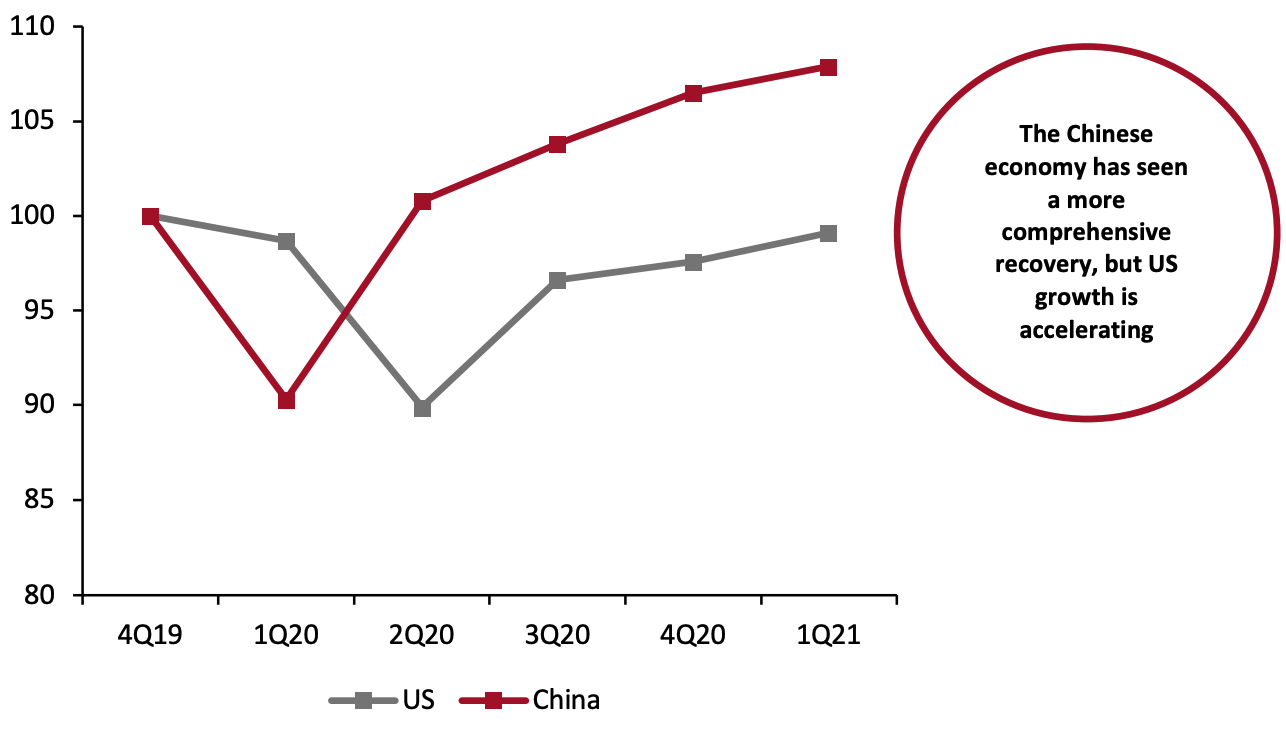 Source: BEA/National Bureau of Statistics of China[/caption]
Although China’s reported GDP growth figure was stronger than the US figure this quarter, the US actually experienced a larger economic boom—Chinese growth was artificially inflated due to the country reporting year-over-year figures that annualized a steep drop off in economic production in 2020.
US GDP Growth in Line with Estimates
The US economy accelerated at an annual seasonally adjusted rate of 6.4% for the first quarter of 2021, according to GDP growth estimates published by the US Bureau of Economic Analysis (BEA) on April 29, 2021. The BEA also revised its advance estimate for GDP growth in the fourth quarter of 2020 from 4.0% to 4.3%. The first-quarter growth estimate narrowly misses consensus estimates of 6.5% but is, nevertheless, stronger than the prior quarter’s disappointing growth. We expect that the issuance of stimulus checks helped to drive growth in a quarter that was defined by surging Covid cases for its first two months.
Figure 2. US GDP: Change from Preceding Quarter (Annualized; %)
[caption id="attachment_126858" align="aligncenter" width="720"]
Source: BEA/National Bureau of Statistics of China[/caption]
Although China’s reported GDP growth figure was stronger than the US figure this quarter, the US actually experienced a larger economic boom—Chinese growth was artificially inflated due to the country reporting year-over-year figures that annualized a steep drop off in economic production in 2020.
US GDP Growth in Line with Estimates
The US economy accelerated at an annual seasonally adjusted rate of 6.4% for the first quarter of 2021, according to GDP growth estimates published by the US Bureau of Economic Analysis (BEA) on April 29, 2021. The BEA also revised its advance estimate for GDP growth in the fourth quarter of 2020 from 4.0% to 4.3%. The first-quarter growth estimate narrowly misses consensus estimates of 6.5% but is, nevertheless, stronger than the prior quarter’s disappointing growth. We expect that the issuance of stimulus checks helped to drive growth in a quarter that was defined by surging Covid cases for its first two months.
Figure 2. US GDP: Change from Preceding Quarter (Annualized; %)
[caption id="attachment_126858" align="aligncenter" width="720"]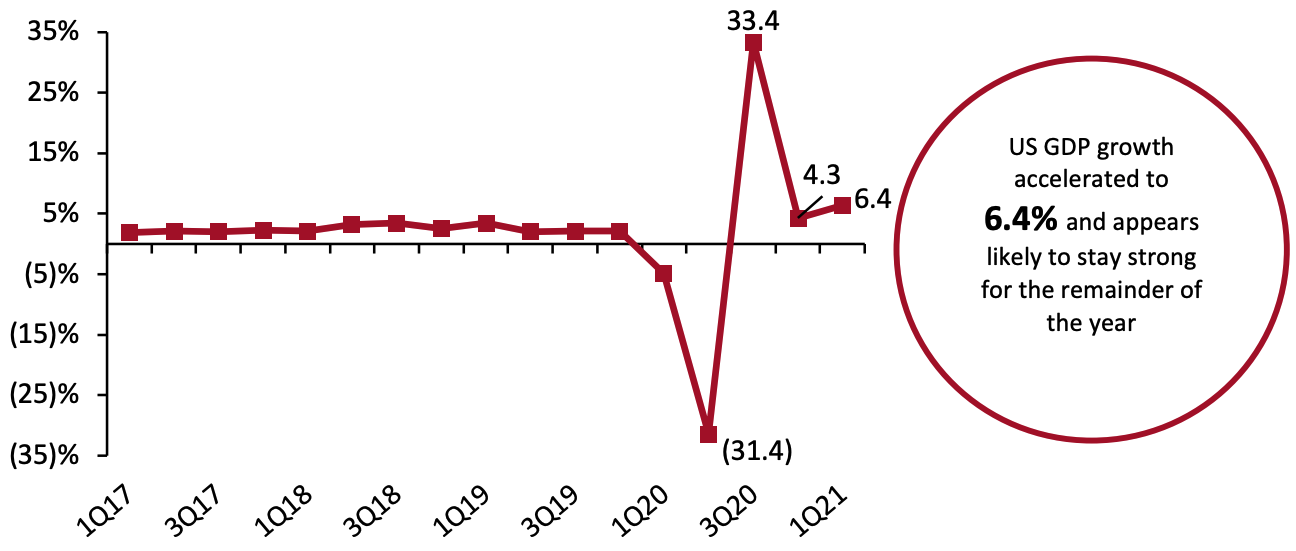 Source: BEA[/caption]
The quarter’s growth was driven almost exclusively by a rise in consumer spending. Personal consumption expenditures rose by 10.7%, making up for a 5.0% drop off in private domestic investment. Net exports fell 1.1% but were balanced out by a 6.3% increase in government expenditures and investment.
US Industrial Production Growth Slows but Remains Positive
Following two quarters of exceptionally strong annualized growth—43.3% and a revised 9.5% in the third and fourth quarters of 2020, respectively—US industrial production grew by a more modest 2.5% in the first quarter of 2021.
The output of consumer goods improved by 2.5% in the first quarter of 2021 on a seasonally adjusted annualized basis. On a non-annualized basis, durable goods fell by 0.9% and nondurable goods production grew by 0.8% quarter over quarter. Growth in nondurable goods production was driven by strong increases in the production of clothing products, while durable goods production growth was held back by a decline in automotive production.
Figure 3. US Industrial Production: Change from Preceding Quarter (Annualized; %)
[caption id="attachment_126859" align="aligncenter" width="720"]
Source: BEA[/caption]
The quarter’s growth was driven almost exclusively by a rise in consumer spending. Personal consumption expenditures rose by 10.7%, making up for a 5.0% drop off in private domestic investment. Net exports fell 1.1% but were balanced out by a 6.3% increase in government expenditures and investment.
US Industrial Production Growth Slows but Remains Positive
Following two quarters of exceptionally strong annualized growth—43.3% and a revised 9.5% in the third and fourth quarters of 2020, respectively—US industrial production grew by a more modest 2.5% in the first quarter of 2021.
The output of consumer goods improved by 2.5% in the first quarter of 2021 on a seasonally adjusted annualized basis. On a non-annualized basis, durable goods fell by 0.9% and nondurable goods production grew by 0.8% quarter over quarter. Growth in nondurable goods production was driven by strong increases in the production of clothing products, while durable goods production growth was held back by a decline in automotive production.
Figure 3. US Industrial Production: Change from Preceding Quarter (Annualized; %)
[caption id="attachment_126859" align="aligncenter" width="720"]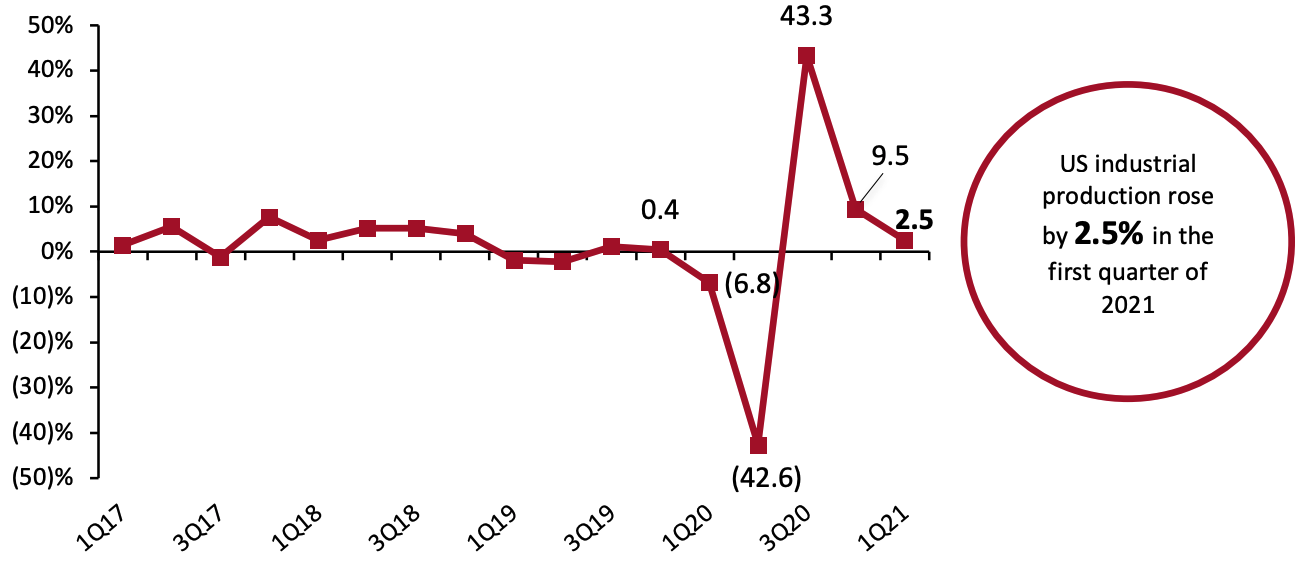 Source: US Federal Reserve[/caption]
Stimulus Checks and Reopenings Cause US Personal Consumption Expenditures To Shoot Up
Driven by stimulus checks and easing Covid-19 restrictions, US real personal consumption expenditures (PCE, or consumer spending) rose at an annual rate of 10.7% in the first quarter of 2021, following a 2.3% rise in the final quarter of 2020. Both goods and services spending saw growth, though the former contributed the majority to the sharp rise in spending. Goods spending rose by 23.6% after falling 1.4% the previous quarter, while services spending rose by 4.6% following similarly moderate 4.3% growth in the fourth quarter of 2020.
Within goods spending, durable goods posted far stronger growth than nondurable. Durable goods spending rose by 41.4% after declining by 1.1% the quarter prior, while nondurable goods spending grew by a still-strong 14.4% after a decline of 1.6% the previous quarter. For much of the quarter, Covid-19 cases were at almost record highs in the US, pushing stimulus-driven spending to goods rather than services—a pattern that is likely to reverse in the second quarter and beyond as cases decline and restrictions on activities ease.
Figure 4. US Real-Terms Personal Consumption Expenditure: Change from Preceding Quarter (Annualized; %)
[caption id="attachment_126860" align="aligncenter" width="720"]
Source: US Federal Reserve[/caption]
Stimulus Checks and Reopenings Cause US Personal Consumption Expenditures To Shoot Up
Driven by stimulus checks and easing Covid-19 restrictions, US real personal consumption expenditures (PCE, or consumer spending) rose at an annual rate of 10.7% in the first quarter of 2021, following a 2.3% rise in the final quarter of 2020. Both goods and services spending saw growth, though the former contributed the majority to the sharp rise in spending. Goods spending rose by 23.6% after falling 1.4% the previous quarter, while services spending rose by 4.6% following similarly moderate 4.3% growth in the fourth quarter of 2020.
Within goods spending, durable goods posted far stronger growth than nondurable. Durable goods spending rose by 41.4% after declining by 1.1% the quarter prior, while nondurable goods spending grew by a still-strong 14.4% after a decline of 1.6% the previous quarter. For much of the quarter, Covid-19 cases were at almost record highs in the US, pushing stimulus-driven spending to goods rather than services—a pattern that is likely to reverse in the second quarter and beyond as cases decline and restrictions on activities ease.
Figure 4. US Real-Terms Personal Consumption Expenditure: Change from Preceding Quarter (Annualized; %)
[caption id="attachment_126860" align="aligncenter" width="720"]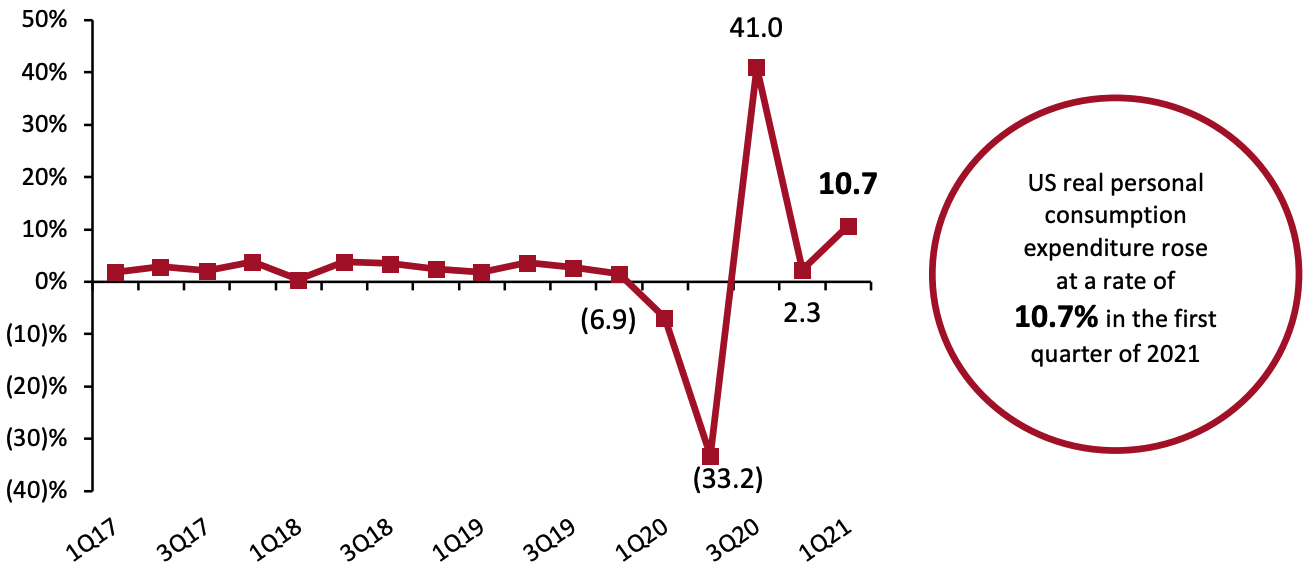 Source: Bureau of Economic Analysis[/caption]
China’s Year-over-Year GDP Growth Soars but Quarterly Growth Decelerates
In the first quarter of 2021, China’s economy grew 18.3% year over year, representing the fourth straight quarter that the country has experienced positive economic growth—but narrowly missing consensus expectations of a 19% increase. On a year-over-year basis, growth accelerated sharply from single-digit growth seen in the previous quarter, which can be attributed to weak 2020 comparatives for the first quarter. As part of its latest five-year plan, the Chinese government expects GDP growth to reach 6% over the course of 2021.
Figure 5. China GDP: YoY % Change
[caption id="attachment_126861" align="aligncenter" width="720"]
Source: Bureau of Economic Analysis[/caption]
China’s Year-over-Year GDP Growth Soars but Quarterly Growth Decelerates
In the first quarter of 2021, China’s economy grew 18.3% year over year, representing the fourth straight quarter that the country has experienced positive economic growth—but narrowly missing consensus expectations of a 19% increase. On a year-over-year basis, growth accelerated sharply from single-digit growth seen in the previous quarter, which can be attributed to weak 2020 comparatives for the first quarter. As part of its latest five-year plan, the Chinese government expects GDP growth to reach 6% over the course of 2021.
Figure 5. China GDP: YoY % Change
[caption id="attachment_126861" align="aligncenter" width="720"]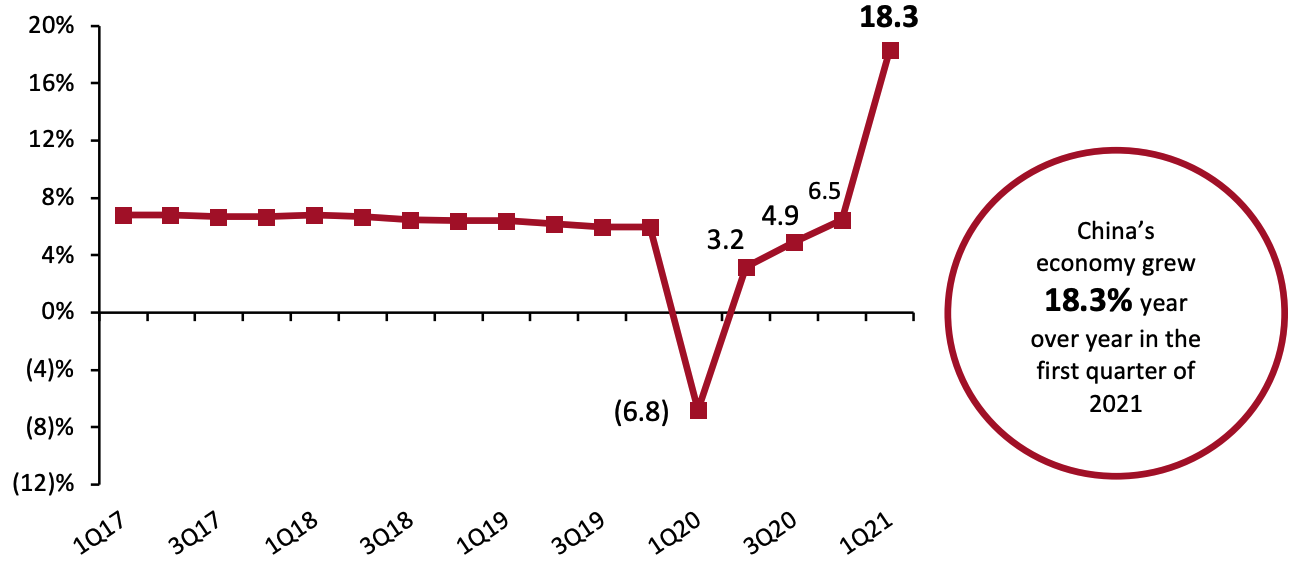 Source: National Bureau of Statistics of China[/caption]
The Chinese economy has already recovered and grown substantially from pre-pandemic levels, but growth does appear to be decelerating on a quarter-over-quarter basis. This quarter represented the lowest quarterly growth rate since the beginning of the pandemic.
China’s Industrial Production Continues To Accelerate
Over the first quarter, Chinese industrial production grew 24.5% year over year, driven by especially strong growth in January and February against weak comparatives in 2020. January and February’s industrial production rose by 35.1%, while March saw growth of 14.1%. Manufacturing and manufacturing of high-tech goods each saw very strong growth, rising by 27.3% and 31.2% year over year, respectively. Mining and quarrying production saw slightly more tempered growth of 10.1%
Figure 6. China Real-Terms Industrial Production: YoY % Change
[caption id="attachment_126862" align="aligncenter" width="720"]
Source: National Bureau of Statistics of China[/caption]
The Chinese economy has already recovered and grown substantially from pre-pandemic levels, but growth does appear to be decelerating on a quarter-over-quarter basis. This quarter represented the lowest quarterly growth rate since the beginning of the pandemic.
China’s Industrial Production Continues To Accelerate
Over the first quarter, Chinese industrial production grew 24.5% year over year, driven by especially strong growth in January and February against weak comparatives in 2020. January and February’s industrial production rose by 35.1%, while March saw growth of 14.1%. Manufacturing and manufacturing of high-tech goods each saw very strong growth, rising by 27.3% and 31.2% year over year, respectively. Mining and quarrying production saw slightly more tempered growth of 10.1%
Figure 6. China Real-Terms Industrial Production: YoY % Change
[caption id="attachment_126862" align="aligncenter" width="720"]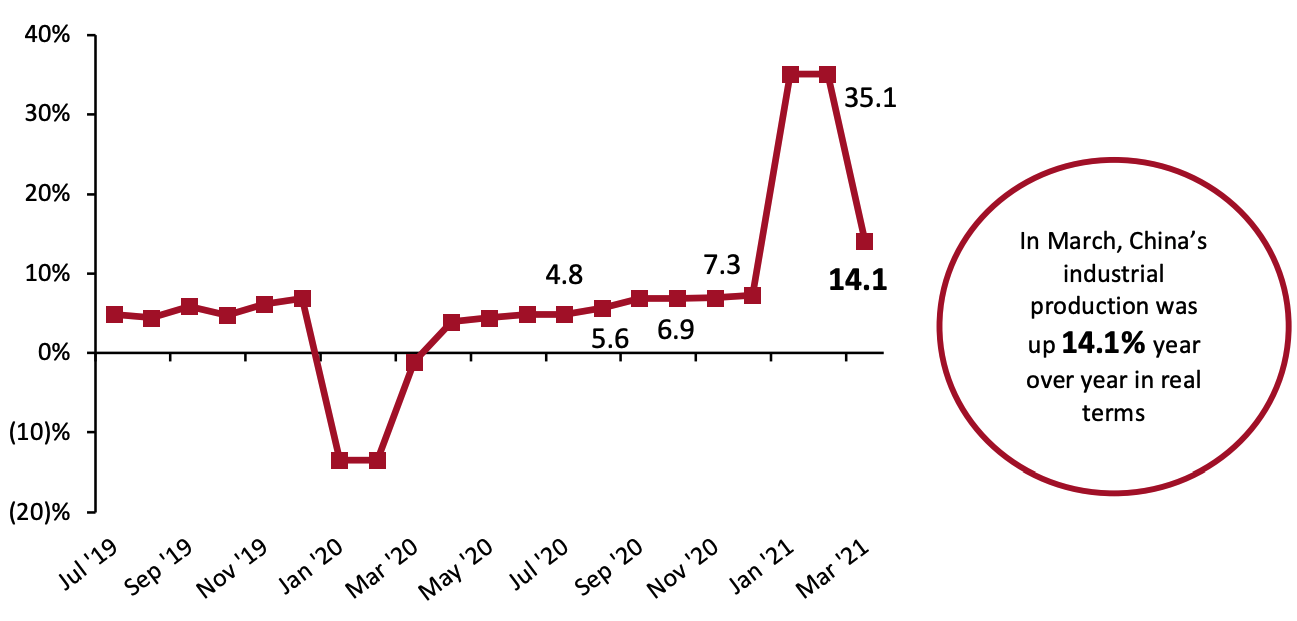 Source: National Bureau of Statistics of China[/caption]
China Real-Terms per Capita Expenditure Far Outpaces 2020 Levels
China’s first-quarter per capita expenditure in real terms rose by 17.6% year over year and was up 8.0% compared to the same period in 2019—which fell prior to the pandemic. Rural households boosted their spending slightly more than their urban counterparts, increasing expenditure by 16.3% versus urban households’ 12.2% increase.
Recovering from a historic slide in 2020, education, culture and recreation spending saw the sharpest increase in the first quarter, rising 55.7% year over year. Every other category of expenditure, except for spending on residence, also saw double-digit growth, with miscellaneous goods and services seeing the second-strongest growth among the categories, at 24.2%.
Figure 7. China Real-Terms per Capita Expenditure: YoY % Change (Accumulated)
[caption id="attachment_126863" align="aligncenter" width="720"]
Source: National Bureau of Statistics of China[/caption]
China Real-Terms per Capita Expenditure Far Outpaces 2020 Levels
China’s first-quarter per capita expenditure in real terms rose by 17.6% year over year and was up 8.0% compared to the same period in 2019—which fell prior to the pandemic. Rural households boosted their spending slightly more than their urban counterparts, increasing expenditure by 16.3% versus urban households’ 12.2% increase.
Recovering from a historic slide in 2020, education, culture and recreation spending saw the sharpest increase in the first quarter, rising 55.7% year over year. Every other category of expenditure, except for spending on residence, also saw double-digit growth, with miscellaneous goods and services seeing the second-strongest growth among the categories, at 24.2%.
Figure 7. China Real-Terms per Capita Expenditure: YoY % Change (Accumulated)
[caption id="attachment_126863" align="aligncenter" width="720"]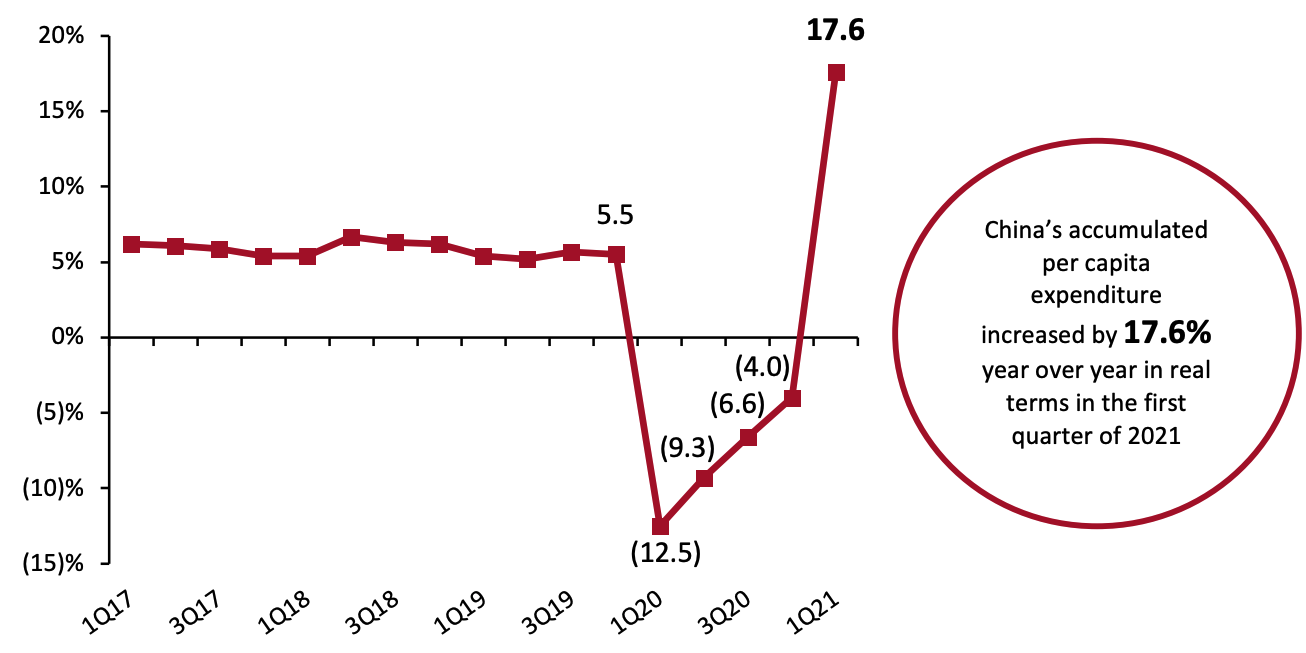 Source: National Bureau of Statistics of China[/caption]
We anticipate that second-quarter expenditure growth will be far more modest due to more demanding 2020 figures—but we expect to see growth nevertheless. The first stage of Chinese economic recovery was largely driven by increased government investment, while later stages of the rebound are likely to be fueled by rises in consumer spending.
Source: National Bureau of Statistics of China[/caption]
We anticipate that second-quarter expenditure growth will be far more modest due to more demanding 2020 figures—but we expect to see growth nevertheless. The first stage of Chinese economic recovery was largely driven by increased government investment, while later stages of the rebound are likely to be fueled by rises in consumer spending.
Source: BEA/National Bureau of Statistics of China[/caption]
Although China’s reported GDP growth figure was stronger than the US figure this quarter, the US actually experienced a larger economic boom—Chinese growth was artificially inflated due to the country reporting year-over-year figures that annualized a steep drop off in economic production in 2020.
US GDP Growth in Line with Estimates
The US economy accelerated at an annual seasonally adjusted rate of 6.4% for the first quarter of 2021, according to GDP growth estimates published by the US Bureau of Economic Analysis (BEA) on April 29, 2021. The BEA also revised its advance estimate for GDP growth in the fourth quarter of 2020 from 4.0% to 4.3%. The first-quarter growth estimate narrowly misses consensus estimates of 6.5% but is, nevertheless, stronger than the prior quarter’s disappointing growth. We expect that the issuance of stimulus checks helped to drive growth in a quarter that was defined by surging Covid cases for its first two months.
Figure 2. US GDP: Change from Preceding Quarter (Annualized; %)
[caption id="attachment_126858" align="aligncenter" width="720"] Source: BEA[/caption]
The quarter’s growth was driven almost exclusively by a rise in consumer spending. Personal consumption expenditures rose by 10.7%, making up for a 5.0% drop off in private domestic investment. Net exports fell 1.1% but were balanced out by a 6.3% increase in government expenditures and investment.
US Industrial Production Growth Slows but Remains Positive
Following two quarters of exceptionally strong annualized growth—43.3% and a revised 9.5% in the third and fourth quarters of 2020, respectively—US industrial production grew by a more modest 2.5% in the first quarter of 2021.
The output of consumer goods improved by 2.5% in the first quarter of 2021 on a seasonally adjusted annualized basis. On a non-annualized basis, durable goods fell by 0.9% and nondurable goods production grew by 0.8% quarter over quarter. Growth in nondurable goods production was driven by strong increases in the production of clothing products, while durable goods production growth was held back by a decline in automotive production.
Figure 3. US Industrial Production: Change from Preceding Quarter (Annualized; %)
[caption id="attachment_126859" align="aligncenter" width="720"] Source: US Federal Reserve[/caption]
Stimulus Checks and Reopenings Cause US Personal Consumption Expenditures To Shoot Up
Driven by stimulus checks and easing Covid-19 restrictions, US real personal consumption expenditures (PCE, or consumer spending) rose at an annual rate of 10.7% in the first quarter of 2021, following a 2.3% rise in the final quarter of 2020. Both goods and services spending saw growth, though the former contributed the majority to the sharp rise in spending. Goods spending rose by 23.6% after falling 1.4% the previous quarter, while services spending rose by 4.6% following similarly moderate 4.3% growth in the fourth quarter of 2020.
Within goods spending, durable goods posted far stronger growth than nondurable. Durable goods spending rose by 41.4% after declining by 1.1% the quarter prior, while nondurable goods spending grew by a still-strong 14.4% after a decline of 1.6% the previous quarter. For much of the quarter, Covid-19 cases were at almost record highs in the US, pushing stimulus-driven spending to goods rather than services—a pattern that is likely to reverse in the second quarter and beyond as cases decline and restrictions on activities ease.
Figure 4. US Real-Terms Personal Consumption Expenditure: Change from Preceding Quarter (Annualized; %)
[caption id="attachment_126860" align="aligncenter" width="720"] Source: Bureau of Economic Analysis[/caption]
China’s Year-over-Year GDP Growth Soars but Quarterly Growth Decelerates
In the first quarter of 2021, China’s economy grew 18.3% year over year, representing the fourth straight quarter that the country has experienced positive economic growth—but narrowly missing consensus expectations of a 19% increase. On a year-over-year basis, growth accelerated sharply from single-digit growth seen in the previous quarter, which can be attributed to weak 2020 comparatives for the first quarter. As part of its latest five-year plan, the Chinese government expects GDP growth to reach 6% over the course of 2021.
Figure 5. China GDP: YoY % Change
[caption id="attachment_126861" align="aligncenter" width="720"] Source: National Bureau of Statistics of China[/caption]
The Chinese economy has already recovered and grown substantially from pre-pandemic levels, but growth does appear to be decelerating on a quarter-over-quarter basis. This quarter represented the lowest quarterly growth rate since the beginning of the pandemic.
China’s Industrial Production Continues To Accelerate
Over the first quarter, Chinese industrial production grew 24.5% year over year, driven by especially strong growth in January and February against weak comparatives in 2020. January and February’s industrial production rose by 35.1%, while March saw growth of 14.1%. Manufacturing and manufacturing of high-tech goods each saw very strong growth, rising by 27.3% and 31.2% year over year, respectively. Mining and quarrying production saw slightly more tempered growth of 10.1%
Figure 6. China Real-Terms Industrial Production: YoY % Change
[caption id="attachment_126862" align="aligncenter" width="720"] Source: National Bureau of Statistics of China[/caption]
China Real-Terms per Capita Expenditure Far Outpaces 2020 Levels
China’s first-quarter per capita expenditure in real terms rose by 17.6% year over year and was up 8.0% compared to the same period in 2019—which fell prior to the pandemic. Rural households boosted their spending slightly more than their urban counterparts, increasing expenditure by 16.3% versus urban households’ 12.2% increase.
Recovering from a historic slide in 2020, education, culture and recreation spending saw the sharpest increase in the first quarter, rising 55.7% year over year. Every other category of expenditure, except for spending on residence, also saw double-digit growth, with miscellaneous goods and services seeing the second-strongest growth among the categories, at 24.2%.
Figure 7. China Real-Terms per Capita Expenditure: YoY % Change (Accumulated)
[caption id="attachment_126863" align="aligncenter" width="720"] Source: National Bureau of Statistics of China[/caption]
We anticipate that second-quarter expenditure growth will be far more modest due to more demanding 2020 figures—but we expect to see growth nevertheless. The first stage of Chinese economic recovery was largely driven by increased government investment, while later stages of the rebound are likely to be fueled by rises in consumer spending.