Source: Company reports/Coresight Research
Restructuring Driving Improved Results
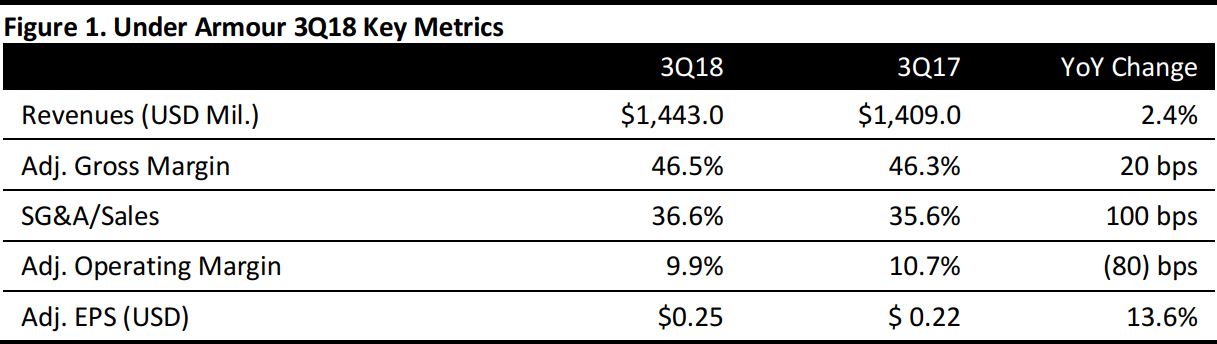
Under Armour reported a 2.4% 3Q revenue increase to $1.4 billion, driven by strong international momentum in the wholesale channel, with EMEA, Asia-Pacific and Latin America reporting sales gains of 15.4%, 14.6% and 15.8%, respectively. North America, Under Armour’s biggest region and accounting for 73.4% of 3Q revenues, experienced a 1.6% sales decline, as the company’s commitment to maintaining premium positioning resulted in fewer planned promotions during 3Q and slowed DTC growth. North America segment profits grew rapidly with about one-third fewer promotions, up 17.7%, and the segment margin expanded 120 basis points (bps) to 7.3%.
Apparel,Under Armour’s largest product category representing 67.8% of 3Q sales, grew 4.2% to $978.4 million; footwear sales were flat at $285 million and accessories sales declined 5.9% to $116.2 million. Connected Fitness revenues rose 20.2% to $32.2 million and licensing revenues dropped 8.6% to $31.4 million.
The company’s adjusted gross margin increased by 20 bps, driven by product cost improvements and lower promotional activity, offset by channel mix. Attention to better costing with vendor consolidation and pricing—from initial ticket price to promotional and markdown cadence—is beginning to impact profitability.
SG&A expense as a percentage of sales increased 100bps, reflecting investments in DTC, footwear and international businesses.
Under Armour has made impressive progress with its restructuring plan announced in August 2017. Supply chain lead times are shorter, SKU count is down about 40% and raw materials—zippers, buttons, trims—SKU count is down 80%, and the vendor base is down about 25%, all resulting in a less complex and more efficient business model. Under Armour sees the opportunity for further vendor consolidation.
At the same time, a brand segmentation strategy is underway, differentiating Under Armour product across categories, genders, countries, regions and channels.
Inventories decreased by $7.5 million, or 1%, to $1,173.1 million on a year-over-year basis.
Adjusted EPS of $0.25 rose 13.6% from $0.22 and compare with the consensus estimate of $0.12.
At quarter end, Under Armour operated 230 Factory Houses and 80 Brand Houses versus 210 and 70, respectively, a year ago. Store openings were focused internationally, up 32 net locations to 68 Factory Houses and 65 Brand Houses. In North America, two Factory Houses opened in the past twelve months for a 12 total, and four Brand Houses were closed, for a total of 15.
Outlook
- The company expects to incur approximately $200–$220 million in pre-tax restructuring and related charges; through 3Q, $154 million pre-tax costs were recognized, including $24 million in 3Q.
- Revenue is expected to increase approximately 3%–4% reflecting a low-single-digit decline in North America and international growth of approximately 25%.
- From a product perspective, apparel is expected to grow at a mid-single-digit rate, footwear at a low single-digit rate, and accessories is expected to decline at a mid-single-digit rate.
- Gross margin is expected be flat to down slightly versus the prior year rate of 45.0%. Adjusted gross margin is expected to improve slightly compared to 2017 as benefits from product costs and lower planned promotional activity are offset primarily by inventory management actions.
- Operating loss is now expected to be approximately $50–$55 million versus the previously expected $60 million loss. On an adjusted basis, operating income is now expected to reach the $150–$165 million range versus the previous $140–$160 million range.
- Interest and other expense net is expected to be approximately $50 million, up slightly from the previous $45 million expectation due to foreign currency headwinds.
- Due to a one-time tax benefit related to an inter company asset sale, the full year adjusted effective tax rate is now expected to be 13%–15% versus the previous expectation of 25%–27%. This equates to approximately $0.02 of diluted EPS benefit in 2018.
- Excluding the impact of the restructuring efforts, adjusted diluted EPS is now expected to be $0.19–$0.22 versus the previous expectation of $0.16–$0.19.
- Capital expenditures are now planned at approximately $175 million versus the previous $200 million expectation.
- Year-end inventory for 2018 is expected to be flat to down slightly.