Top 12 Retail & E-commerce Trends
1. National Retail Federation (NRF) lowered retail forecast in the U.S. in July. Global consumer confidence rose
Retail sales growth in 2014 is expected to be lower than anticipated in the U.S., according to an updated forecast by the National Retail Federation, which blamed the weakness on severe winter weather.
The association now estimates 2014 retail sales will increase 3.6%, down from the January forecast of 4.1% growth. Growth this year is expected to accelerate in the back half of the year, as the NRF says consumers will begin to feel more optimistic about their spending decisions. The NRF estimated that sales in the first half of the year grew 2.9%. The updated projection from NRF comes after its mid-july projection that overall back-toschool (K-12) sales would slip just a bit to $26.5 billion compared to last year.
The Nielsen Global Consumer Confidence Index rose 1 point in the second quarter to 97, according to the survey conducted between May 12 and 30. The reading headed closer to 100, signaling increased optimism among consumers.
Exhibit 1: Nielsen Global Consumer Confidence Index
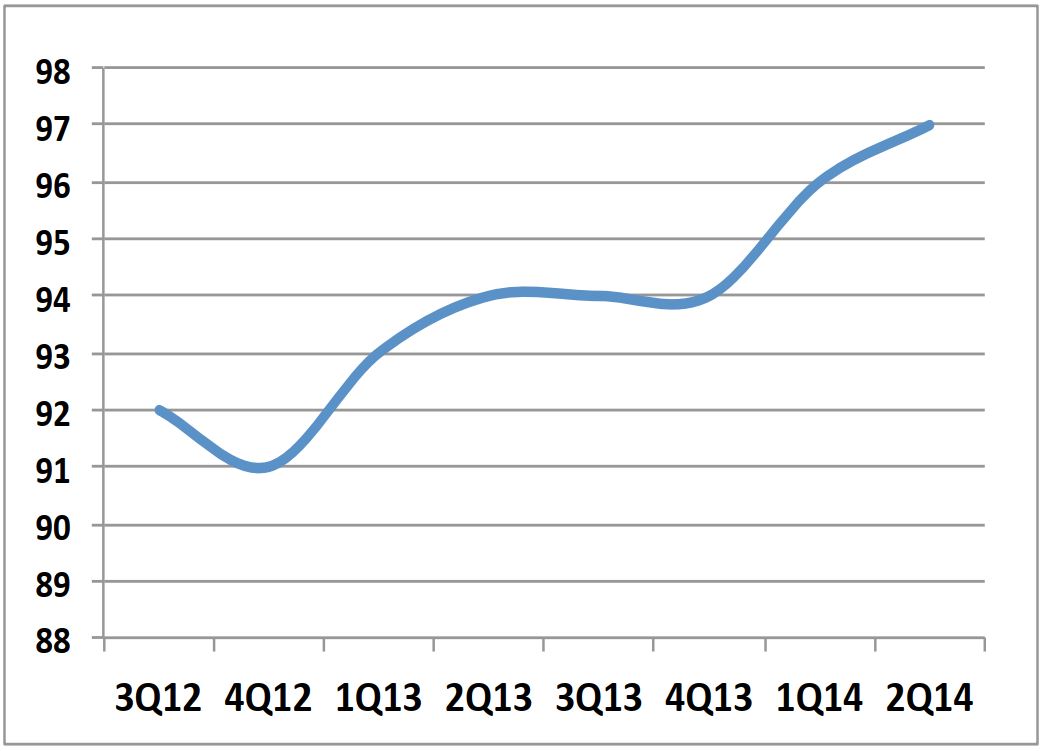
Source: Nielsen Global Survey of Consumer Confidence and Spending Intentions
India overtook Indonesia as the most optimistic consumer market, while Portugal and Slovenia were the most pessimistic.
Japan and Hong Kong saw the biggest declines in confidence from the previous quarter.
2. Demand for plus-sizes is surging globally
Sizes 14 and up, the ‘plus-sizes’ is a growing market for fashion retailers. In fact, the average American woman wears a size 14. Improved designs and on trend styles would go far with this fashion-starved shopper. Real white space!
Since 1992, people aged 20 and older in countries such as the U.S., the U.K., Germany, France and Australia all have an average Body Mass Index (BMI) above 25, which is considered overweight. The trend suggests that the average BMI in some of these countries will soon approach 30, or obese (Exhibit 2).
Exhibit 2: Mean Body Mass Index (age-standardized estimate) and world apparel fiber consumption
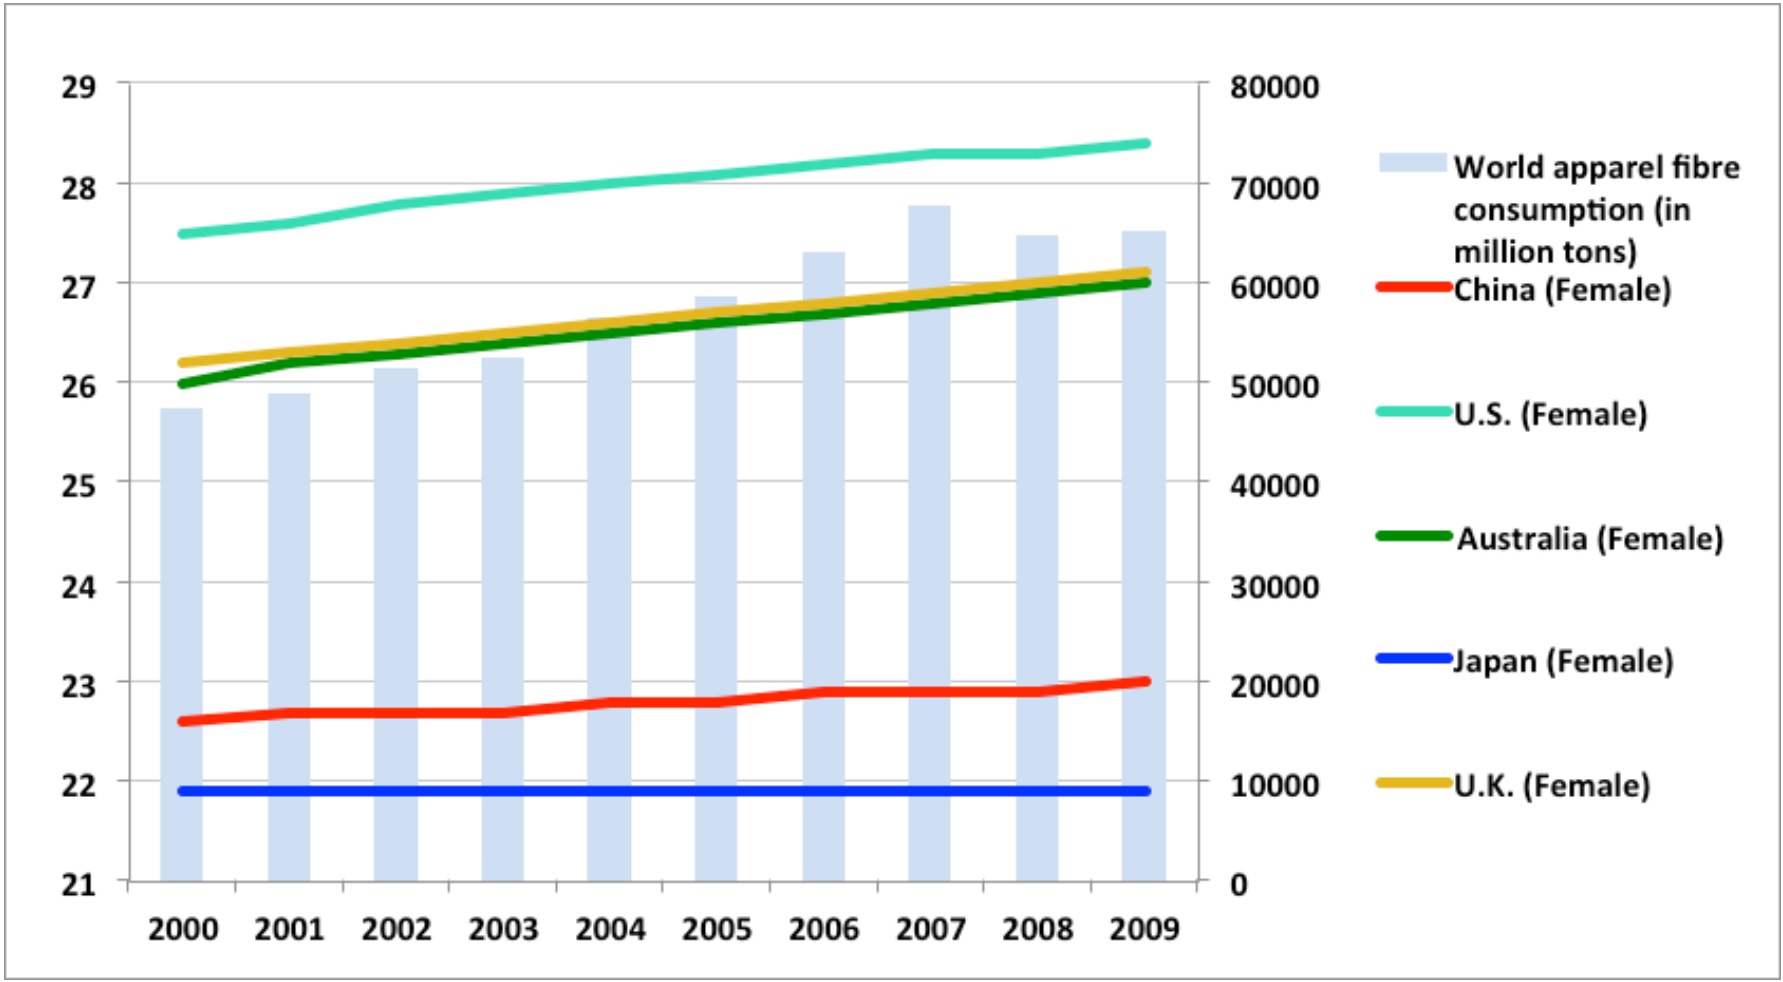
Source: World Health Organization; Food and Agriculture Organization of the U.N.
Plus-sized women’s clothing generated a whopping $16.2 billion in sales for the year ended November 2013, up 7.2% from the year-ago period, according to market research firm the NPD Group.
The demand is not limited to women: men, teenagers and children all need bigger clothes. Accessories (like purses, jewelry and shoes) all need to be bigger to fit right and look good on a larger frame.
Unmet apparel needs in the plus-size market likely increase sales of accessories.
3. Shift in consumption patterns due to aging population worldwide. This includes a greater need for anti-aging products, a focus on health & lifestyle related products and a shift away from appearance
A Nielsen report on global aging shows certain store features or services “don’t meet or only partially meet the needs” of aging consumers. For example, only 37% of respondents believe stores provide adequate handicapped ramp and door access, and only 34% believe aisles are sufficient for handicapped accessibility. Improving access could remedy store traffic and ultimately drive purchases as this older demographic has both the time and the funds to shop.
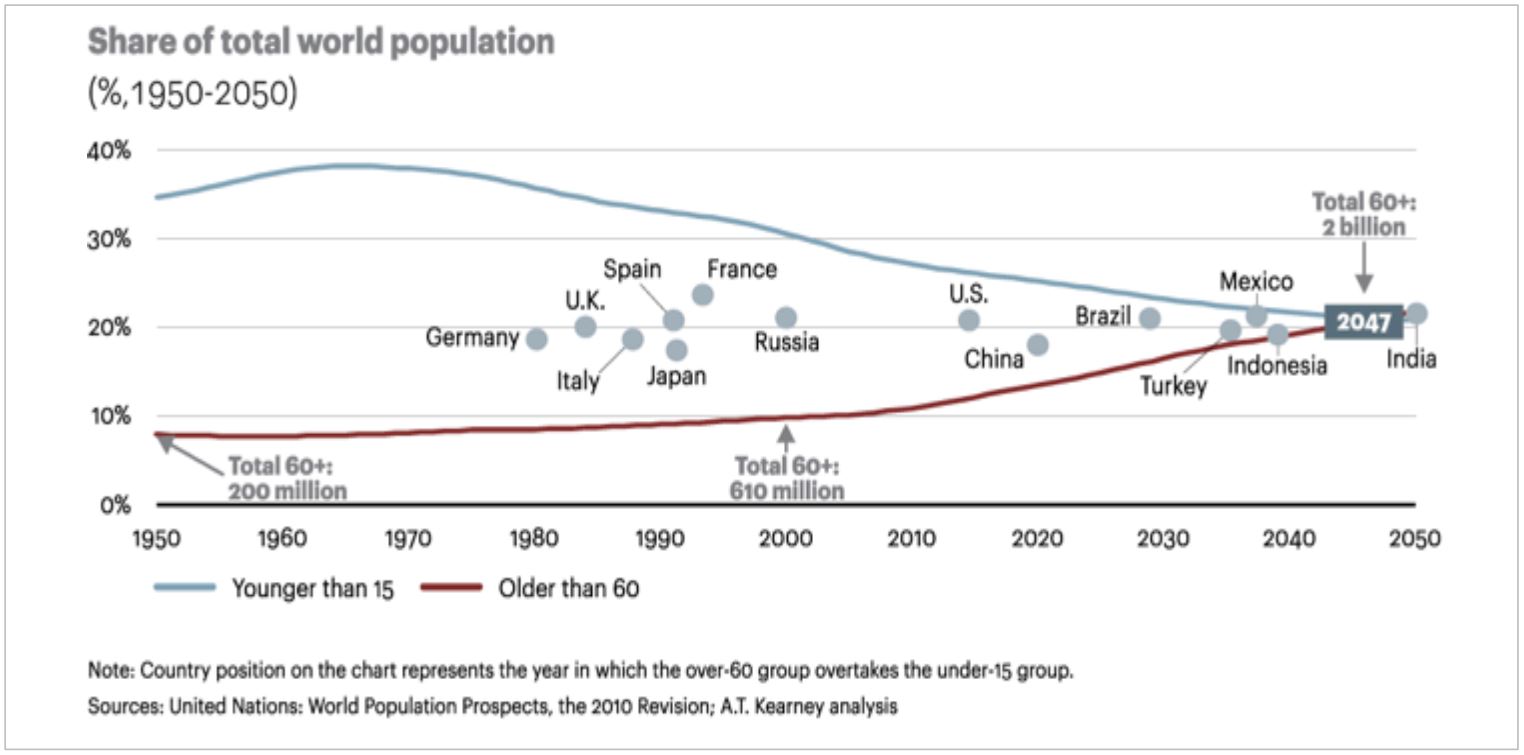
Mature consumers spend proportionally less of their income on clothing and transport than those under 60. They purchase more food, beverages, and non-prescription health products. In total, they buy fewer items but tend to spend more per item. Overwhelmingly, they seek quality products, are loyal to brands, and are not particularly price-sensitive— even if their incomes are below the mean. This trend is more pronounced as they age. (Exhibit 3)
Exhibit 3: By 2047, there will be 2 billion mature consumers worldwide
But, at the same time, if you can win the hearts of the baby/child, their parents and grandparents will follow.
4. Technology savvy Millennials are looking for sales online and offline
Their “tribe” is global so dressing like their peer group is less important as their peers aren't necessarily seeing them in the ’hood. Brands that benefit from global “tribe” are lifestyle based, action, and outdoors sports related.
Millennials are 2.5 times more likely to embrace technology than older generations. iMedia Connection urges marketers to look at new technology such as signage to connect with this demographic, reporting that they are 77% more likely to be influenced by in-store kiosks and 38% of Millennials are influenced by in-store signs or displays, compared to 28% of the general population. Above all else, Millennials care about living life to the fullest. Their constant connection to social media means constant judgment. Social media is less about keeping in touch with friends and more about documenting noteworthy experiences through text and pictures. They feel pressured to invest unceasing time and energy into their Internet Egos. In posting selfies, statuses, and viral content, they seek approval and admiration. They will often mimic the most 'liked' users in their network to achieve it.
Millennials tend to shop for cheaper options at discount stores and browse online for coupons. In the latest National Retail Federation (NRF) monthly survey, discount stores rank the number one destination for back-to-school shoppers. According to the same survey, Millennial consumers are often shopping for sales regardless of channels.
Exhibit 4: By 2047, there will be 2 billion mature consumers worldwide
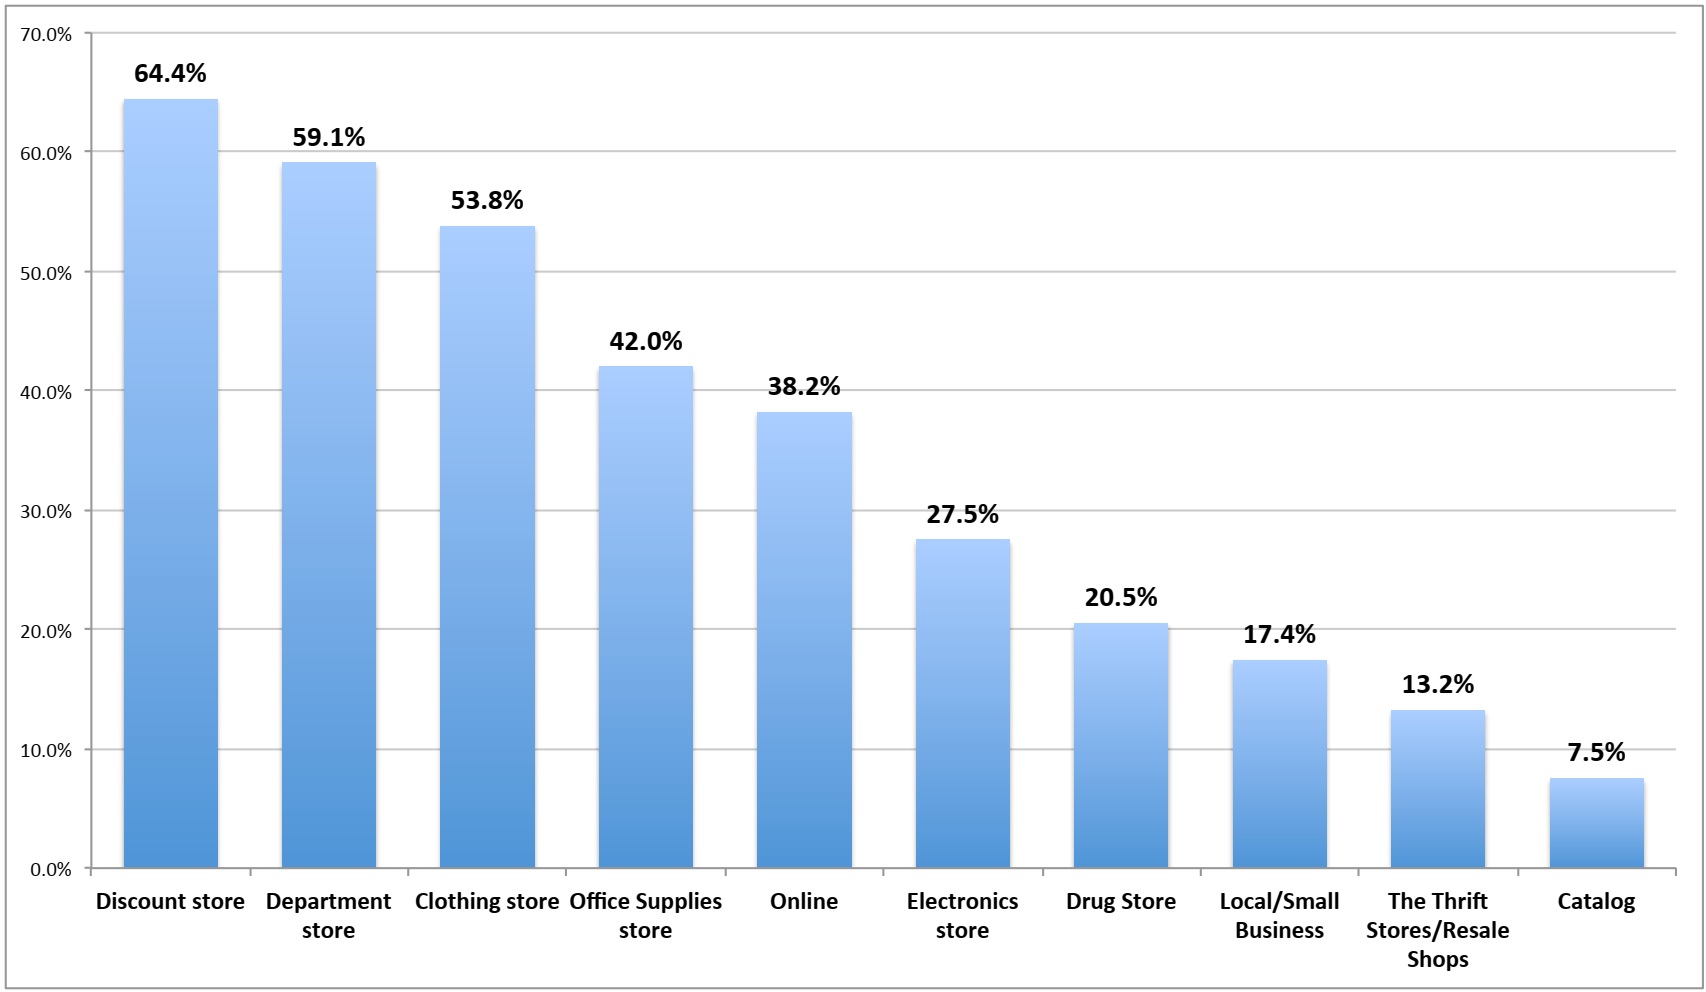
In addition to preferences for discount stores, they are looking for a seamless and 24/7-access shopping experience. While it is true that Millennials often shop online, this generation also enjoys shopping at brick-and-mortar stores, providing the option of “touch it and feel it.”
5. Consumers looking for unique self- expression seek customization in fashion and footwear
Design your shoes at Nike and Vans, add your initials at Louis Vuitton, color your polo insignia at Ralph Lauren.
Amazon announced a new 3D Printed Products store which launched with more than 200 print-on-demand designs. Users can customize items like earrings, pendants, rings and bobble head dolls using a special widget, before having the item 3D printed and delivered.
Amazon is by no means first to offer 3D printed items for sale. A plethora of websites like Shapeways, i.materialise and Thingify offer a variety of 3D printing options. Depending on the focus of the site, users can upload and print their own design, buy items designed by others, and/or customize those items. Many of the sites offer a community aspect too.
In the age of social media, only personalities and hot brands sell.
Brands and retailers must leverage on the power of design to enable their customers to express themselves through the products.
6. Greater focus on experiences - travel vacations and spas vs. products
The fastest growth in luxury is in experiences, destination vacations, fine dining, sporting events and concerts. So smart retailers are at the destinations and make the experience even better.
That’s one of the key findings in Luxe Redux: Raising the Bar for Selling of Luxuries, a June 2012 report on global luxury markets from The Boston Consulting Group (BCG). Experiential luxury now makes up almost 55% of total luxury spending worldwide and, YOY, has grown 50% faster than sales of luxury goods. Even in brand-obsessed China where personal luxury goods serve as a strong badge of status and success, experiential luxury sales growth outpaces sales growth of luxury goods products.
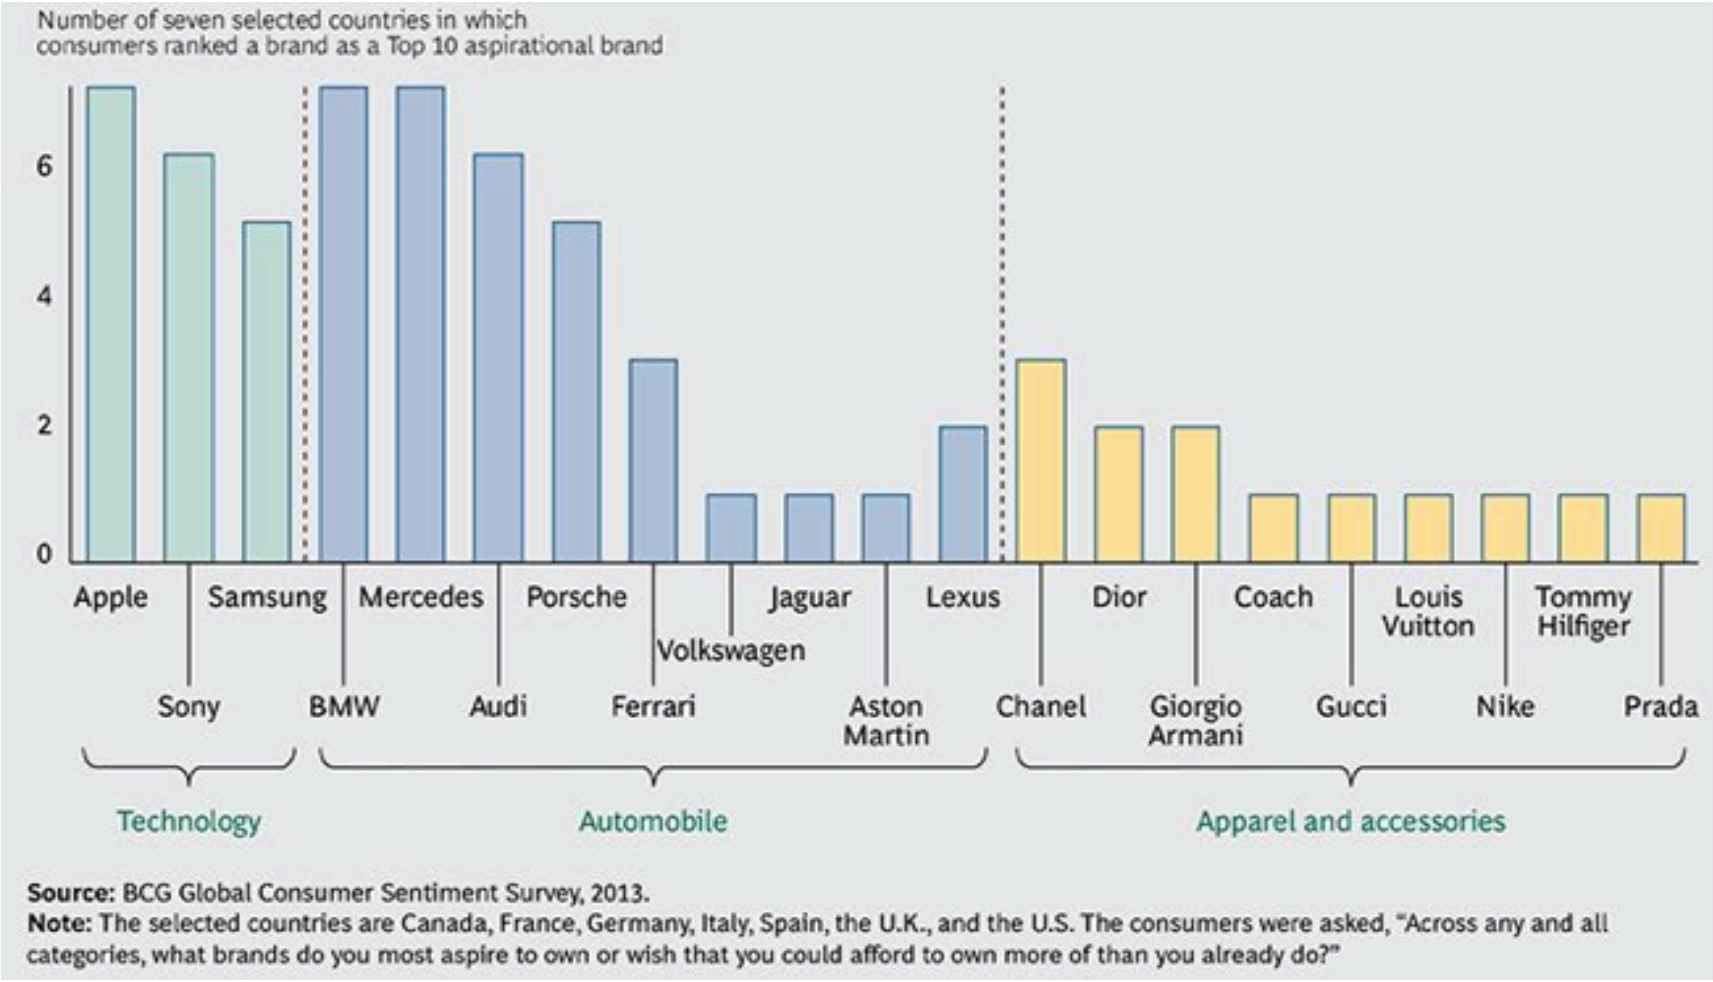
We see luxury shoppers continuing to enjoy experiences that make them feel pampered. Luxury-goods players will have to move quickly to benefit from the ‘experience’ trend. To date, very few have been successful in adding experiential elements to their offerings, websites, or in-store execution. While the lack of such experiential elements may not yet be penalizing financial results among luxury providers, it certainly is a missed opportunity to connect with their consumer and ultimately boost performance. Experience-related items and events are more aspirational than products, apparel and accessories. (Exhibit 5)
Exhibit 5: Many auto and technology brands are top aspirational brands among select consumers
7. Growing trend in cross-border e-commerce
Cross-border shopping represented 16% of all online sales in the U.S., the U.K., Brazil, Germany, China and Australia in 2013, and is expected to grow by 200% in the next five years, according to Nielsen. By 2018, there will be 130 million online cross-border shoppers, spending nearly $307 billion.
Exhibit 6: Growth trend of cross-border e-commerce spending (in billions)
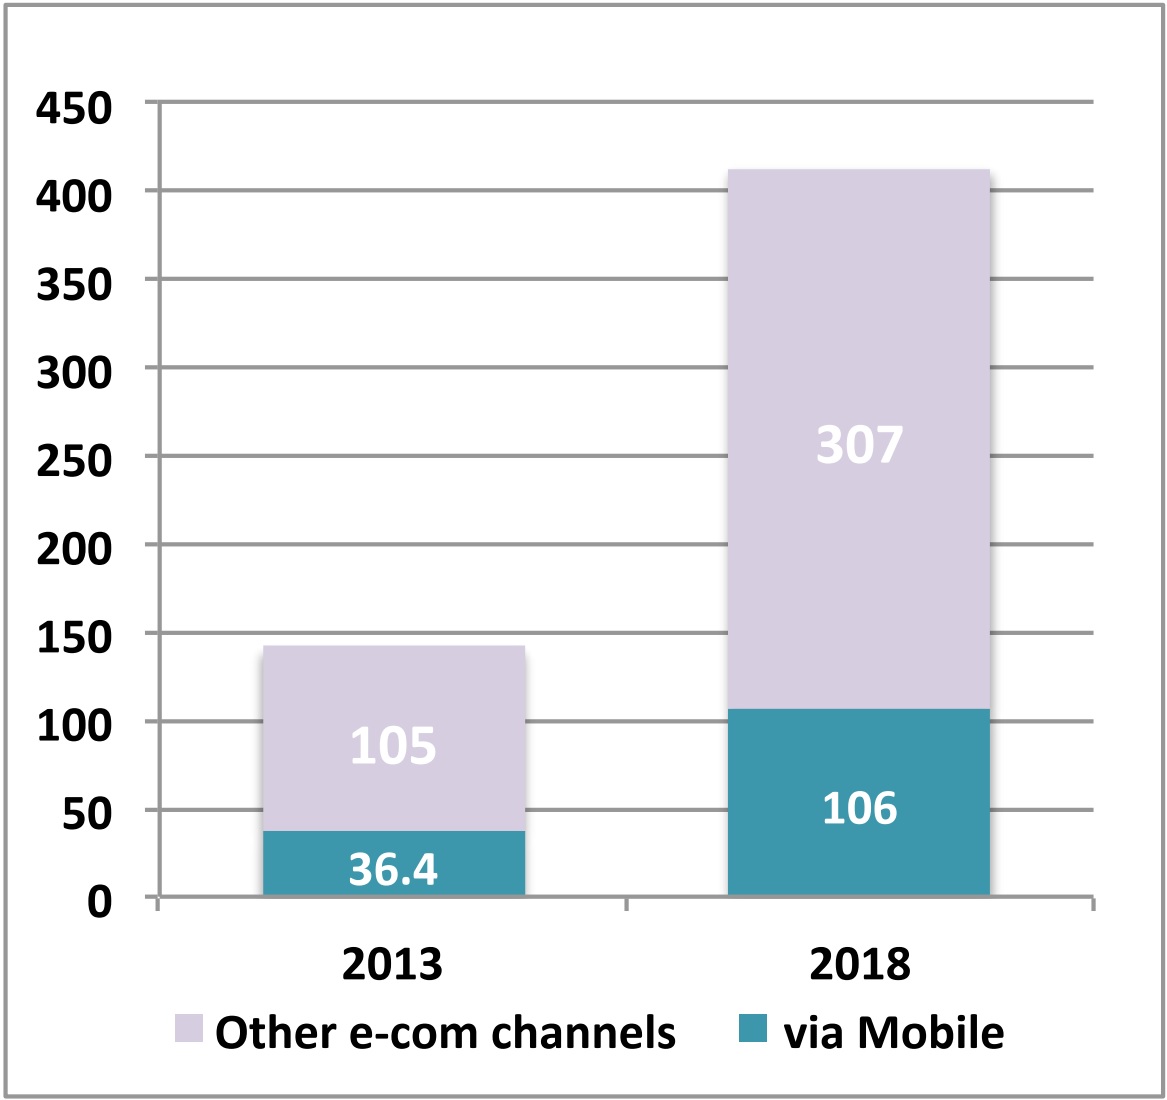
Source: “Modern Spice Routes: The Cultural Impact and Economic Opportunity of Cross-Border Shopping", Nielsen (commissioned by PayPal)
The greatest growth is coming from China, where middle-class consumers are willing to pay a premium to purchase quality products directly from overseas.
To cash in on this trend, U.S. and U.K. retailers have to provide more efficient international logistics support, more payment options, and better language supports.
Retailers must adapt their supply chains for a market that is becoming increasingly friendly towards global and cross-border e- commerce.
8. E-commerce leading to more rational purchase decisions
A.T. Kearney’s online study of 3,200 U.S. and U.K. consumers, published in October 2013 , found that 40 % of survey respondents reported spending more money than planned in retail stores, while only 25% reporting doing so when shopping online. (Exhibit 7)
Exhibit 7: Consumers spend more money when shopping in brick-and-mortar stores
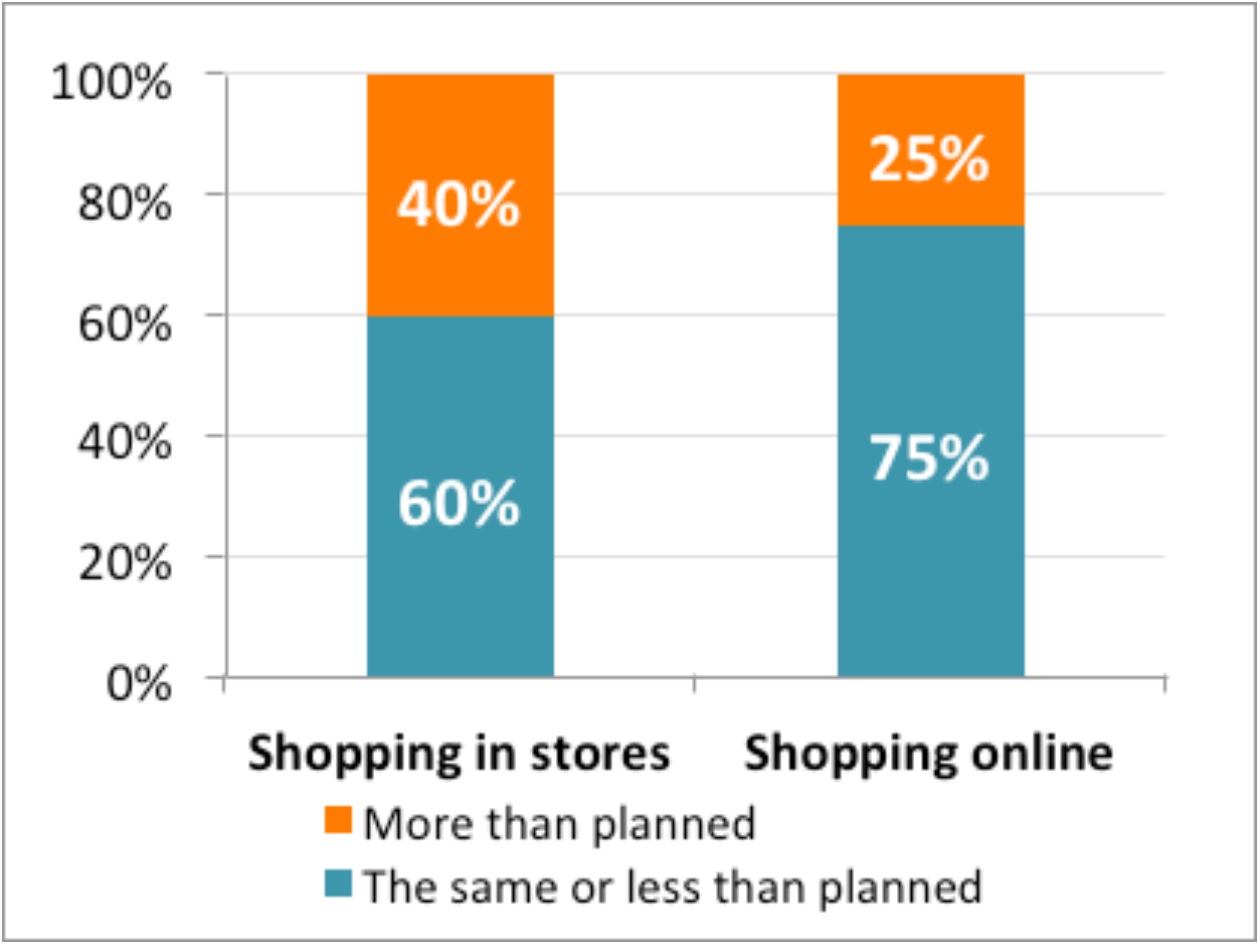
Source: A.T. Kearney Future of Stores study, 2013
Omnichannel retailers can facilitate online impulse purchase with flash sales, ship to store for pick up and (free) return to store services.
9. M-commerce will soon dominate the e-commerce space
In the U.S., about 25% of e-commerce activities were conducted from smartphones and tablets in Q1 of 2014, and the number is growing rapidly. In addition to site visits, mobile payments are also a big area of growth. According to Forrester Research, mobile payments will amount to $90 billion in 2017. (Exhibit 8)
In 2014 we anticipate retailers will take big strides to meet the $90 billion estimate by adopting solutions such as PayPal, Google Wallet, Square Wallet, Dwolla, and more.
ComScore data suggests that time spent with mobile applications exceeded time spent accessing the internet from desktops in January 2014. Data from Flurry and ComScore reveal mobile device users spend 32% of their time on games, the largest category in terms of time use.
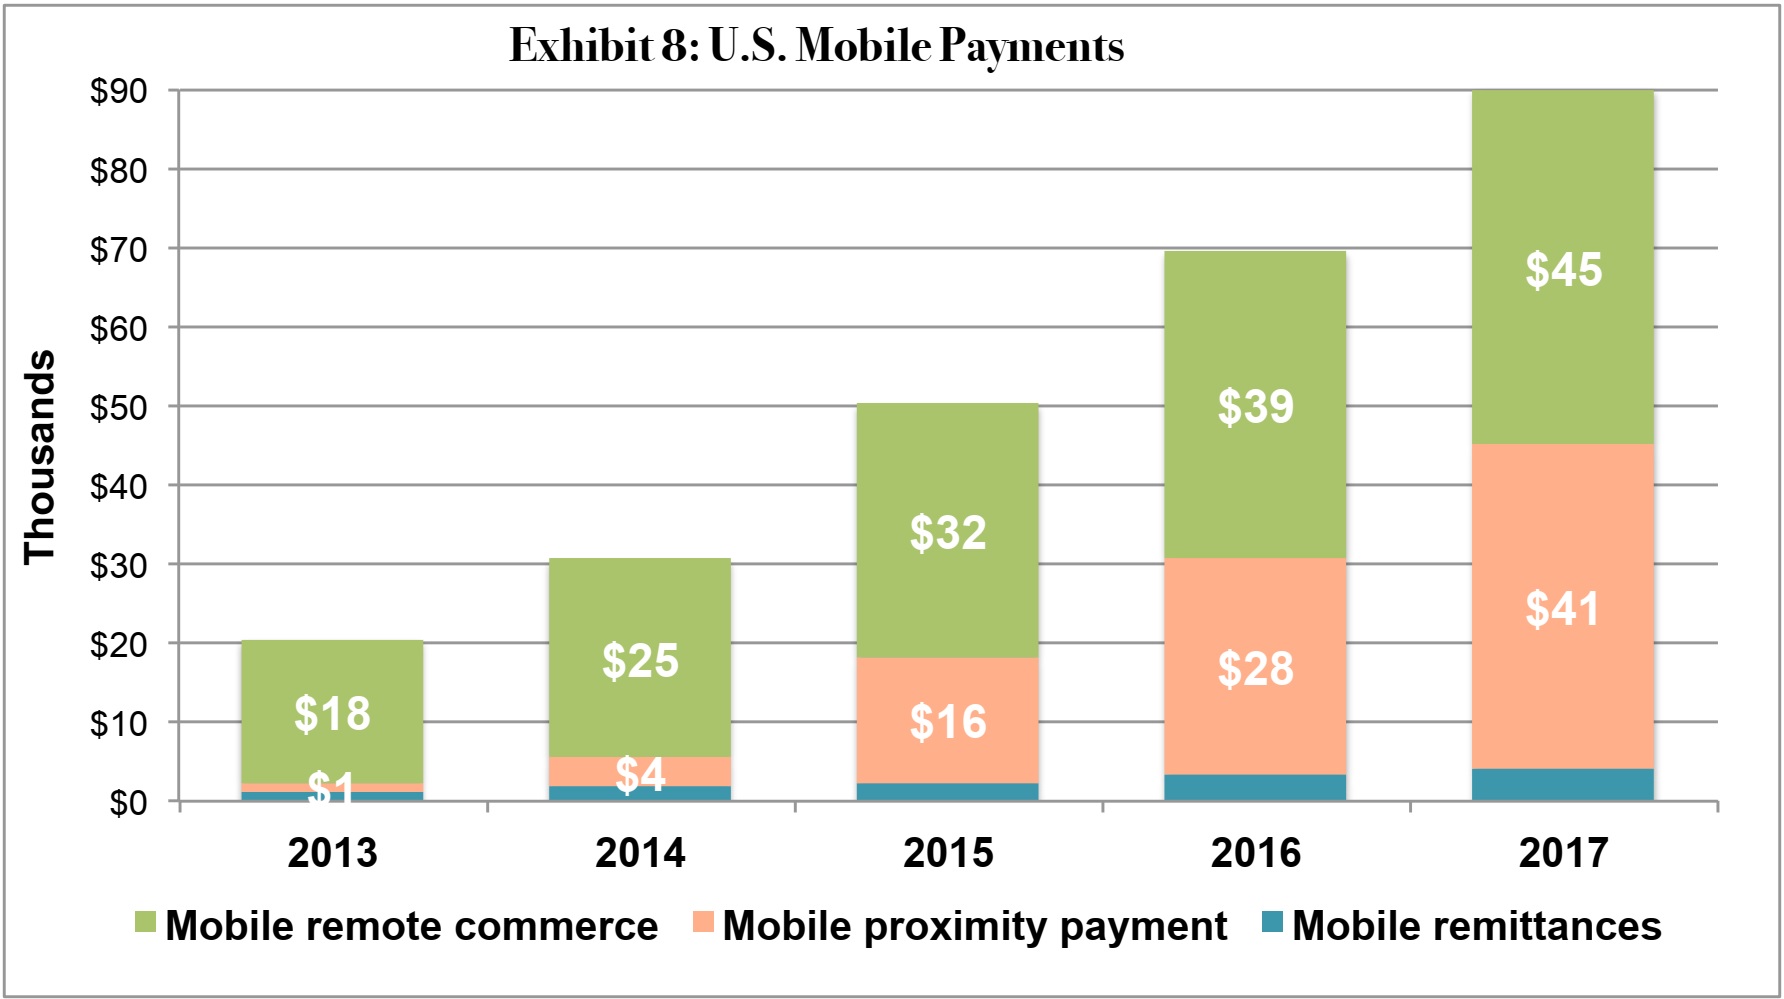
Source: Forrester Research
10. Brick-and-mortar stores are fighting back with webrooming
Many young people prefer to purchase in physical stores, but only after previously (comparison) shopping the products they are interested in on the Internet. This practice is called webrooming, or reverse showrooming.
The Local Search Study found that nearly 80% of local searches on mobile devices in the U.S. turned into purchases (78% for phones and 64% for tablets), with nearly 90% of those purchases being in a physical store (73%) or on the phone (16%) vs. online (11%). (Exhibit 9)
Similarly, a Harris poll in the U.S. found that 69% of people webroom, while only 46% showroom.
Retailers can proactively turn online searches into brick-and-mortar sales by overall coupons that can be downloaded onto mobile devices.
Retailers have to perform cross-collaboration/pollination with tech companies to fully utilize opportunities presented by omni-channel retailing.
Exhibit 9: Growth trend of cross-border e-commerce spending (in billions)
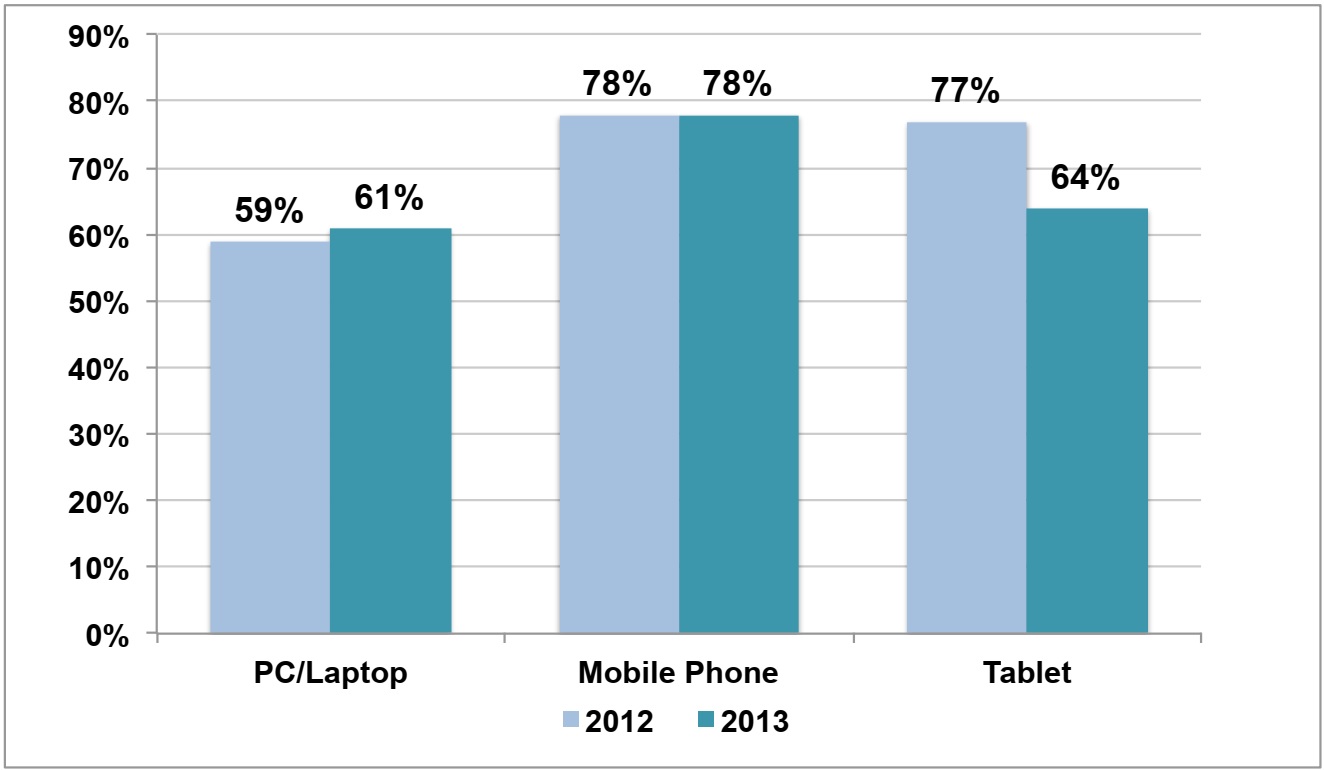
Source: The Local Search Study, conducted by comScore, Neustar Localeze and agency 15 Miles
11. Increased gaming on the internet means less time for shopping
According to Nielsen, the average U.S. gamer aged 13 or older spent 6.3 hours a week playing video games during 2013. This is up from 5.6 hours in 2012, which was up from 5.1 hours in 2011. This significantly reduces the amount of time available for shopping. (Exhibit 10)
Retailers have to rethink their ad placement strategies to increase their exposures in the online/mobile gaming platforms.
Retailers should also gamify their e-commerce experiences. Examples of e- commerce sites that tie branding and gaming together include the Home Shopping Network, which has a full suite of arcade games on its website; and Japan’s Hatakeppi, which allows players/consumers to run virtual farms online and buy real agricultural projects at the same time their virtual crop grows.
Exhibit 10: Growth trend of cross-border e-commerce spending (in billions)
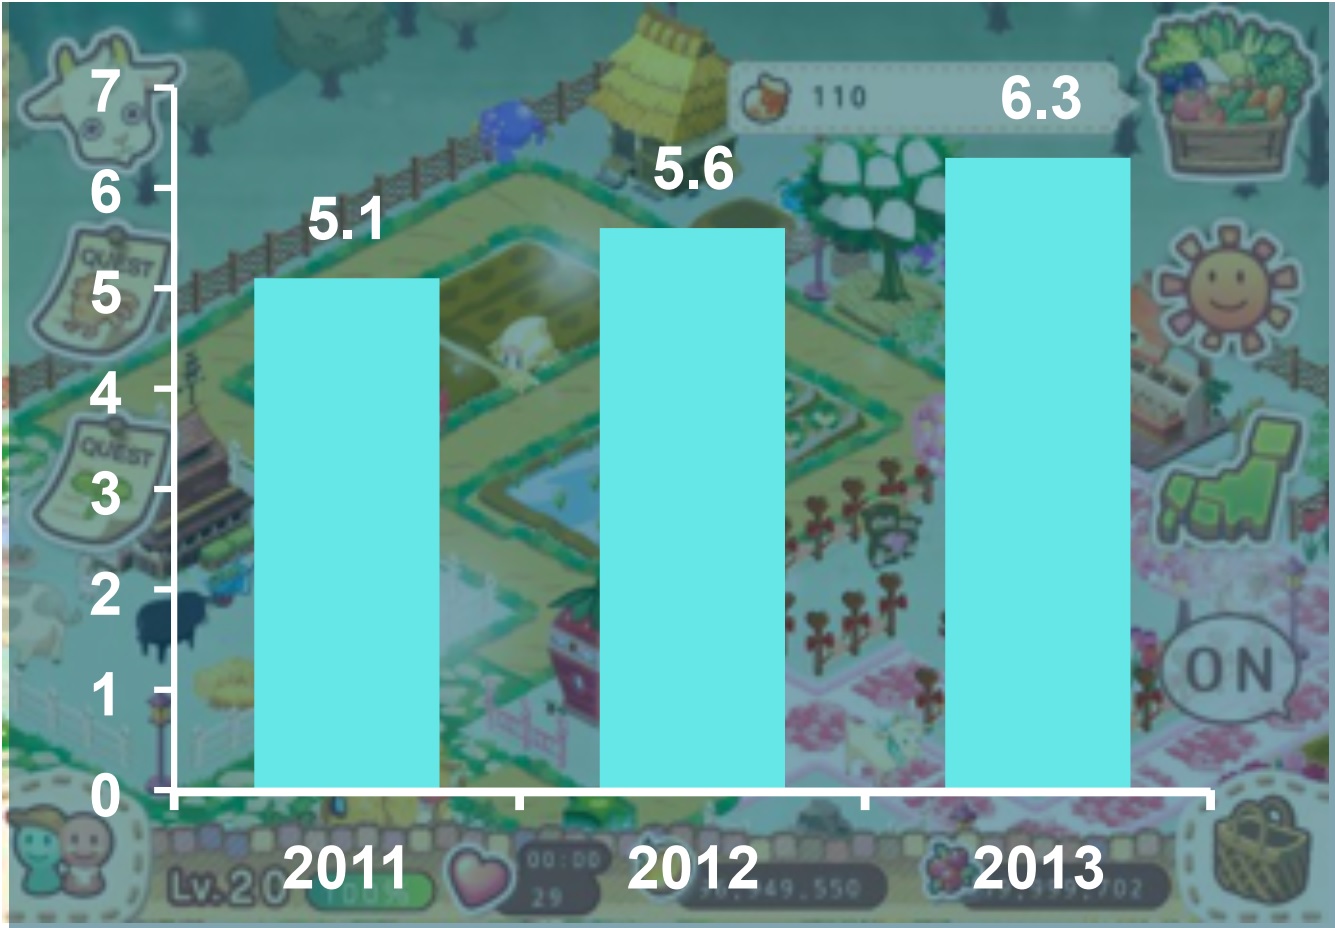
Source: Nielsen 360º Gaming Report
12. Sales of expensive luxury goods still suffering in China
Purchases made by Chinese consumers now represent roughly one third of total worldwide sales for luxury companies. But growth is decelerating, significantly impacting results. Sobering Q2 results published on July 24 by LVMH revealed sales growth of only 3%, versus analyst expectations of 5 to 6% and down from the 14% sales growth the group reported for Q1 of 2012. Second quarter sales growth at Louis Vuitton in Mainland China has all but collapsed, dropping from 9% in Q1 2014 to no-growth for Q2.
A crackdown on official gift-giving and the softening economy have deeply affected ostentatious gift-giving and expensive purchases in general. According to the World Luxury Association, sales of its members in China plunged over 50% YOY on average in 2013, a far cry from 30% YOY growth in 2012.
Jewelers are suffering too – Chow Tai Fook, the world's biggest jewelry chain, is expecting sales to “slow down this fiscal year, amid the ongoing austerity drive and economic uncertainties in China”, reported Ryan Huang, a market strategist at IG.
In this context of falling demand and greater global transparency, ongoing price inflation and continued pricing disparity put luxury brands on a collision course with Chinese consumers’ willingness to pay, a risky strategy.
Bring in the bride and others will follow.