 Source: Company reports/Coresight Research
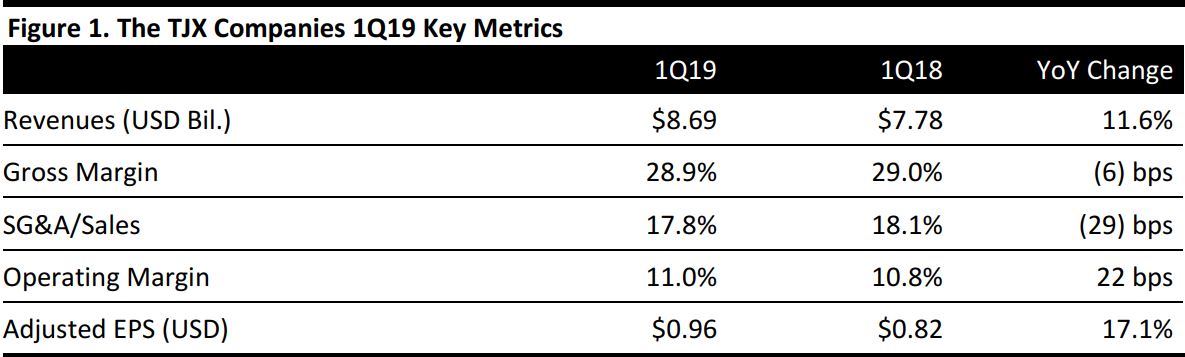
Fiscal 1Q19 Results
The TJX Companies reported fiscal 1Q19 revenues $8.69 billion, up 11.6% year over year and beating the consensus estimate of $8.47 billion.
Adjusted EPS was $0.96, below the consensus estimate of $1.02. This figure excludes a $0.17 benefit that was primarily due to the lower US corporate income tax rate. GAAP EPS was $1.13, compared with $0.82 in the year-ago quarter.
Details from the Quarter
Management commented that both comps and EPS exceeded its own expectations.
- The company reported 3% comp growth versus 1% growth in the year-ago quarter and ahead of the 2.5% consensus estimate.
- Customer traffic was again the primary driver of comps in all four large divisions.
- The company ended the quarter with a total of 4,141 stores (an increase of 71 stores year over year) and 111.7 million gross square feet of selling space (up 1.4 million square feet from the year-ago quarter).
Results by Segment
Marmaxx
- Marmaxx reported 4% comps versus 0% comp growth in the year-ago quarter.
- Management attributed comp growth to consumers being drawn to great fashions and brands at outstanding values.
- The company ended the quarter with a total of 2,304 T.J. Maxx and Marshalls stores (an increase of 19 stores from the year-ago quarter).
HomeGoods
- HomeGoods reported 2% comps versus 3% comps in the year-ago quarter.
- The company ended the quarter with a total of 690 HomeGoods stores (an increase of 23 stores from the year-ago quarter).
TJX Canada
- TJX Canada reported 3% comps, flat versus the year-ago quarter.
- The company ended the quarter with a total of 466 Canadian stores (an increase of 12 stores from the year-ago quarter).
TJX International
- TJX International reported 1% comps versus 0% comp growth in the year-ago quarter.
- The company ended the quarter with a total of 645 stores in Europe and Australia (an increase of 12 stores from the year-ago quarter).
Outlook
For FY19, management expects:
- GAAP EPS of $4.75–$4.83, up 18%–20% year over year, compared with the $4.84 consensus estimate.
- Adjusted EPS of $4.04–$4.10, excluding an expected benefit of approximately $0.72–$0.73 per share primarily due to the lower US corporate income tax rate.
- Wage increases to hurt EPS growth by 2%.
- Comp growth of 1%–2%.
For fiscal 2Q19, management expects:
- GAAP EPS of $1.02–$1.04, compared with the $1.25 consensus estimate.
- Adjusted EPS of $0.87–$0.89, excluding an expected benefit of approximately $0.15 per share primarily due to the lower US corporate income tax rate.
- Restructuring costs for the IT department to hurt EPS growth by 3%–4%.
- Wage increases to hurt EPS growth by 2%.
- Foreign currency to help EPS growth by approximately 4%.
- Comp growth of 1%–2%.