Source: Company reports/Coresight Research
Fiscal 4Q18 Results
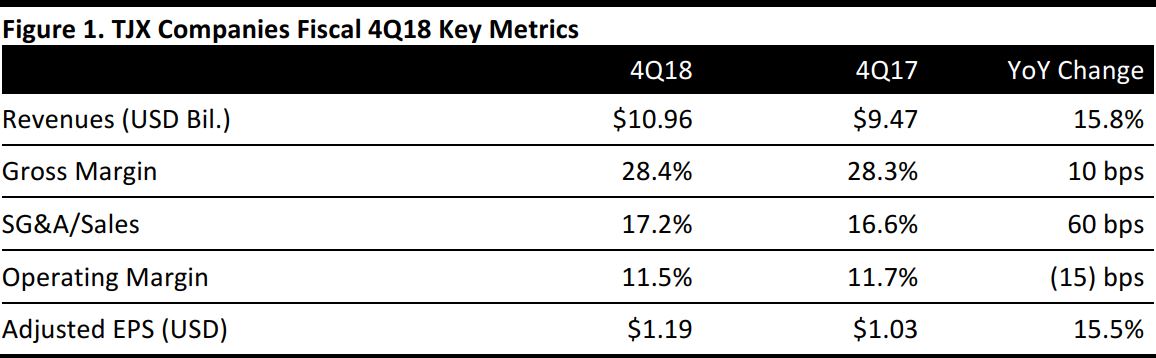
TJX Companies reported fiscal 4Q18 revenues of $10.96 billion, up 15.8% year over year and above the $10.76 billion consensus estimate. Adjusted EPS was $1.19, below the $1.27 consensus estimate and up from $1.03 in the year-ago quarter.
Comp sales were up 4% from the year-ago quarter versus guidance of 1%–2% and the 2.1% consensus estimate. Comp growth was driven by increases in customer traffic across the company’s store brands and by strength in both its apparel and home businesses.
At the end of the fourth quarter, consolidated inventories on a per-store basis (including inventories held in warehouses, but excluding in-transit and e-commerce inventories) were up 4% in constant-currency terms, versus a 4% decrease in the prior-year period.
Management noted its continued strategy to reinvest in the business, including in store growth, supply chain and infrastructure, technology, associate training and upgrading the shipping experience for customers.
The retailer ended the year with 4,070 stores in nine countries, including 667 HomeGoods, four HomeSense, 1,223 T.J.Maxx, 1,062 Marshalls and 27 Sierra Trading Post stores in the US.
Performance by Segment
- Marmaxx: Revenues were $6.7 billion in the quarter, up 11.1% year over year. Comps were up 3%, flat versus the year-ago quarter.
- HomeGoods: Revenues were $1.6 billion in the quarter, up 21.1% year over year. Comps were 3%, compared with 5% in the year-ago quarter.
- TJX Canada: Revenues were $1.1 billion in the quarter, up 24.6% year over year. Comps were 7%, compared with 4% in the year-ago quarter.
- TJX International: Revenues were $1.6 billion in the quarter, up 26.5% year over year. Comps were 3%, compared with 2% in the year-ago quarter.
FY18 Results
TJX Companies reported full-year revenues of $35.9 billion, up 8.1% year over year. Adjusted EPS was $3.85, versus $3.53 in the previous year. Comp sales for the year were up 2%, compared with the previous year’s 5% increase.
Outlook
Management provided the following guidance:
- FY19 adjusted EPS of $4.73–$4.83 (including a benefit of $0.73–$0.75 due to the 2017 Tax Cuts and Jobs Act). The consensus estimate for full-year adjusted EPS is $4.67.
- 1Q19 adjusted EPS of $0.85–$0.87 (which includes the benefit of the tax overhaul). The consensus estimate for first-quarter adjusted EPS is $0.97.