Source: Company reports/Fung Global Retail & Technology
2Q16 RESULTS
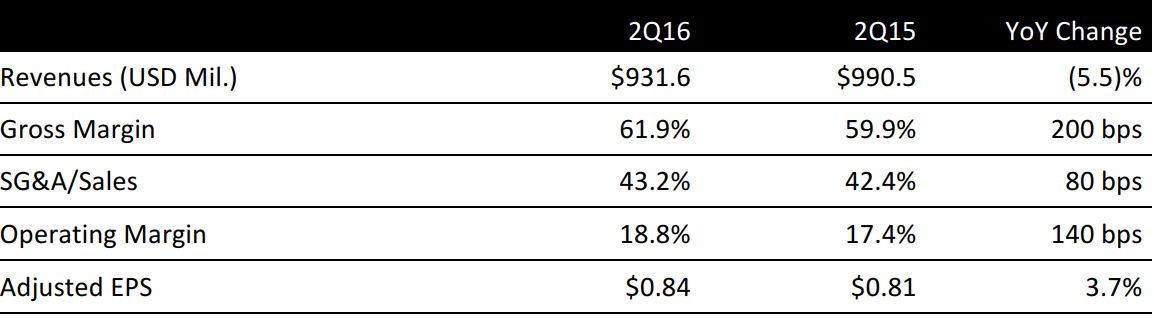
Tiffany & Company reported 2Q16 adjusted EPS of $0.84 versus the consensus estimate of $0.72. The upside was driven by better gross margins, which were up 200 basis points year over year based on lower product input costs, changes in product sales mix and price increases in the past year.
Total revenue was $931.6 million versus expectations of $932.7 million. Comps were down 9% on a global basis, driven by a 9% decline in the Americas, a 9% decline in the Asia-Pacific region, a 3% decline in Japan and a 13% decline in Europe. Other comps were down 22%, driven by lower sales in the UAE and an increase in wholesale diamonds. Management attributed the declines in sales to both local customers and foreign tourists in most regions.
Management attributed the declines in the US to lower spending by US customers as well as by Chinese and other foreign tourists. Sales growth in China and South Korea was offset by continuing significant declines in Hong Kong and more moderate declines in most other markets.
Tiffany opened four company-operated stores in the second quarter and closed one existing location. At the end of the period, the company operated 311 stores: 125 in the Americas, 83 in the Asia-Pacific region, 55 in Japan, 43 in Europe, and five in the UAE. A year ago, it operated 304 stores: 124 in the Americas, 79 in the Asia-Pacific region, 56 in Japan, 40 in Europe and five in the UAE.
2016 OUTLOOK
Management reiterated its prior guidance. EPS for the full year is expected to decline by a mid-single-digit percentage from last year’s $3.83. Sales are expected to decline by a low-single-digit rate year over year.
Gross retail square footage is projected to increase by 2% through 11 store openings, six relocations and 10 store closings.
Operating margins are expected to be below the prior year’s 19.7%. Free cash flow is projected to be at least $400 million and capital expenditure is expected to be $260 million.