
THE SILVER OPPORTUNITY HAS ARRIVED
The era of the silver generation has arrived. Silvers, or people aged 65 and above, are driving a hugely disproportionate share of consumer-spending growth in many key regions globally. In some markets, they are driving nearly all such growth. This trend will continue for the next 20 years, and it is being fueled by two related forces. The first is demographics, as the silver population is growing considerably faster than other age groups are. The second is economics, as silvers hold a disproportionate share of wealth globally.
This is not a homogeneous group, however. The characteristics that typify 65–74-year-olds look very different from those of the 85-and-older group. These days, people in the younger silver set behave much like their younger selves. They are fairly healthy, many are still working and their attitudes have not changed yet. But by the time silvers turn 85, their health typically has deteriorated significantly, and their attitudes and spending habits reflect that change. Those in the middle, the 75–84-year-olds, tend to fall into one or the other of these two groups; the shift usually occurs when their health begins to deteriorate noticeably.
The size and growth rate of silver populations—and of the subgroups within them—vary considerably across key regions. Japan, South Korea and Western Europe have much older populations than many other areas have, and growth of the 75–84-year-old group will be modest in these regions, while growth of the over-85 segment will begin to accelerate. India, Southeast Asia and South America still have young populations, and the growth of the silver demographic relative to the rest of the population in these areas will be lower.
The best opportunities for businesses targeting these consumers will occur in North America and China, which are both in the early stages of the graying of their populations.
In this report, we outline the demographic changes ahead, consider silvers’ characteristics and spending patterns, and examine how the aging population will impact four major industries, two of which—retail and leisure services— are at least partly discretionary and two of which—healthcare and assisted living—are essential.
I. DEMOGRAPHICS
According to the UN’s Population Division, seniors aged 65 and over will grow from 8% of the world’s population in 2015 to 13% in 2035, and account for over one-third of total population growth through 2035. The global population of those aged 65 and older is projected to grow more than 4.5 times faster than the nonsenior population over the next 20 years.
There are currently more than 500 million silvers globally; that number is expected to grow to nearly 750 million in 2025 and to over 1 billion in 2035. There is a clear demographic division, however, between more developed and less developed nations—growth rates are higher in less developed nations, but from lower base figures, whereas the proportion of seniors is higher in more developed nations. Falling global birth and death rates have driven this aging trend; since the 1950s, both measures have fallen consistently.
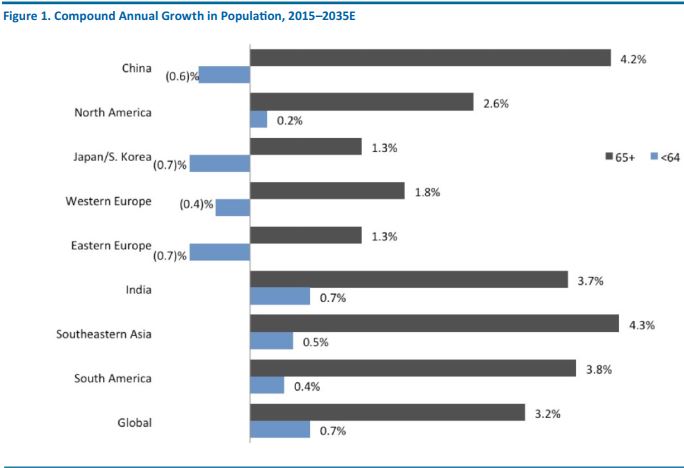
Source: UN, Department of Economic and Social Affairs,
Population Division/Fung Global Retail & Technology

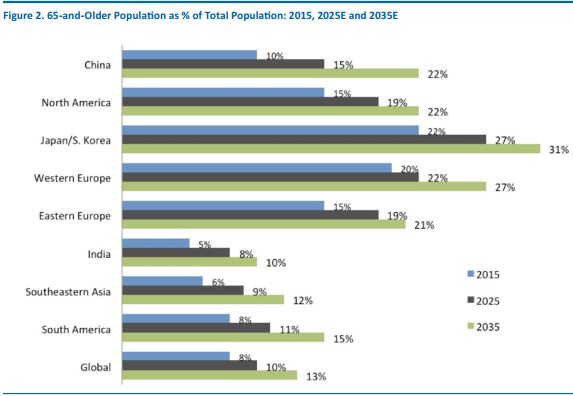
Source: UN, Department of Economic and Social Affairs,
Population Division/Fung Global Retail & Technology
Disproportionate growth in the silver demographic will drive disproportionate spending growth among age groups. According to McKinsey & Company, seniors aged 60 and older will drive more than 45% of consumption growth in North America and nearly 60% in Western Europe, Japan and South Korea over the next 15 years.
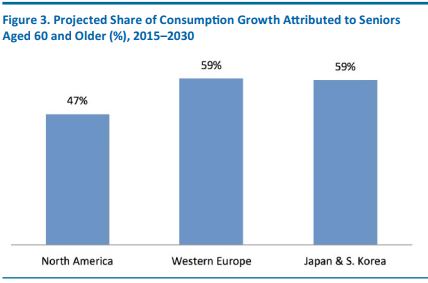
Source: McKinsey & Company
McKinsey also projects that, in the US, people aged 60 and older will drive 45%–50% or more of consumer household spending growth from 2015–2030 in a wide range of consumer categories, including personal care products and services, housing, food, entertainment, and transportation. Even in apparel, they are expected to drive 39% of growth, despite comprising only 18% of the population, on average, over this time period. What is probably less surprising is McKinsey’s projection that silvers will generate 69% of growth in healthcare spending.
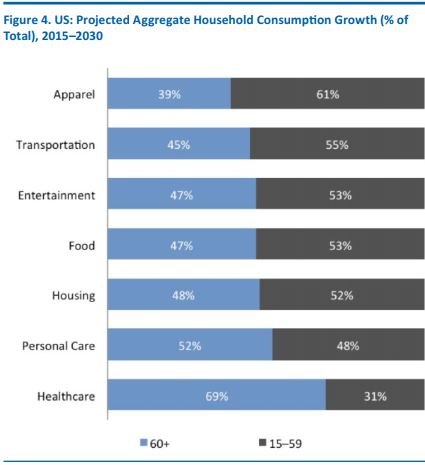
Source: McKinsey & Company

The Oldest Segment Will Grow The Fastest
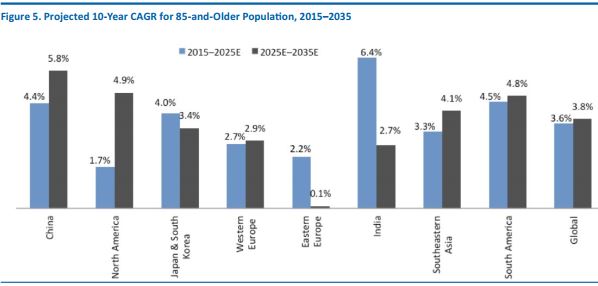
Across the coming two decades, the 85-and-older age group is expected to grow faster than the 65–84 age group.
According to the UN, the number of seniors aged 85 and older will more than double over the next 20 years, to about 111 million people, but from a relatively small base. This represents nearly 4% compound annual growth, which is higher than the 3% projected growth rate of 65–84-year-old group.
The 85-and-older segment will grow from 0.7% to 1.3% of the global population between 2015 and 2035. While these numbers are small, they are greater as a proportion of total population in developed markets, and that is where the major opportunities with silvers reside
Source: UN, Department of Economic and Social Affairs,
Population Division/Fung Global Retail & Technology
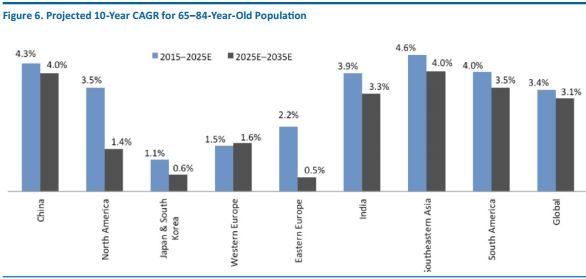
The number of seniors aged 65–84 is also expected to double over the next 20 years, adding more than half a billion people globally to the demographic. This represents over 3% compound annual growth, which is slightly slower than the over-85 segment’s projected 4% growth but higher than the 1% projected growth for the under-65 group.
As a result, the 65–84 segment will grow from 8% to 13% of the global population between 2015 and 2035. The highest growth rates will be seen in developing regions, including China, India, Southeast Asia and South America.
Source: UN, Department of Economic and Social Affairs,
Population Division/Fung Global Retail & Technology
Younger Versus Older Silvers
From ages 65–74, seniors look a lot like their pre-senior selves. Sure, they are Does the difference in population growth between younger silvers and their older counterparts matter? We think so—because of the attitudinal and behavioral differences between younger and older silvers. As we explore in this section, those at the younger end of the silver spectrum, the 65–74-year-olds, typically behave and spend quite differently than older silvers do.
From ages 65–74, seniors look a lot like their pre-senior selves. Sure, they are likely to have retired or transitioned to a new career or job that provides them more leisure time, but most other aspects of their lives are very similar to those of their earlier years. First off, because they are staying put.
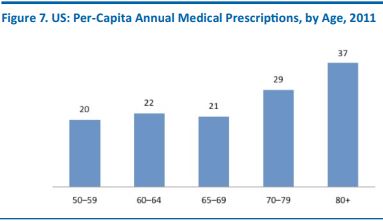
In fact, the downward migration trend in the US that begins in the post-college years, when moving rates peak, continues all the way into people’s mid-70s. While some US seniors do move to warmer climates, only around 5% of the group moves each year, and this includes local moves to smaller residences. Seniors also tend to remain in fairly good health from ages 50–69, with their need for prescription drugs staying fairly stable during those years.
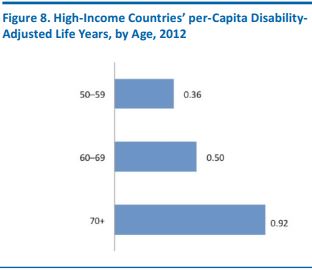
By the time silvers reach age 85, though, their attitudes and spending will have changed dramatically. This shift is driven primarily by deterioration in their health, which creates a ripple effect in a number of areas. Health deterioration is more common as individuals reach their mid-70s. The World Health Organization estimates that the number of years per capita lost to disability and disease nearly doubles for seniors over 70 compared to those in their 60s. Deteriorating health among the oldest silvers impacts spending on items such as food and entertainment, which falls considerably due to a combination of increased health expenses (in some countries) and decreased desire and ability to shop and enjoy other recreational activities. Per capita, US consumers aged 80 and older receive 70% more prescriptions than those in their 60s do.
Older silvers are much more likely to move, either to a senior facility or closer to their children: in the US, nearly 10% of seniors over age 75 move annually.
These data underline the distinctions that need to be made when considering silvers as a target consumer group. The “negative” story is that older silvers are much less likely to be in good health, and so are less likely to be consumers of discretionary goods and services. The “positive” story is that younger silvers differ relatively little in health terms from those in the age group beneath them (i.e., those in their 50s and early 60s). In reaching the more valuable 65–74 segment, marketers must avoid characterizing silvers as being less able, less mobile or afflicted with health conditions.
Source: IMS Health/US Census Bureau
Source: World Health Organization
Source: Centers for Medicare & Medicaid Services

FIVE NOTABLE CHARACTERISTICS OF SILVER HOUSEHOLDS
While recognizing the distinctions between younger and older silvers, we think silver households worldwide in more developed markets tend to share a number of common characteristics. These characteristics impact silvers’ demand for goods and services, their spending power, and the way they shop. The five notable features of older households are:
- They have fewer occupants than younger households have.
- They enjoy greater net wealth than younger households do and, more importantly, their share of wealth has been increasing in a number of countries.
- More of them are continuing to work past age 65.
- In Western markets, a clear majority of them are online, with younger silvers more likely to be online than older silvers.
- They continue to lag the overall population severely in terms of smartphone ownership, but are catching up, with younger silvers lead the charge.
1. Smaller Households
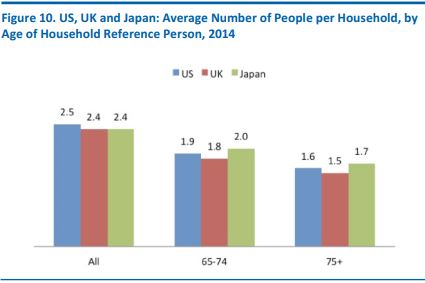
The absence of children and higher mortality rates inevitably mean older- person households are typically smaller than average. Yet single-person households do not predominate, even in the 75-and-older age bracket, as the average figures below show.
Silvers’ smaller average household size impacts not only how much they spend, but also where they shop—and it shapes the nature of senior consumers’ demands in retail. For example, in the grocery category, silvers typically have smaller basket sizes and show less demand for big, out-of-town superstores that offer near-endless choice and are set up to cater to big-basket shoppers.
Source: US Bureau of Labor Statistics/Office
for National Statistics (ONS)/Statistics Japan
2. Senior Households Are Gaining Share of Wealth
Older households tend to be wealthier, when measured by total assets—which is understandable and inevitable, given that most people accumulate assets over their lifetime.
What is more interesting is the disproportionate growth in the wealth of senior households seen in some countries. This tipping of the wealth balance from young to old has been fueled by changes such as the degradation of job security and opportunities, and the erosion of compensation and benefits for younger workers. The impact of the economic downturn, whether through government austerity or private-sector cutbacks, appears only to have amplified this disparity.
In the UK, for instance, there has been a striking shift of affluence to silvers. In part, this has been due to protection from government austerity measures that have hit other age groups. However, a bigger factor has been rising UK residential property prices, which have resulted in a shift of property wealth to older age groups. The figure below illustrates the widening gap between the total wealth of seniors and the overall population in the UK.
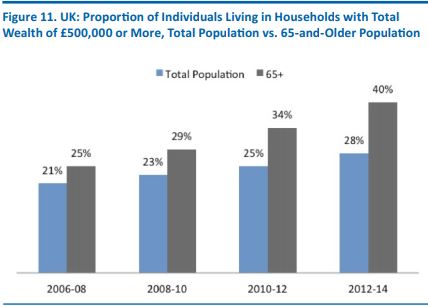
The periods covered are two-year periods, beginning July
and ending June. Source: ONS/Fung Global Retail & Technology
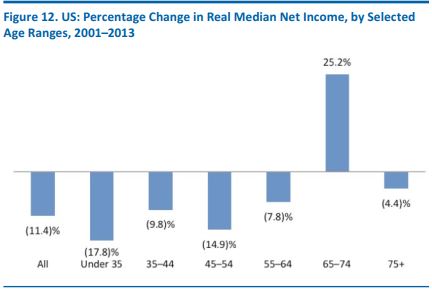
Seniors in the US have seen a similar insulation from the worst declines in income: data from the US Federal Reserve suggest that those in the 65–74 age group saw a boom in their real median net income between 2001 and 2013, while US consumers overall saw theirs fall.
We include the 55–64 age group in the graph below because that demographic is now entering retirement. The real income of this age group, and that of the oldest age group, has fallen. However, the declines those two groups have seen have been less severe than those experienced by US consumers on average— and much less severe than those experienced by people under 35 and those aged 45–54.
Source: US Federal Reserve/Fung Global Retail & Technology
Across countries, spending power has become increasingly weighted toward older age groups. Seniors who are employed have tended to enjoy greater job security and more in-work benefits (such as enrollment in final-salary pension programs) than younger age groups have. In retirement, many seniors have benefited from asset growth that has been fueled by low interest rates—although these low rates have hit people with savings—while, in many countries, their state-funded benefits have been ring-fenced to protect them from austerity measures.
3. More Silvers Are Remaining in the Workforce
Silvers’ incomes are also being boosted by increasing numbers of them staying in the workforce past the traditional retirement age. People aged 65 and older now lead healthier, more active lives than previous generations did at their age, and they face the increased financial pressures that come with the prospect of a longer retirement. Both factors have contributed to a steady increase in the number of seniors remaining in the workforce in countries such as the US and the UK.
In absolute terms, the number of people aged 65 and older in employment in the UK more than doubled between the start of 2005 and the end of 2015. In the US, the number of workers aged 65 and older increased by 1.1 million over the same period.

Western governments have tended to use various measures to encourage workers to retire later, helping to grow the number of silvers remaining in the workforce:
- Americans cannot receive full Social Security benefits until age 66, and if they wait until age 70 to retire, they can receive monthly payments that are up to 30% higher.
- n the UK, the default retirement age was removed in 2011, meaning companies could no longer automatically force employees to retire. Also in the UK, the age at which people can claim a state pension is set to rise from 65 to 66 in 2020, and then to 67 between 2026 and 2028.
- Similar changes are being implemented elsewhere, such as in Germany, where the retirement age is gradually being increased to 67.
- With barriers to work continuing to come down and governments encouraging consumers to work longer, we anticipate that the trend of silvers remaining in the workforce longer will continue.
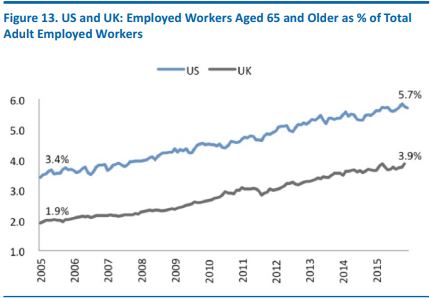
Source: US Bureau of Labor Statistics/ONS/Fung Global Retail & Technology

4. Silvers Are Online
Internet usage and online shopping participation rates are, naturally, lower among older age groups, as seniors did not grow up with the technology. The oldest age groups may not even have encountered it in the workplace. So, while one’s first reaction to the graphs below might be to compare seniors’ Internet use unfavorably with that of the general population, we think the data tell a more positive story:
- In developed economies, a clear majority of seniors are now online. In countries such as the UK and Germany, online penetration rates for seniors are now close to average penetration rates a few years ago.
- The gap between connectivity levels between silvers and the total population has narrowed significantly: in the UK, it narrowed from 40% versus 80% in 2010 to 70% versus 90% in 2015.
- Our European connectivity data covers those aged 65–74 only, while our US data refer to those aged 65 and older in total. The data indicate that the connectivity gap has narrowed more rapidly in Europe than it has in the US, providing further evidence that it is younger silvers who are driving the change.
In the major European markets, and notably in the UK, we have seen a similar closing of the e-commerce participation gap between 65–74-year-olds and the total population. In the UK, these younger retirees have been closing this gap by an average of three percentage points per year. If adoption continues at that pace, e-commerce participation rates between younger silvers and the UK average will equalize around 2021.
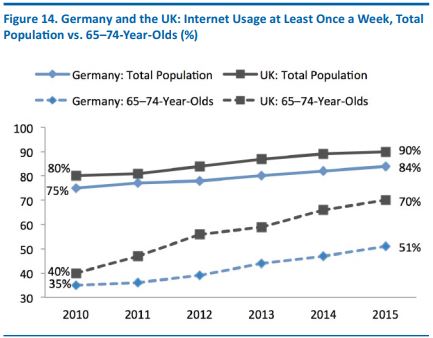
65–74 is the maximum age band for Eurostat’s data on Internet use.
Source: Eurostat
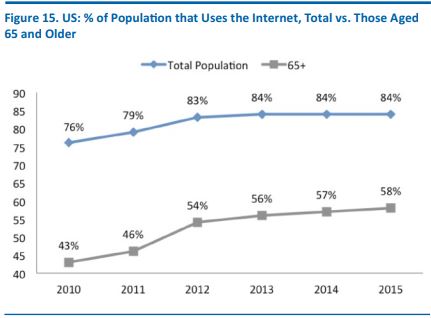
Source: Pew Research Center
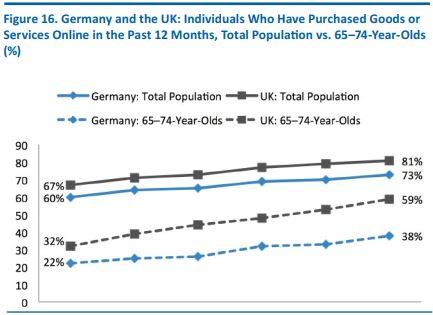
% of all individuals (i.e., not just % of Internet users).
Source: Eurostat
5. Silvers Still Lag in Smartphone Ownership
While seniors are starting to catch up with the general population in terms of Internet use and e-commerce, they continue to lag more substantially in terms of smartphone ownership—likely because the Internet has been around much longer than smartphones have been. In the US, just three in 10 seniors owned a smartphone in 2015, according to a Pew Research Center survey. However, we expect this gap in device ownership to narrow considerably in the coming years, for a number of reasons:
- A large majority of US seniors own a cell phone of some kind (78% in 2015), so this demographic definitely sees the value in mobile devices.
- The next generation of silvers (those who are currently aged 50–64) show close-to-average levels of device ownership.
- The gap between seniors and the total population is much lower in tablets (in the US), suggesting that many seniors also see the value in mobile Internet connectivity.
- In the recent past, the Internet connectivity gap between seniors and the overall population has narrowed in many countries, suggesting that we will see the same trend in smartphone ownership in the coming years.
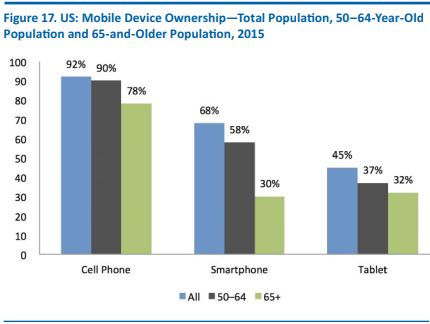
Smartphone data are based on a survey conducted June 10–July 12, 2015;
all other data are from a March 17–April 12, 2015, survey.
Source: Pew Research Center
Trend data from the Pew Research Center confirm that the gap is closing: the ratio of the average mobile device ownership rate to the silver ownership rate has narrowed from around 3:1 in 2011 to around 2:1 in 2015.
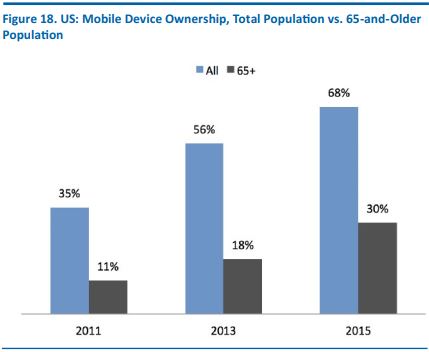
Source: Pew Research Center
A final point worth noting is that the smartphone ownership rate of consumers aged 65 and older shown above is almost certainly being pulled down by older silvers: as we have already noted, younger silvers (those ages 65–74) show a greater propensity to use technology. Supporting this are data for France, which show a rapid tailing off of smartphone ownership level among the oldest age group.
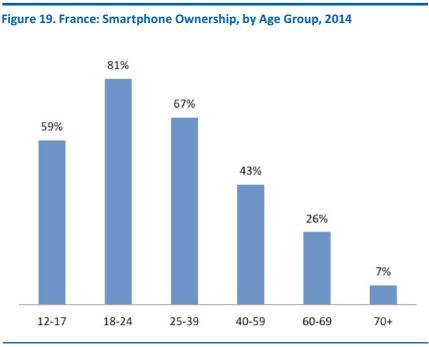
Base: 2,200 respondents aged 12 years and older Source: CRÉDOC

II. SPENDING BY SILVERS
We have already established that senior households typically hold a disproportionate share of wealth. But assets do not necessarily translate into disposable income, and disposable income does not necessarily translate into spending.
We have examined data on household spending, split by demographics, for five major economies, the US, the UK, Japan, France and Germany. Per household, the message is consistent: households headed by those aged 65 and over spend less than the average household, and households headed by those aged 75 and over spend much less.
In the US, for example, for every dollar that the average household spends, households headed by 65–74-year-olds spend just 91 cents, and households headed by those aged 75 and older spend just 69 cents.
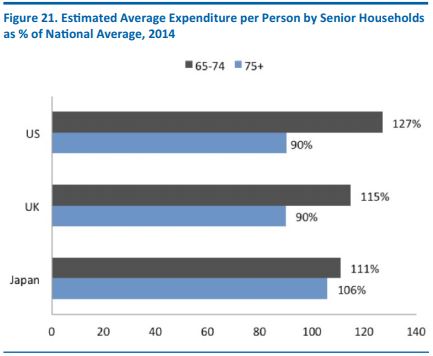
A major factor in this spending shortfall is the typically smaller size of senior households. Once we adjust for the number of people per household, younger silvers (those aged 65–74) overindex on spending relative to the average, while those aged 75 or older continue to underindex.
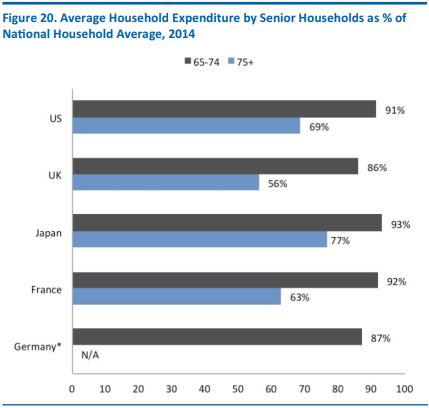
By age of “household reference person,” i.e., the head of the household
*Data for Germany are for all retired consumers.
Source: US Bureau of Labor Statistics/ONS/Statistics Japan/INSEE/
Statistisches Bun- desamt/Fung Global Retail & Technology
A significant caveat is that the average number of people per household for younger age groups includes children, who may each be expected to account for less spending than an adult. We have not adjusted for children in our calculations, given that there is no strong data available on the ratio of per- capita spending for a child versus an adult.
Below, we show data for the US, the UK and Japan, countries where the average number of persons per household is published in the spending breakdowns.
So, do silvers spend more or less than their younger counterparts? The answer is not clear-cut, largely due to the fact that most senior households do not include children. But our conclusion is that silvers’ spending holds up strongly against younger groups’ spending, especially when we consider two characteristics that typify seniors’ financial circumstances:
- Seniors’ incomes are typically lower than those of working-age consumers, meaning there is less for them to potentially spend.
- Many seniors are likely to be free of a major element of many consumers’ expenditure—mortgage payments—which should depress their total spending relative to mortgage holders.
Source: US Bureau of Labor Statistics/ONS/
Statistics Japan/Fung Global Retail & Technology
How Much Do Silvers Spend?
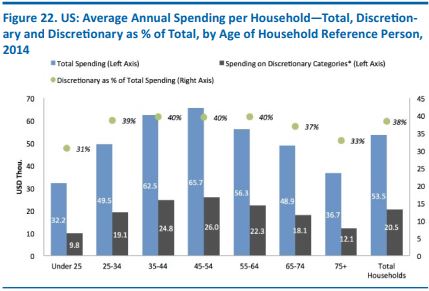
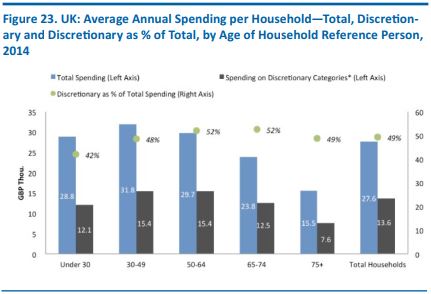
Our analysis of data for the US and the UK shows that average household spending falls off significantly among the oldest age groups, and that spending on discretionary categories slumps among consumers aged 75 and older.
The graphs below show annual household spending in the US and the UK, and the share of that total that goes toward nondiscretionary categories.
We define discretionary spending as the residual that is left after stripping out expenditure on in-home food and nonalcoholic beverages, housing and utilities, health, transportation, and education.
The data once again highlight the divergence between younger and older silvers. In the US and the UK, those households led by people aged 65–74 dedicate a similar share of their spending to nondiscretionary categories as the average household does.
In the US, the average household headed by a 65–74-year-old spent just under $49,000 dollars in 2014; some $18,000, or 37% of the total, was spent on discretionary categories. Among those aged 75 or older, total household spending was one-quarter lower than for the 65–74 group, and discretionary spending was one-third lower. (It is important to bear in mind the caveat that older households tend to have fewer people per household than the average, and that the number of people per household declines with age.)
In the UK, the average household headed by a 65–74-year-old spent just under £24,000 in 2014; some £12,500, or fully 52% of the total, was directed toward discretionary categories. Among the oldest age group in the UK, total spending was 35% lower than the 65–74 group’s and spending on discretionary categories was 39% lower.
These figures further underline the relative affluence of 65–74-year-olds in some markets, and not only because of the relatively high proportion of spending that goes to discretionary categories. The absolute spending per household for 65–74-year-olds compares favorably with the average: the average UK household spending of 65–74-year-olds was only 14% below the national average in 2014, while in the US, it was just 9% below the national average.
*Total spending minus spending on in-home food and nonalcoholic beverages,
shelter and utilities, health, transportation, and education.
Source: US Bureau of Labor Statistics/Fung Global Retail & Technology
Average annual spending extrapolated from average
weekly spending figures reported by the ONS for 2014.
*Total spending minus spending on in-home food and
nonalcoholic beverages, housing rents and utilities, health,
transportation, education, and mortgage interest payments/council tax.
Source: ONS/Fung Global Retail & Technology
Spending by Category
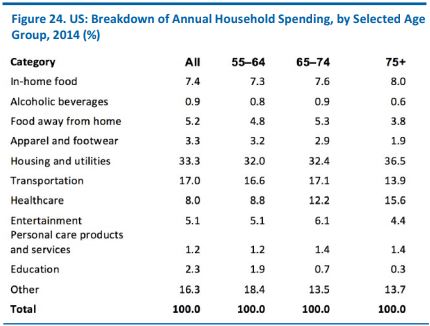
Here, we dig deeper into the spending data to explore how silvers spend, and see how younger and older silvers’ spending differs.
In countries such as the US, 65–74-year-olds allocate a similar proportion of their overall spending to items such as clothing, transportation and dining out as the age group below them does. In other words, they still spend on discretionary goods and services. But consumers aged 75 and older have radically different spending patterns: they spend proportionately more on basics such as housing and eating at home and proportionately less on services such as dining out and transportation, as well as on discretionary categories such as apparel.
It is noteworthy that in several categories and across multiple countries, the differences in spending patterns between consumers aged 55–64 and those aged 65–74 are often less substantial than the differences between those aged 65–74 and those aged 75 and older.

By age of “household reference person,” i.e., the head of the household
Source: US Bureau of Labor Statistics/Fung Global Retail & Technology
In countries with publicly funded healthcare systems, such as the UK, healthcare accounts for a far smaller proportion of all consumers’ annual spending than it does in countries without such a system. Despite this, we still see a falloff in demand for discretionary categories among the oldest age group in these countries. This underlines the fact that it is not so much the squeeze from healthcare costs that hits categories such as apparel and dining out; it is other factors, such as the restrictions imposed by weakening health and mobility.
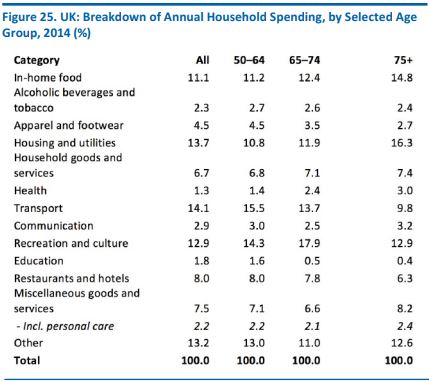
By age of “household reference person,”
i.e., the head of the household
Source: ONS/Fung Global Retail & Technology
Since it is well ahead of most other countries in terms of the aging of its population, Japan may offer a glimpse of what awaits other countries. The trend forecast in Japan is for more gradual changes in spending patterns as consumers age: the country is likely to see a more modest decline in spending on categories such as apparel. This could reflect a greater disparity in affluence between the (poorer) young and the (richer) old in the country or other factors such as greater health and mobility through old age.
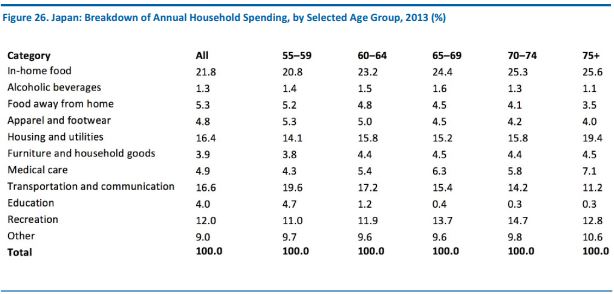
By age of “household reference person,”
i.e., the head of the household
Source: Statistics Japan/Fung Global Retail & Technology
In summary, these data suggest that, for those businesses targeting silvers with discretionary goods and services, the younger segment presents much greater potential opportunity. The gradual changes in spending as consumers age also underscore that younger silvers should be viewed as sharing similar traits to those in pre-retirement years.
III. THE IMPACT OF SILVERS ON INDUSTRIES
In this section, we assess the impact of older consumers on four major sectors, the first two of which—retail and leisure services—are skewed toward discretionary spending and the second two of which—healthcare and assisted living—are predicated on offering essential services.
- In retail, we see the demand for convenience and the need for assistance contributing to a remolding of the landscape. Changes will include more smaller-format and local shops and greater demand for home delivery.
- Seniors tend to spend less on leisure services, but the big exception is travel. Baby boomers are especially enthusiastic travelers, and they will carry their demand for vacations into retirement in the coming years.
- The cost of seniors’ healthcare is among the biggest challenges faced by governments worldwide. Technology looks likely to play a major part in boosting productivity and, thus, helping to keep the cost down.
- Along with healthcare, homecare and assisted living present another potential burden on public and domestic purses Innovation will be needed here, too, in order to care for older seniors more cost- effectively.
Below, we examine not only the fundamental economic impact of an aging society, but also the impact of older consumers’ differing needs and desires. These are most notable in the discretionary and part-discretionary sectors of retail and leisure services.
RETAIL: SILVERS’ NEEDS AND DESIRES WILL RESHAPE THE LANDSCAPE
Silver shoppers have the potential to change the retail landscape. In particular, we see their need for assistance and demand for convenience driving two structural changes: they will do more shopping closer to home, typically at smaller stores, and they will increasingly demand e-commerce home delivery.
Proximity Shopping
In grocery, convenience stores and local grocery stores cater well to the smaller-basket shopping of older consumers. Since they typically have smaller households and smaller appetites, silvers often have less need to travel farther to shop at large grocery superstores. The relative accessibility of local stores and navigability of smaller stores further increases their appeal to shoppers who are less physically able than the general population.
According to 2014 data from Nielsen, baby boomers and silvers aged 68 and over make more visits to small-format stores, such as convenience stores and dollar stores, than younger age groups do. They also tend to visit midsized stores (such as grocery stores) more frequently.
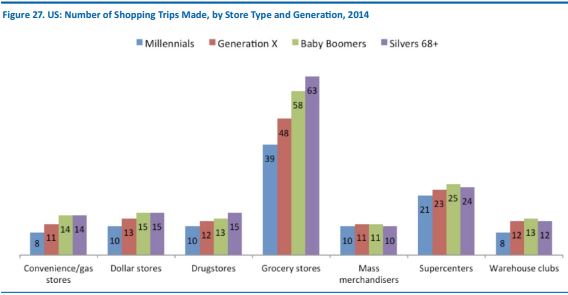
According to Nielsen, in 2014, millennials were aged 21–36,
Generation Xers were aged 37–48 and baby boomers were aged 49–67.
Source: Nielsen/Fung Global Retail & Technology
Nielsen’s data confirm that senior shoppers tend to be smaller-basket shoppers; they may make more visits to a number of smaller-format stores, but they tend to spend less per trip. Nielsen found that convenience stores are the only store type where the spending per basket by baby boomer households exceeds that of millennial and Generation X households.
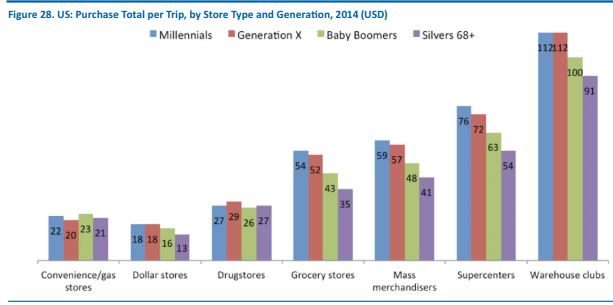
According to Nielsen, in 2014, millennials were aged 21–36,
Generation Xers were aged 37–48 and baby boomers were aged 49–67.
Source: Nielsen/Fung Global Retail & Technology
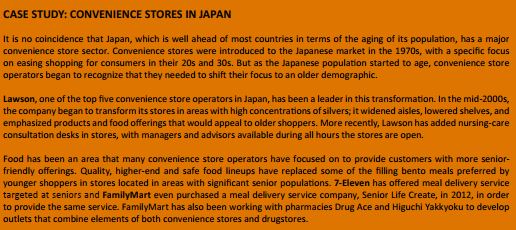
Demand for local convenience is likely to extend beyond the grocery sector. We expect growth in the silver population to boost demand for proximity shopping in health and beauty categories, and possibly filter through to other nonfood sectors such as household goods and apparel, too. So, we expect to see a rise in proximity retailing that specifically targets senior consumers, particularly in neighborhoods that are largely populated by seniors or that include senior housing communities.
Demand for E-Commerce
We expect seniors to become a more important consumer segment for e-commerce that is based on home delivery. Online shopping is currently perceived as skewing toward younger consumers, but the convenience it provides through home delivery makes it well suited to the demands of retirees. In addition:
- E-commerce can help bridge the mobility gap—the difference in ease of traveling to a store and walking in general between younger consumers and older consumers—that could otherwise prevent silvers from shopping.
- Retirees are much less likely than the working-age population to find waiting for a delivery a barrier to online shopping.
- Many baby boomers who are retiring now or who will be in the coming years will carry into retirement a familiarity with technology from their years in the workforce, which means they will be more comfortable with shopping online generally than older groups will be.
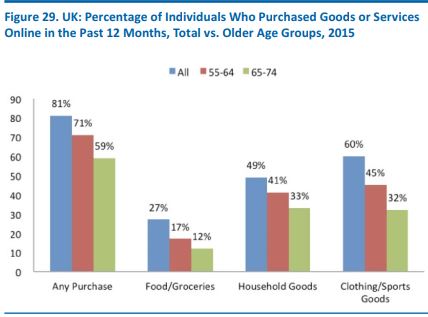
In the UK, more than one in 10 consumers aged 65–74 are already buying food or groceries online, and one-third are shopping online for clothes and household goods.
Home delivery looks to offer particular benefits for seniors when they are grocery shopping—which is a routine chore that can prove burdensome for those who are less physically able. The challenge for retailers is to square silvers’ smaller grocery basket sizes with the higher cost base of grocery home delivery; retailers will likely find it more worthwhile to encourage occasional, large online shops of store cupboard items rather than cater to smaller, more frequent online purchases.
Source: Eurostat
And More Minor Changes, Too
Alongside these structural changes to the retail landscape, retailers will need to make smaller-scale adjustments to cater to aging customer bases. Among the key adaptions that we will increasingly see are:
- Minor adaptations to store layouts/organized layouts: One of the difficulties many silvers face is trying to get products off very high or very low shelves—in many instances, they find that store staff are unavailable to assist them. They also find large stores harder to navigate. A 2012 Retail Week focus group with UK shoppers aged 60 and older found that many of the participants thought the Westfield Stratford City mall was well organized, while most other malls were deemed “too overwhelming.” In terms of grocery shopping, seniors seem to prefer smaller stores and those that are closer to their home.
- Simplicity in packaging and labels: Many seniors find product packaging hard to open, and that labels and prices are hard to read, even with glasses or contact lenses. More than 52% of the consumers aged 60 and older in a 2013 T. Kearney focus group said that they had found that product labels are hard to read.
- They seek quality and are brand loyal: Some 43% of senior shoppers are keener to buy products that are on special if they are convinced that the quality is as high as it is with their usual purchases, according to T. Kearney.
- More choices for younger consumers, but not enough for mature consumers: Senior consumers feel they have limited choices, especially when it comes to fashion. Many shoppers in this group feel they have evolved with the times, but that clothes made for them are frumpy, boring or outdated.
- Many like to stop for coffee/hot food when shopping: On British retailer Debenhams’ recent analyst call, CEO Michael Sharp noted that it is mainly older customers who prefer the hot food offerings and concessions the company provides in its stores. He also noted that revenues from food concessions were substantially higher than those from women’s clothing alone.

LEISURE SERVICES: YOUNGER SILVERS ARE ENTHUSIASTIC FOR TRAVEL
For providers of leisure services, silvers are not the easiest demographic to target. Despite retirees having a surfeit of spare time, they tend to spend less than younger groups do on services such as dining out and going to the movies. And as their mobility and health dwindle as they get older, seniors tend to spend less and less on discretionary services.
The picture is not uniformly negative, though, for at least two reasons. First, given their greater mobility, younger silvers are more likely than their older counterparts to spend on leisure services. Second, as baby boomers retire, they are sure to carry with them their heightened demand for services, notably travel services.

How Silvers Spend Their Time
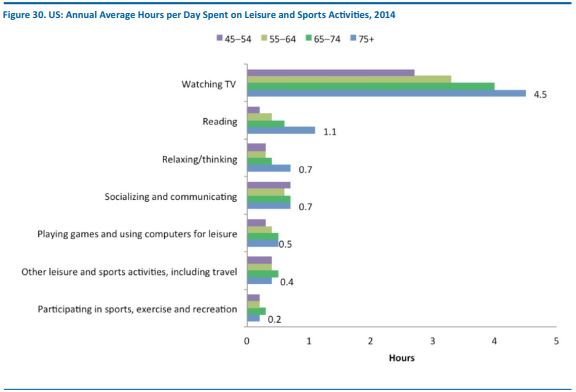
Data from the US Bureau of Labor Statistics confirm that seniors, on average, use their extra leisure time predominantly for no-cost or low-cost options such as watching television, reading, and relaxing or thinking. There are some differences between the 65–74 and 75-and-older age groups. For example, the former spends more time on leisure activities such as travel, sports and exercise than the latter group does—an inevitable result of the loss of mobility among many of the oldest consumers.
Source: US Bureau of Labor Statistics
Seniors Are Willing to Spend on Travel
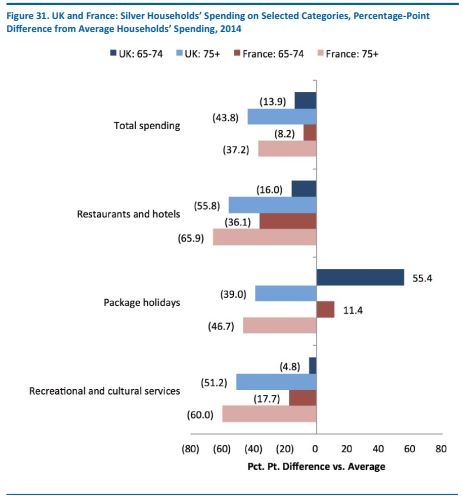
Among paid-for leisure services, travel stands apart as a category where 65–74-year-olds are willing to spend. Below, we show the extent to which seniors’ household spending under- or overindexes relative to the average household’s spending in the UK and France. Across the selected major service categories, travel is the standout, with consumers in the 65–74 age bracket spending significantly more than the average household.
Source: ONS/INSEE/Fung Global Retail & Technology
In the US, fully three-quarters of consumers aged 65 and older say vacations and leisure travel are important to them, according to a GfK survey. That figure is lower than for other age groups, but not by much. The next generation of silvers (i.e., those who are currently aged 50–64) appears to be even more enthusiastic about travel, and we expect boomers to carry this enthusiasm into their retirement.
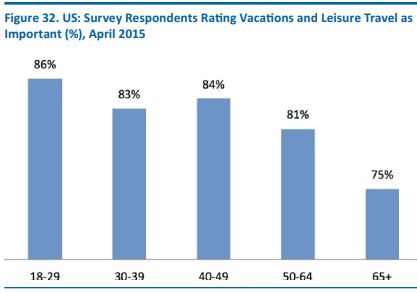
Source: GfK
And in Europe, Eurostat data show that older age groups have been gaining share of the continent’s total number of tourists.
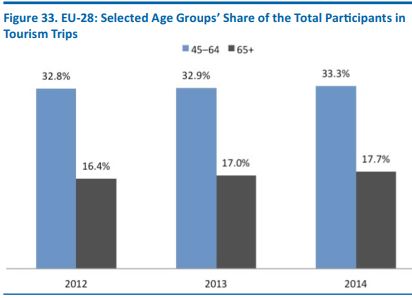
Includes domestic and international tourism trips of
one night or more by residents of the 28 EU countries.
Source: Eurostat/Fung Global Retail & Technology
Baby Boomers Will Boost the Senior Travel Market in the Coming Years
Research on older consumers’ travel plans for 2016 confirms that they are enthusiastic vacationers. A survey of US consumers aged 50 and older undertaken by consumer group AARP found that fully 99% of those polled expect to travel either domestically or internationally in 2016.
The demand for travel among older consumers suggests that we will see strengthened demand for travel among retirees in the coming years. We think baby boomers, who are accustomed to traveling frequently for leisure, are not likely give up that luxury once they have even more free time on their hands in retirement.
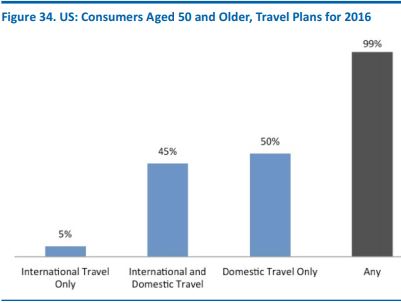
Base: 888 US respondents aged 50 or older
Source: AARP
Moreover, AARP research found that consumers aged 50 and over were much less likely than other age groups to perceive cost as a barrier to travel and were much more likely to say that nothing would be a barrier to travel in 2016. So, the next generation of retirees is likely to bolster the market for senior- positioned travel options.
However, one big drawback for this age group is the effect that weakening health can have on travel plans: consumers aged 50 and older were much more likely to say that health issues could prevent them from traveling this year. Health and mobility are the big barriers for the senior travel market, as they are for other leisure services. Yet, with retirees enjoying more years of healthy, active living, these are less of a problem for the silver market than they used to be.
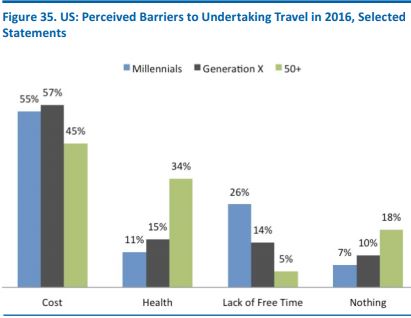
Source: AARP


HEALTHCARE: SILVERS DRIVE RISE IN GLOBAL SPENDING
The single biggest problem arising from the aging of society is the cost of healthcare. The aging trend, together with the development of healthcare in emerging economies, is driving solid growth in global healthcare expenditures. Between 2009 and 2013, global healthcare spending grew at an average annual rate of 4.8%, bringing the 2013 total to $7.4 trillion, we estimate, based on World Bank data. Given this growth, we further estimate that total global healthcare spending rose to about $8.1 trillion in 2015.
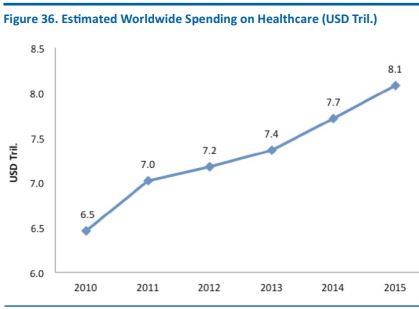
Source: World Bank/Fung Global Retail & Technology
Based on the ratio of population share to healthcare spending share for seniors in the US, the UK and Japan, we estimate that seniors’ spending on healthcare is approximately double the average.
In turn, based on projected share of global population and projected global healthcare spending, we estimate that silvers accounted for around 17%, or $1.3 trillion, of global healthcare spending in 2015. Extrapolating from this, we forecast that those 65 and older will account for around 21%, or $2.7 trillion, of healthcare spending in 2025 and around 26%, or $5.4 trillion, of healthcare spending in 2035.
America’s Healthcare Problem
Relative to GDP, the rise in healthcare costs for most countries has been steady rather than dramatic. But for the US, which already has the most expensive healthcare system in the world, the increase in cost has been substantial. Spending on the category in 2014 was eating up fully 4.1% more of the country’s total economic output than it was in 2000, and this was off a base that was already high enough to dwarf the closest competitors.
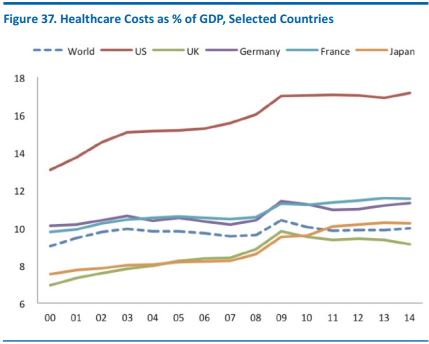
Source: World Bank
The cost problems facing the US in particular are illustrated by its absolute spending, which dwarfs that of other major economies. In 2013, the latest year for which comparable data are available from the World Bank, Americans spent $2.9 trillion on healthcare.
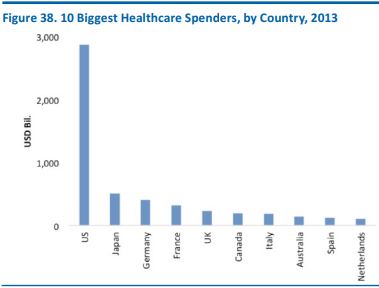
Source: World Bank
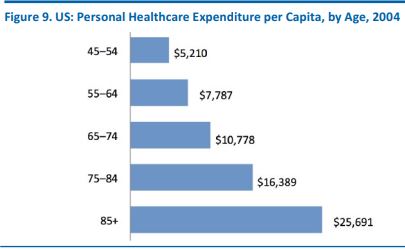
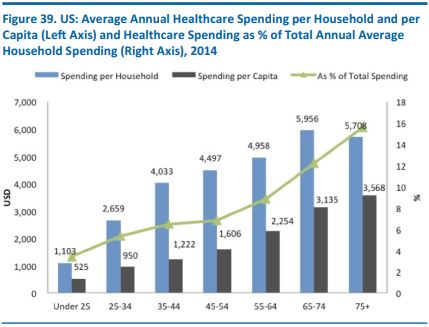
The graph below helps illustrate the problem facing most developed economies, but especially the US. It shows spending per household on healthcare in 2014; from average household sizes, we also estimate spending per capita on healthcare.
While the trend is not unexpected, these data indicate the scale of the costs associated with aging. For instance, the annual cost of healthcare for each 65–74-year-old is roughly double that for each 45–54-year-old. Multiply these annual costs by the 8 million extra seniors the US will have by 2020, or the 18 million more it will have by 2025, and it is easy to see that there will be major cost issues.
Data are for personal consumption expenditures
Source: US Bureau of Labor Statistics
/Fung Global Retail & Technology

Tech-Driven Solutions
In the health market, the prospect of a booming senior segment is one that sets alarm bells ringing across governments and insurers. With necessity being the mother of invention, the growing cost pressures have spurred a wave of tech-driven solutions that aim to deliver healthcare in new ways. Just as tech- focused solutions have driven down the cost of everything from taxis to books, there are real opportunities for them to bring much-needed efficiency to healthcare, driving up productivity and helping cap the costs that governments and insurers face.
We are seeing solutions emerge in three main sectors:
- Health technology products
- Wearable technology (which sometimes overlaps with health technology)
- New, tech-enabled service providers.
Health Technology
The World Health Organization describes health technology as “the application of organized knowledge and skills in the form of devices, medicines, vaccines, procedures and systems developed to solve a health problem and improve quality of lives.” Health tech has been immensely helpful in improving, and lengthening, people’s lives.
Within the industry, technology has been developed to cater to silvers’ specific medical and health needs. BCC Research valued the global market for senior- care technology at $3.7 billion in 2014, and the firm expects it to grow to $10.3 billion by 2020, at a compound annual growth rate of 18.8%.
Technology has increasingly helped the healthcare industry progress in terms of provision of care, diagnosis, noninvasive surgery and more. The silver demographic has unique needs as a result of the natural aging process and age-specific ailments. Below, we examine some of the applications of health tech for seniors.

Wearable Technology
Wearable technology is currently dominated by lifestyle products such as Fitbit fitness bands and Apple Watches, but we are seeing the emergence of wearables that address the particular needs of seniors and help consumers manage chronic conditions. There are a number of wearable wellness trackers for seniors on the market now, including the Tempo wristband, which tracks and “learns” the wearer’s sleep, meal, activity and other habits. Once it does, it checks for each activity at the stipulated time, and if the wearer misses a meal or has not woken up at the usual time, the smartphone app linked to the tracker notifies the caregiver.
Connected Services
New service companies are driving the “Uberization” of healthcare, with a number of tech startups making healthcare more accessible and convenient for patients by putting them directly in touch with healthcare providers via the Internet. In some cases, this means offering virtual and face-to-face doctor’s appointments booked via the web or via apps. In other cases, it includes offering video consultation services. Investors are attracted by the model’s profit potential, while large healthcare companies, hospitals and practices see it as a way to provide remote care that is cost-effective and convenient.



ASSISTED LIVING: A FURTHER MAJOR COST BURDEN
The need to provide seniors with assistance with everyday living is a second major cost burden arising from the aging of society. This everyday help can be split into two forms: homecare and assisted living. Homecare is the provision of supportive care to carry out everyday tasks, and is provided by professional caregivers in the home of the person needing care. Assisted-living facilities are communal residences and centers such as nursing homes that employ skilled caregivers to care for residents.
A $50 Billion+ Industry in the US Alone
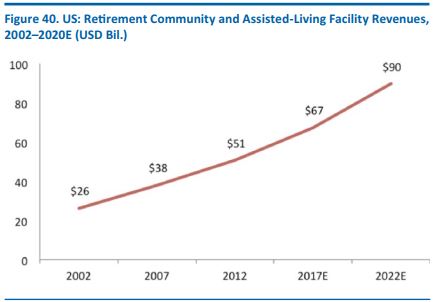
In the US, the assisted-living industry was worth nearly $51 billion in 2012, the latest year for which data are available from the US Census Bureau. Assuming the industry continues to grow at its historical compound annual growth rate of 5.9%, we expect it to be worth approximately $67 billion in 2017 and $90 billion in 2022.
Source: US Census Bureau/Fung Global Retail & Technology
The demand for senior-care services translates into a major employment sector. As of May 2015, there were 820,630 people employed as health aide workers in the US, according to the US Bureau of Labor Statistics. Of these, 11% worked in continuing-care retirement communities and assisted-living facilities for the seniors. The remaining 89% were employed in other home and residential nursing, physical and mental healthcare capacities or in individual or family services. The Bureau of Labor Statistics projects that the number of jobs in the industry will grow by 38% between 2014 and 2024, a rate that is much faster than the projected average employment growth rate in the US.
Technology’s Role in Transforming Senior Care
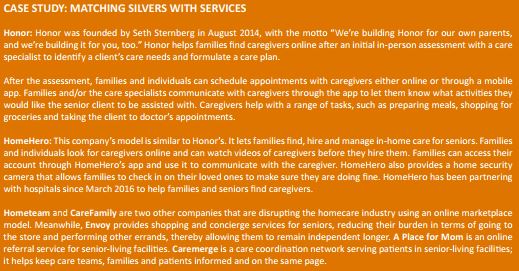
Just as technology can help restrain the growing healthcare costs associated with an aging population, so, too, can it help tackle the rising cost of helping less able older consumers live everyday lives. Several marketplaces have emerged that operate like Uber and Airbnb; these match senior clients with service providers who can help them maintain their quality of life.
THE SILVER WAVE: KEY TAKEAWAYS
- Silvers are not a homogeneous group, and older silvers’ spending patterns differ significantly from those of their younger counterparts.
- Younger silvers (those aged 65–74) continue to spend significantly on discretionary categories such as travel, and they are catching up to the general population in terms of e-commerce adoption and smartphone ownership. As baby boomers retire in the coming years, we expect these trends to only strengthen.
- Industries such as retail and travel will be reshaped by the demands and needs of senior consumers as the global population continues to grow older.
- We expect technology to play a key role as governments tackle the cost challenges in essential services for the senior market, such as healthcare and homecare and assisted living.
The silver wave is fast approaching. The question that governments, industries and companies must ask themselves is: are we ready?



 Western governments have tended to use various measures to encourage workers to retire later, helping to grow the number of silvers remaining in the workforce:


 Demand for local convenience is likely to extend beyond the grocery sector. We expect growth in the silver population to boost demand for proximity shopping in health and beauty categories, and possibly filter through to other nonfood sectors such as household goods and apparel, too. So, we expect to see a rise in proximity retailing that specifically targets senior consumers, particularly in neighborhoods that are largely populated by seniors or that include senior housing communities.


