
albert Chan
What’s the Story?
We count down to the holiday season with a 12-week series focused on the data, trends and observations surrounding the end-of-year peak. In the fourth week of the series, we chart how consumer spending has shifted already and how it could shift in the holiday peak. Several of our data points show the potential for retail to gain a share of spending from services in the coming holiday season.
Why It Matters
The shape and scale of consumer demand during the holiday peak is less certain than ever this year. Our holiday coverage aims to offer directional guidance.
US Consumer Spending Shifts: In Detail
The Potential for Spending To Switch to Retail in the Holiday Season
This year, consumers have fewer options to spend on services and many are less inclined to engage with these activities—from overseas and domestic travel to dining out or grooming services.
- During the 2019 holiday season, consumers spent $525 billion on seven core services categories, according to our analysis of data from the US Bureau of Economic Analysis (BEA).
- Based on recent trends, we estimate that this total will decline by around 29% year over year this holiday season (October–December).
- This equates to $151 billion that is likely to be freed up from services spend—and retailers can compete for a share of that spending.
To situate this in context, we expect total holiday-season retail sales to total $1.1 trillion.
[caption id="attachment_117867" align="aligncenter" width="700"]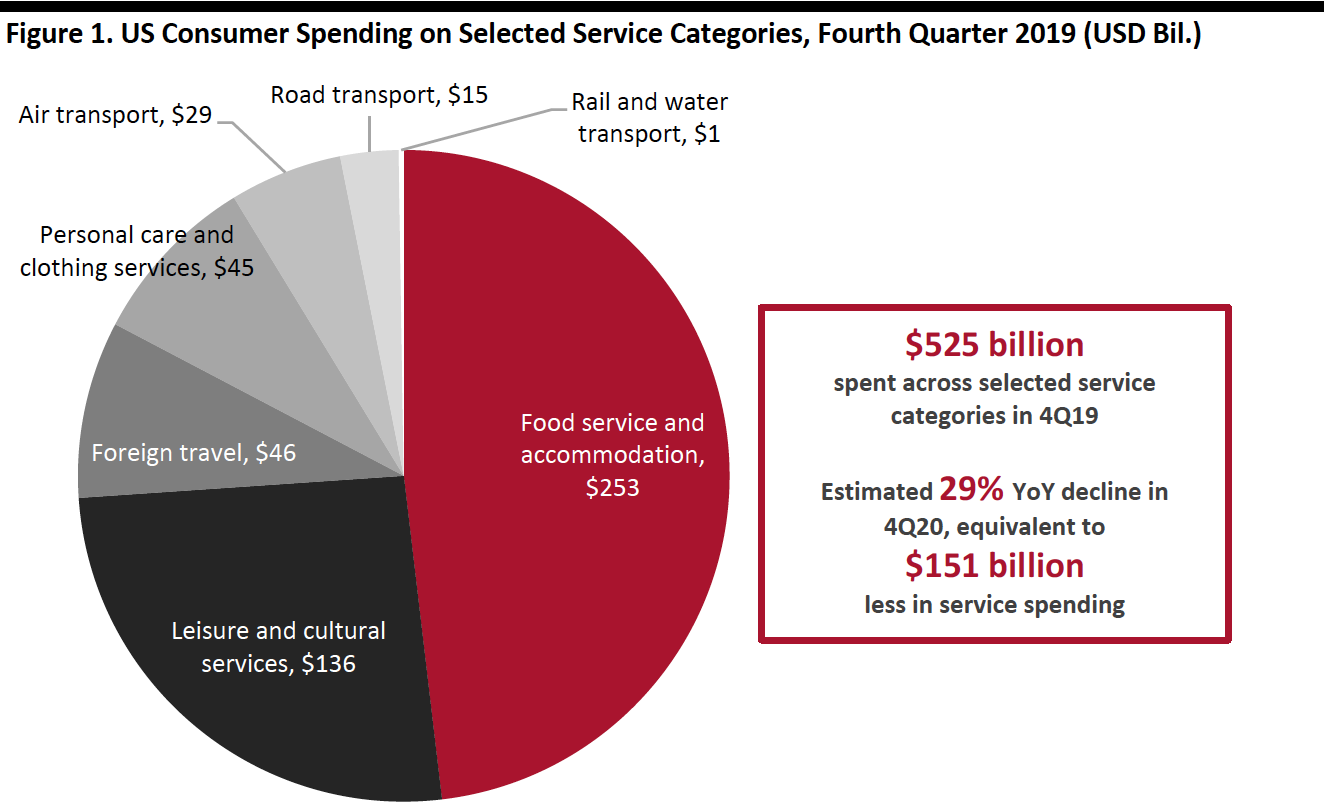 Consumer spending data include sales taxes
Source: BEA/Coresight Research[/caption]
Our holiday shopper survey asked consumers whether they expect to switch spending from services to products during the holiday season. Almost seven in 10 (69%) said that they do anticipate this shift in their spending. As charted below, we asked those that expect to switch spending to identify where they expect to spend that cash—with gift cards, electronics, and clothing or footwear proving most popular, reflecting the strengths of these gifting categories. Our survey found that apparel, gift cards and electronics were the top gifting categories (in that order).
However, gift cards over index among those expecting to switch spending from services. Gift cards look set to be a winning category this year, helped by their suitability for purchasing and gifting (sending) in socially distanced ways. Retailers can encourage purchases of vouchers and cards as incremental gifts and so build basket sizes. Retailers faced with potential inventory or fulfillment challenges should seek to convert shoppers to gift cards.
[caption id="attachment_117868" align="aligncenter" width="700"]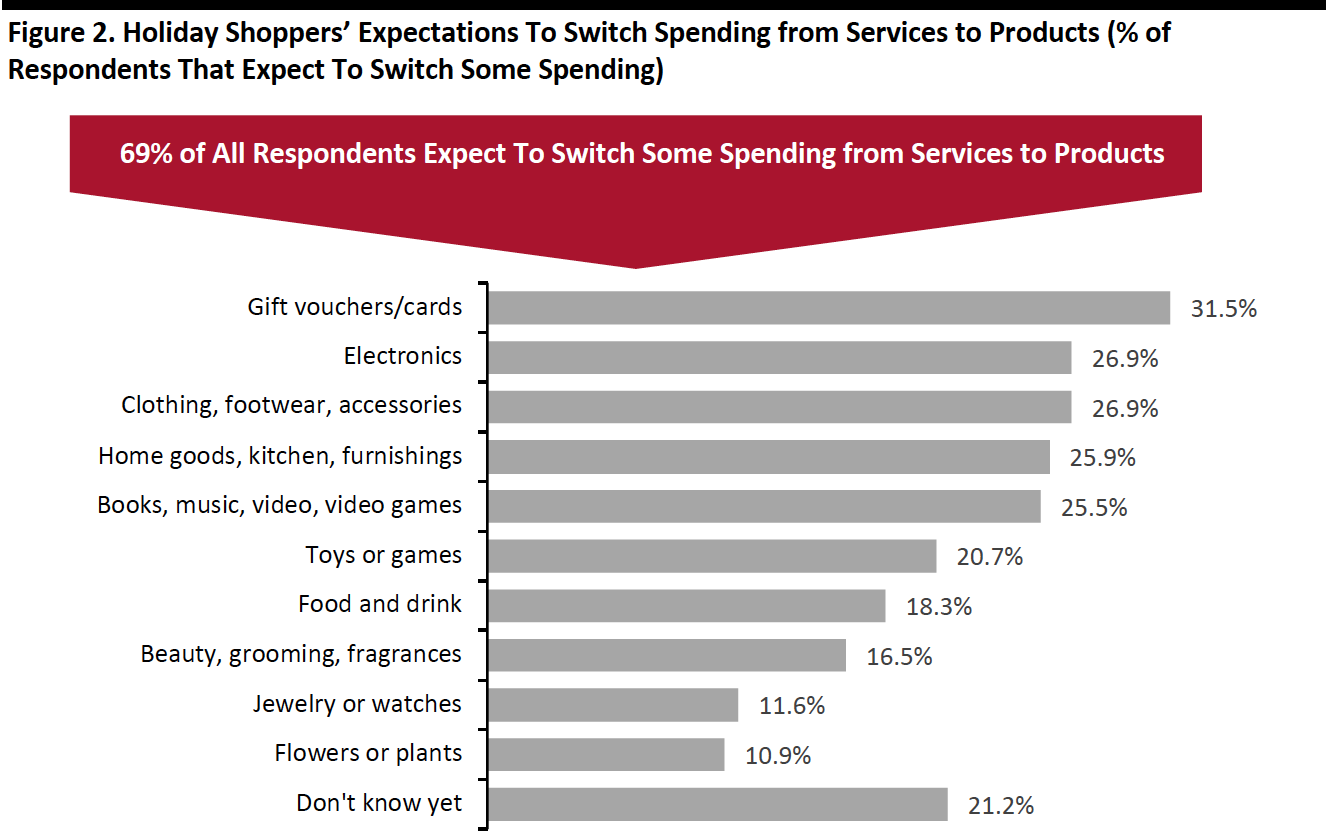 Base: 769 US respondents aged 18+ who expect to switch some spending from services to products for the holidays, surveyed in September 2020
Source: Coresight Research[/caption]
How Much Consumers Have Saved So Far This Year
In addition to switching spend during the season, retailers could gain from the savings accumulated by consumers so far this year. Below, we chart the absolute year-over-year change in spending for 17 largely discretionary product and service categories in the first eight months of 2020.
- Some discretionary categories, such as media products, sports goods and toys and games, have gained from the Covid-19 crisis. However, these gains have been outweighed by very substantial declines in a number of service categories and clothing and footwear.
- We estimate that consumers spent a total of $417 billion less across all of these discretionary categories in the first eight months of the year. This total will increase as we move further through the year.
- Pre-crisis, discretionary spending was growing solidly, and the increase we would otherwise have expected in 2020 has also been lost. Assuming that we would have seen a 4% increase in total discretionary spend in 2020, the total lost spending balloons to just over $500 billion for the categories charted below.
This saved spending is one factor behind our expectations for further solid growth in total retail sales this holiday season.
[caption id="attachment_117869" align="aligncenter" width="700"]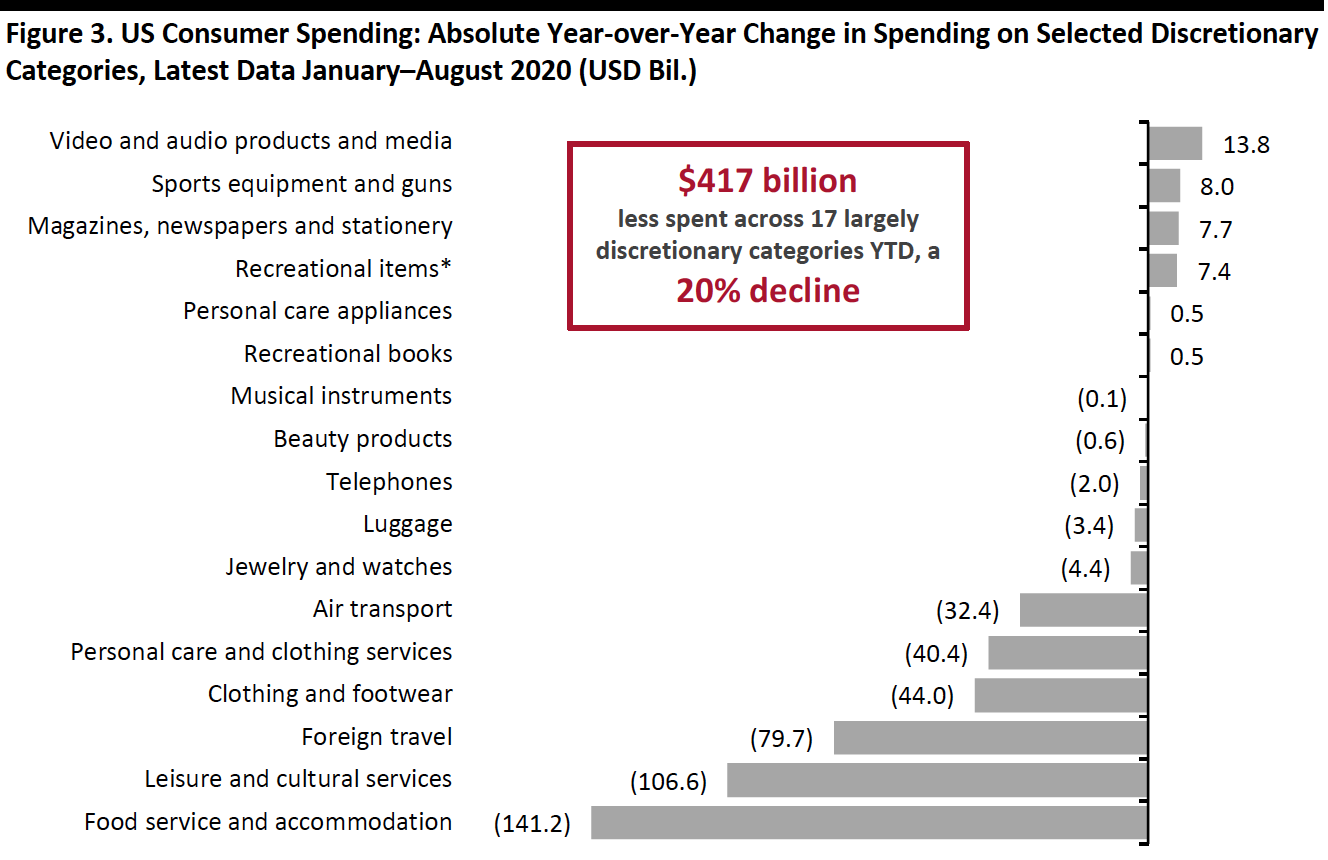 *Includes games, toys, hobby products and flowers, seeds and plants.
Source: BEA/Coresight Research[/caption]
Many consumers will continue to spend less in total during the holiday season: 53% expect to spend less in total than they did last year, according to our holiday survey. They also continue to expect to cut back most on service categories. Among those that expect to spend less, dining out or going out, traveling for visits and days out or vacations are the top categories for cutbacks. While many also expect to spend less on retail categories, we see opportunities for retail overall to gain from the sustained cuts in nonretail spending.
[caption id="attachment_117870" align="aligncenter" width="700"]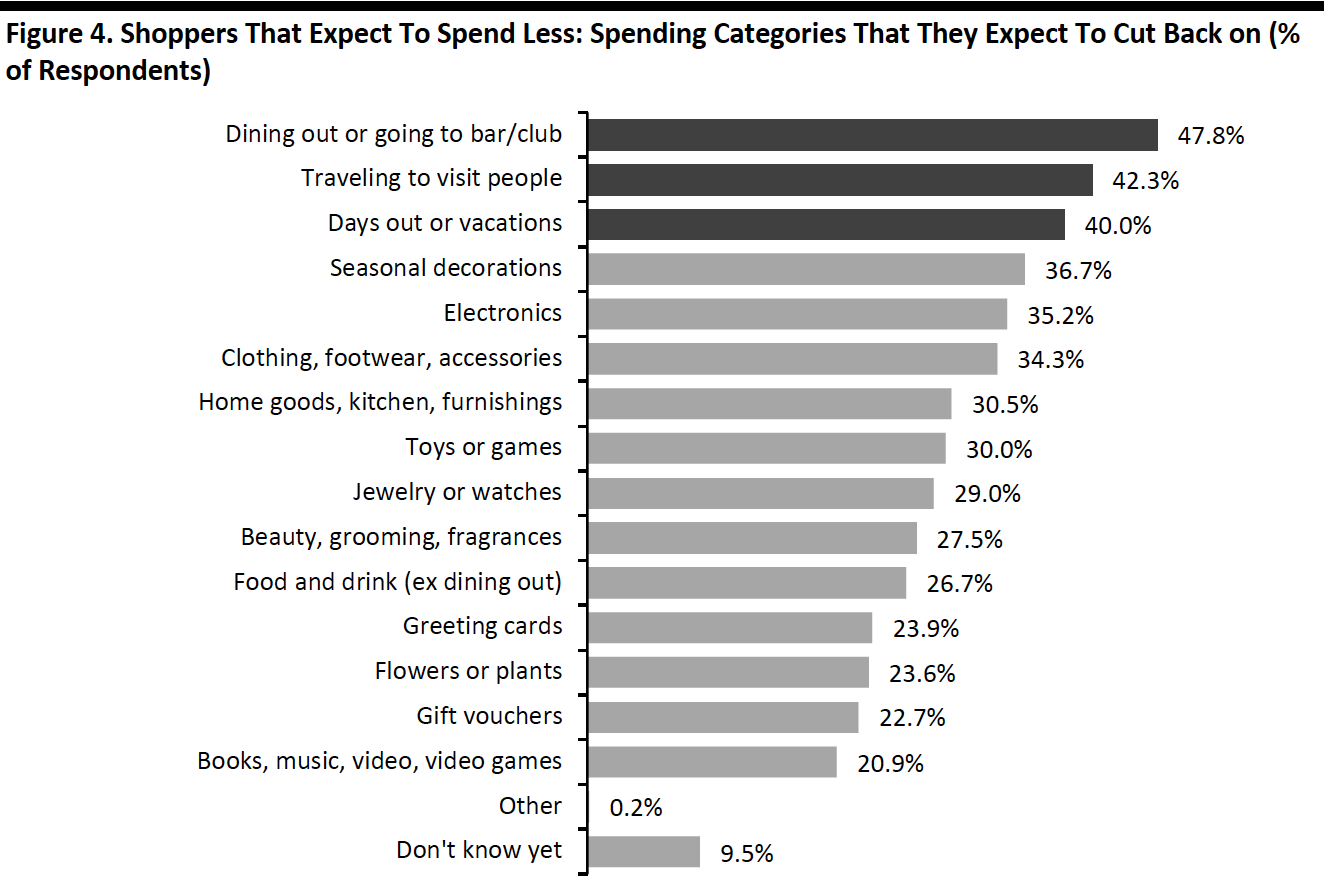 Base: 603 US respondents aged 18+ who expect to spend less on the holiday season in 2020 than in 2019, surveyed in September 2020
Source: Coresight Research[/caption]
Where Shoppers Have Spent in Retail So Far This Year
How have these shifts fed into retail so far this year? In the first nine months of 2020, the sector saw a total net sales gain of just under $155 billion year over year, according to our calculations from Census Bureau data. That is equivalent to a 5.8% year-over-year increase.
- Discretionary retail sales accounted for just over $61 billion of the total year-over-year increase (up 4.1% year over year). We define discretionary sectors as all retail apart from food, health and beauty, supercenters (due to the strength of food and other essentials in their sales mix) and warehouse clubs.
- Nonstore retailers—mainly online retail—accounted for over $114 billion of the increase (a 20.5% increase).
- Within specialized nonfood sectors, home-improvement retailers have seen the most spectacular increase, growing sales by $37 billion compared to the same period of 2019 (a 12.8% increase).
- Furniture specialists’ sales are down but category spending has been up, according to the BEA, with more sales moving online.
September was a very strong month for retail sales. We saw strong sequential improvements in the declines at department stores and clothing and footwear retailers—as well as a reacceleration of year-over-year growth for the already-strong home-improvement and nonstore sectors. As we outlined in our recent Holiday Retail Outlook, we expect sustained food retail demand and solid nonfood demand in categories such as furnishings and home accessories, gift cards, home-improvement products and some small-appliance and electronics categories.
[caption id="attachment_117871" align="aligncenter" width="700"]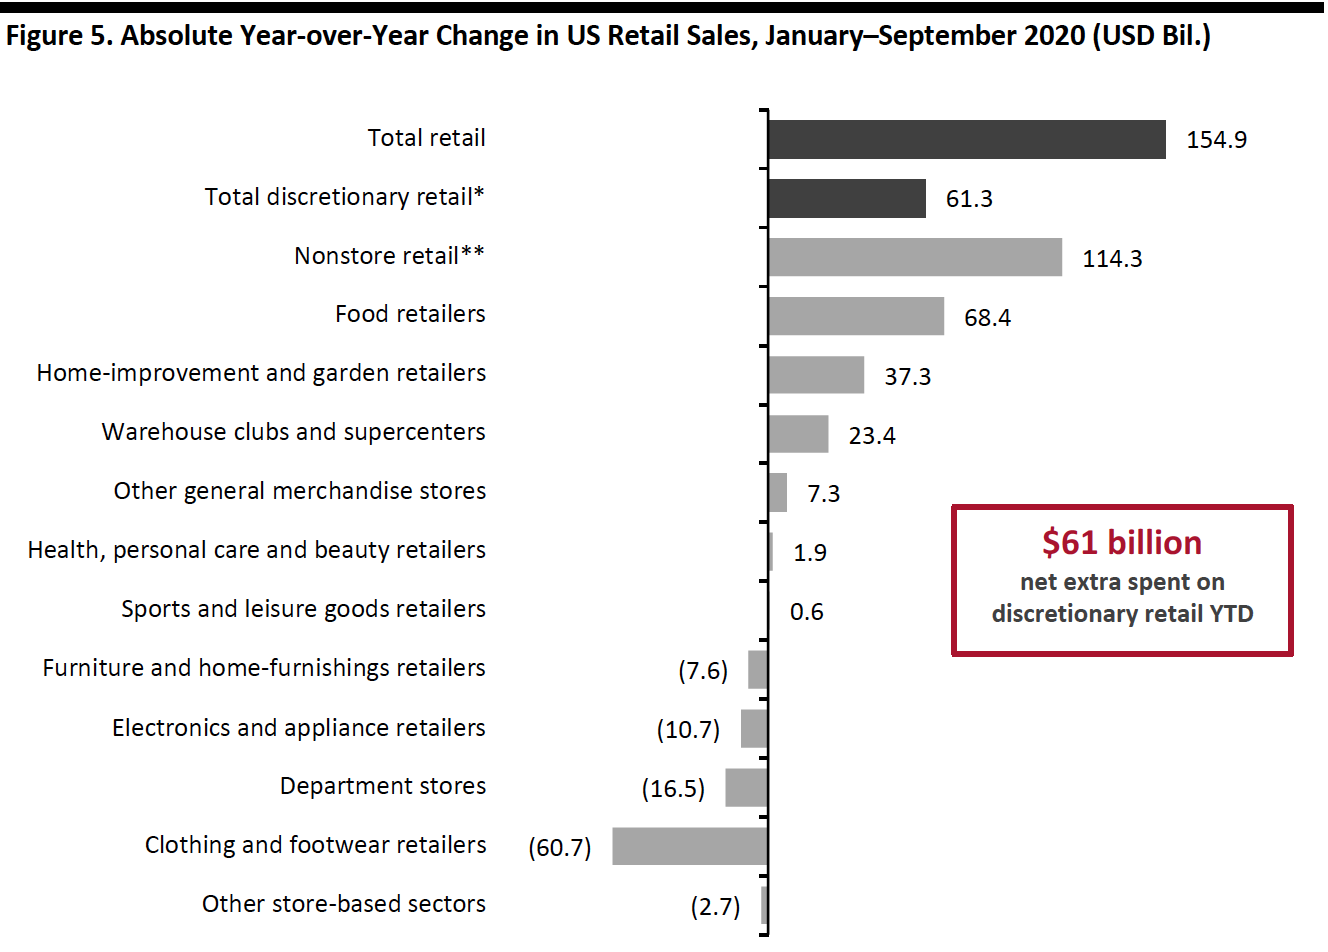 Retail sales data exclude sales taxes.
*All sectors apart from food retailers, warehouse clubs and supercenters and health, personal care and beauty stores (due to healthcare/essential goods component).
**Includes online-only retailers and mail order houses. This sector also includes online sales from some store-based retailers that separate this business from their store-based operations.
Source: US Census Bureau/Coresight Research[/caption]
What We Think
Implications for Retailers
- The retail sector has a dual opportunity: To capture spending that would otherwise have been directed to services during the holiday peak (worth $151 billion, according to our estimate) and to capture lost spending that has accumulated across discretionary categories so far this year (worth over $500 billion).
- Trading Up: We expect many consumers to trade up to more premium products on product purchases this year—our holiday survey found just over half expect to trade up to better quality products this year. Retailers should provide opportunities to trade up to premium and luxury goods, rather than assuming that tough macroeconomic circumstances will drive a consistent trading down in retail purchases.
- Treating: Retailers have an opportunity to build basket sizes by encouraging incremental spending and impulse purchases. Among those shopping for others, gift cards look set to be highly popular and these are one avenue to drive incremental spending on add-on gifts—particularly if retailers are experiencing inventory constraints. Retailers can also encourage self-gifting: Following a tough year and with reduced options to spend on services for themselves, retailers can encourage impulse purchases around self-treating and self-care, even where shoppers originally set out to buy gifts for others.