
DIpil Das
What’s the Story?
In this report, we discuss the Singles’ Day sales performance of China’s leading e-commerce players, including Alibaba and JD.com, and highlight key themes and consumer shopping patterns from this year’s shopping festival.Why It Matters
Data from China’s National Development and Reform Commission showed that consumer spending is the main driving force of the country’s economy, accounting for 57.8% of the country’s GDP growth in 2019. The spending patterns of Chinese consumers during this year’s Singles’ Day was regarded as a key indicator of China’s overall economic health.Sales Performance of Alibaba and JD.com: In Detail
This year, Alibaba and Suning.com extended the sales period for Singles’ Day, typically a 24-hour event, to a shopping festival with multiple sales windows. The extended shopping festival provided consumers with more time to browse and purchase products while reducing the pressure on logistics infrastructure, thereby creating a better shopping experience. JD.com held an 11-day event this year, as it did for Singles’ Day last year.Figure 1. Sales Windows on Different E-Commerce Platforms [wpdatatable id=559 table_view=regular]
Source: Company reports Alibaba Leads Sales Performance During Singles’ Day Alibaba achieved ¥498.2 billion ($74.1 billion) in GMV during its 11-day 11.11 Global Shopping Festival this year, representing an increase of 26% compared to the same period in 2019. The number of shoppers participating in the shopping festival reached 800 million, an increase of 300 million compared to last year. On a non-comparable basis, Alibabas Singles’ Day sales grew by 86% from ¥268.4 billion ($38.4 billion) on November 11 in 2019 to ¥498.2 billion ($74.1 billion) during the period November 1 to 11 in 2020. By comparison, JD.com recorded ¥271.5 billion ($40.9) in GMV during its 11-day Singles’ Day shopping festival, representing a 34.6% year-over-year increase. Combined, the two platforms recorded a total of ¥769.7 billion ($115 billion) in GMV for the 11-day Singles’ Day shopping festival, representing 63% year-over-year growth, on a non-comparable basis. [caption id="attachment_119527" align="aligncenter" width="700"]
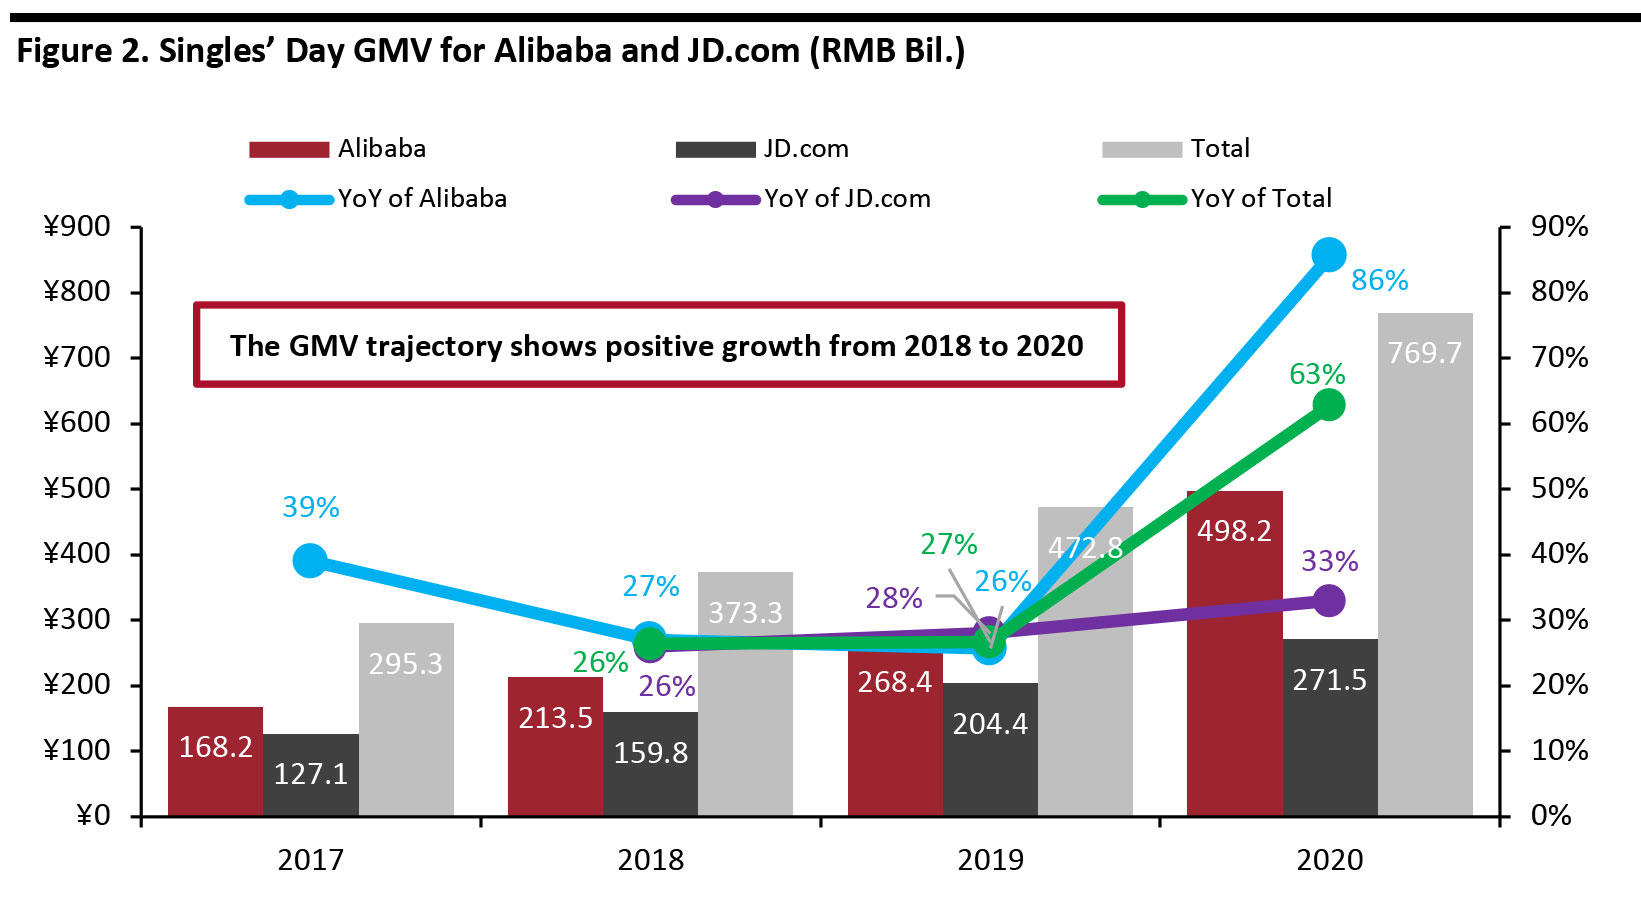 Note: Alibaba’s Singles’ Day data did not cover sales from November 1¬¬¬¬¬ to 11 before 2020; it only reported data on November 11 itself. JD.com has reported its Singles’ Day data from November 1¬¬¬¬¬ to 11 since 2017. JD.com did not report exact data before 2017, so we do not have YoY data for 2017.
 Source: Company reports/Coresight Research [/caption] On Suning.com, the number of orders between November 1 and 11 increased by 75%, year over year, compared to 2019. The company did not release details of the numbers. Pinduoduo, as always, did not reveal GMV data for Singles’ Day. Instead of focusing on holiday discounts, Pinduoduo offers promotions every day. Pinduoduo’s Vice President Chen Qiu explained that the platform does “6.18 and Singles’ Day every day.” Nevertheless, Pinduoduo updated its app logo to mark the arrival of Singles’ Day. [caption id="attachment_119528" align="aligncenter" width="640"]
 Pinduoduo’s updated logo emphasized Singles’ Day
 Source: App stores [/caption] China’s Online Sales Decline on November 11 Online sales across all platforms on November 11 decreased by 18.8% year over year to ¥332.9 billion (around $49.5 billion) from ¥410.1 billion (around $61.0 billion) in 2019, according to data firm Syntun. (These figures do not include sales outside of November 1 for platforms that reported 11-day shopping festival data.) Although both Alibaba and JD.com saw overall growth during the 11-day event, the decrease on November 11 indicates that sales from the first sale window at the beginning of November played an important role in total sales this year. [caption id="attachment_119529" align="aligncenter" width="700"]
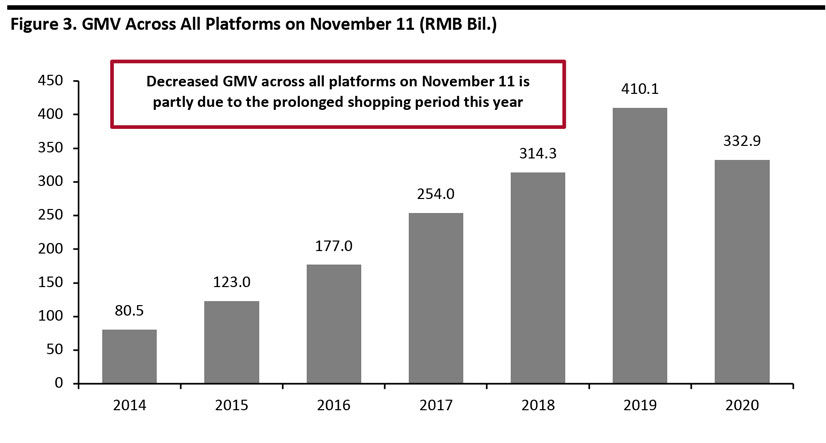 GMV performance on November 11 across e-commerce platforms
 Source: Syntun [/caption] In the first six hours of November 11, GMV across all platforms reached ¥175.0 billion ($26.0 billion), accounting for 52.3% of total GMV for the day. It is clear that shoppers wanted to secure products as early as possible. Next year, merchants should take advantage of consumers’ fear of missing out by offering attractive deals from the very start of the festival, leveraging limited-quantity promotions to drive traffic and lead the competition early. [caption id="attachment_119530" align="aligncenter" width="700"]
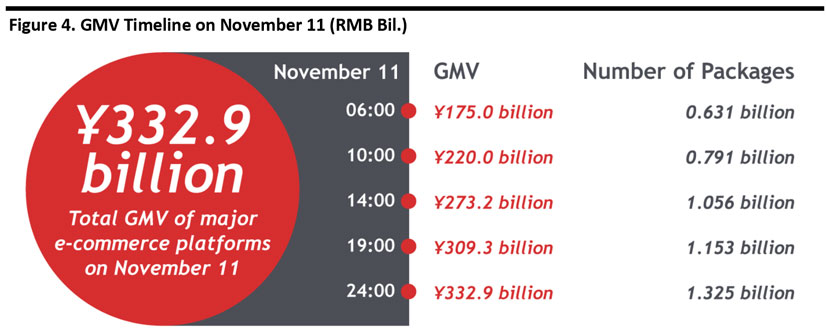 Source: Syntun[/caption]
On November 11, Alibaba’s Tmall platform led in terms of GMV share among online platforms, accounting for 59%, followed by JD.com with a 26% share, according to Syntun. Tmall's share declined from 66% last year, whereas JD.com’s share increased from 17% last year.
Alibaba’s decline in GMV share is likely due to this year’s new sales window of November 1–3, which diverted sales from November 11. However, it is worth noting that this year, the combined GMV share on November 11 for the two platforms increased to 85% from 83% in 2019. This represents the continuous consolidation of e-commerce among major online players in China.
[caption id="attachment_119531" align="aligncenter" width="700"]
Source: Syntun[/caption]
On November 11, Alibaba’s Tmall platform led in terms of GMV share among online platforms, accounting for 59%, followed by JD.com with a 26% share, according to Syntun. Tmall's share declined from 66% last year, whereas JD.com’s share increased from 17% last year.
Alibaba’s decline in GMV share is likely due to this year’s new sales window of November 1–3, which diverted sales from November 11. However, it is worth noting that this year, the combined GMV share on November 11 for the two platforms increased to 85% from 83% in 2019. This represents the continuous consolidation of e-commerce among major online players in China.
[caption id="attachment_119531" align="aligncenter" width="700"]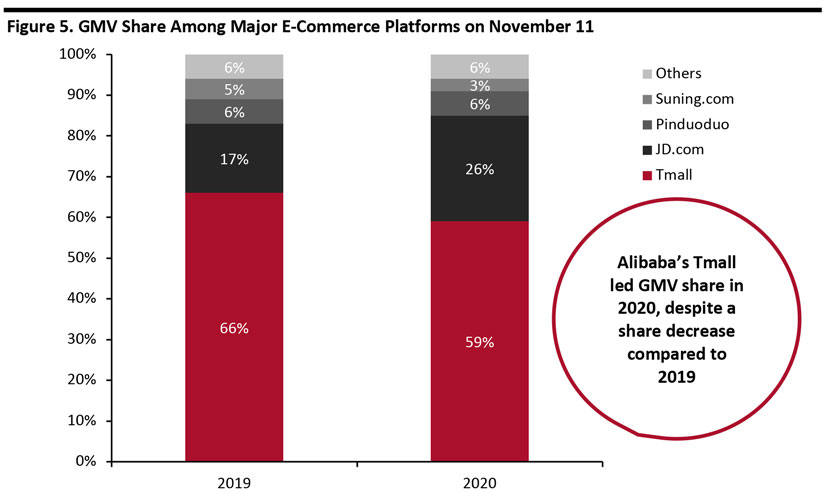 Source: Syntun[/caption]
Top Performing Brands on Alibaba’s Tmall
From November 1 to 11, more than 450 brands saw GMV surpass ¥100 million ($14.9 million) on Tmall. Many international brands ranked in the top 10 brands for different categories:
Source: Syntun[/caption]
Top Performing Brands on Alibaba’s Tmall
From November 1 to 11, more than 450 brands saw GMV surpass ¥100 million ($14.9 million) on Tmall. Many international brands ranked in the top 10 brands for different categories:
- Six of the top 10 womenswear brands were international.
- Seven of the top 10 beauty brands were international.
- Eight of the top 10 outdoor brands were international.
- Nine of the top 10 watches and glasses brands were international.
Figure 6. Brand Ranking by Sales on Tmall, November 1–11, 2020 [wpdatatable id=560 table_view=regular]
Source: Tmall International brands should serve Chinese consumer demand for these products via in-country sales channels through the remainder of 2020 and into 2021, as reduced rates of international travel are likely to support China’s domestic retail sales—especially in categories that have hitherto overindexed on purchases abroad. Our 2019 survey of Chinese travelers found that the most popular categories for purchases made abroad were (in descending order of shopper numbers) fragrances and beauty, clothing, footwear and accessories, health supplements and vitamins, electronics, alcoholic drinks, and jewelry and watches. Key Themes and Shopping Patterns
- Beauty Brands Outperform on Tmall This Year
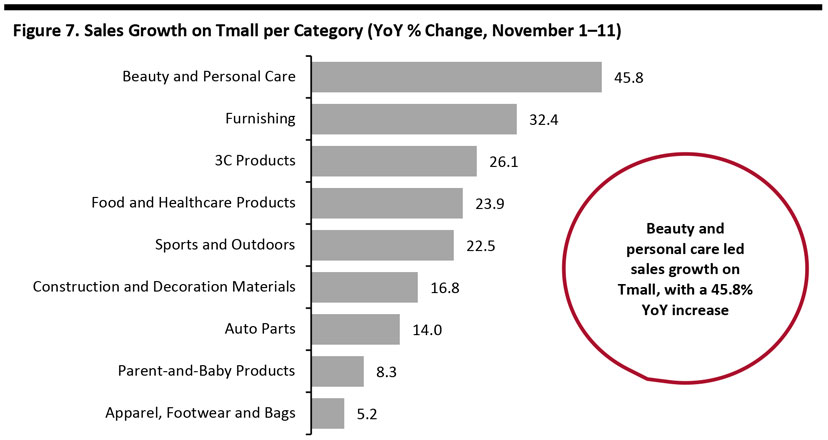 3C products are computer, communication and consumer electronics products.
 Source: Ecdataway [/caption]
- Shopper Spending on Tmall Correlates to City Tier System
Figure 8. Top 10 Cities by Sales on Tmall, November 1–11, 2020 [wpdatatable id=561 table_view=regular]
Source: Tmall
- Strong Growth in Electronics and Luxury Goods on JD.com
- Larger and Faster Delivery Capacity
- New Products Continue To Gain Traction
What We Think
The data reported by Alibaba and JD.com on Singles’ Day sales indicate continuous growth, supporting the recovery of China’s retail industry in the wake of the pandemic. So far, recovery has been slow, and the retail industry is expected to decline by approximately 3% in 2020. Singles’ Day performances have reinforced our expectations that e-commerce will continue to drive consolidation in China’s fragmented retail market, due to the rapid growth of online channels, the scalability of online retail business and the high concentration of e-commerce in China. Implications for Brands/Retailers The learnings from Singles’ Day can be applied to upcoming shopping festivals and holidays in China. These include Black Friday on November 27, Double 12 on December 12, Christmas, and Chinese New Year in mid-February 2021.- Brands and retailers globally can consider adopting prolonged shopping holidays to allow consumers more time to browse and purchase products while reducing the pressure on logistics infrastructure, thereby creating a better shopping experience.
- It is clear that shoppers wanted to secure products as early as possible during Singles’ Day this year. Merchants should therefore take advantage of consumers’ fear of missing out by offering attractive deals from the very start of the festival, leveraging limited-quantity sales to drive traffic and lead the competition early.
- The high performance of international brands during this year’s shopping festival reflects Chinese consumer demand for overseas products. As we are likely to see depressed rates of international travel for the remainder of 2020 and into 2021, there is an opportunity for international brands and retailers in the domestic market. Brands that would otherwise have sold to Chinese tourists traveling abroad should direct their efforts to serving demand within China. Retailers with an existing Chinese presence should attempt to capture sales of products that consumers would likely have purchased overseas.