Introduction
Alibaba Group’s Tmall, and its cross-border sister marketplace Tmall Global, dominate the Singles’ Day shopping event, held on November 11 each year. This event set a new record with Alibaba recording US$30.8 billion in sales, a 27% increase over 2017. It has become increasingly important for companies to leverage Singles’ Day
to enter the China market, and Tmall and Tmall Global are becoming increasingly important springboards into China.
Our first of two reports analyzing proprietary datasets covering unit sales and discount levels on Tmall and Tmall Global reviewed cross-border demand on
Tmall Global on Singles’ Day.In this second report we focus on Tmall’s domestic site using a proprietary data set covering unit sales and pricing of selected major categories on Tmall over the Singles’ Day period. Tmall is Alibaba’s domestic business-to-consumer marketplace, so our findings reflect domestic demand by Chinese shoppers.
Methodology
In collaboration with competitive intelligence provider DataWeave, we aggregated a number of metrics, such as sales volumes and average discounts,on Tmall from October 25–November 14, 2018.We used 30-day rolling sales data for the top 500 products across 14 product categories on Tmall, recording the data weekly on October 25, November 1, 8 and 14. The figures for November 14 include Singles’ Day sales.
For the average discount rate, we looked at the percentage difference between the maximum retail price and the available price of each item. DataWeave is able to capture the price listed in text or embedded in an image.
Category-Level Analysis
Snacks and Wear Were the Best-Selling Categories
Tmall records unit sales by product on a rolling 30-day basis, and our first data set reviews these rolling totals for 14 major categories before and after Singles’ Day.
Of the 14 categories that we tracked on Tmall, snacks, men’s and women’s wear were the best-selling in the 30-day period that included Singles’ Day, followed by men’s shoes and men’s skincare.By contrast, our previous analysis of Tmall Global showed diapers and cosmetics were the best-selling cross-border categories, followed by snacks, women’s skincare and infant formula. This highlights consumer preference for imported goods in categories such as diapers, cosmetics and infant formula.
The top 500 products in snacks, men’s wear and women’s wear in total sold over 13 million units in the 30 days including Singles’ Day. In comparison,on Tmall Global, the top 500 products in snacks in aggregate sold only slightly more than 533,000 units in the 30 days including Singles’ Day.
Notable findings include the following:
- Tmall data show that the best-selling snack items were of gift hampers with different nut packs, suggesting customers also like to buy items for others, and that they are adopting a healthier trend towards snacking.
- The volume of men’s skincare products was higher than women’s skincare. In our earlier report in our Singles’ Day countdown series, we mentioned that male beauty products are now one of the fastest growing segments, growing 59% in fiscal 2017 and 54% in fiscal 2018.
Below, we chart the 30-day rolling total unit sales for the 14categories we tracked. The data for November 14 include Singles’ Day.
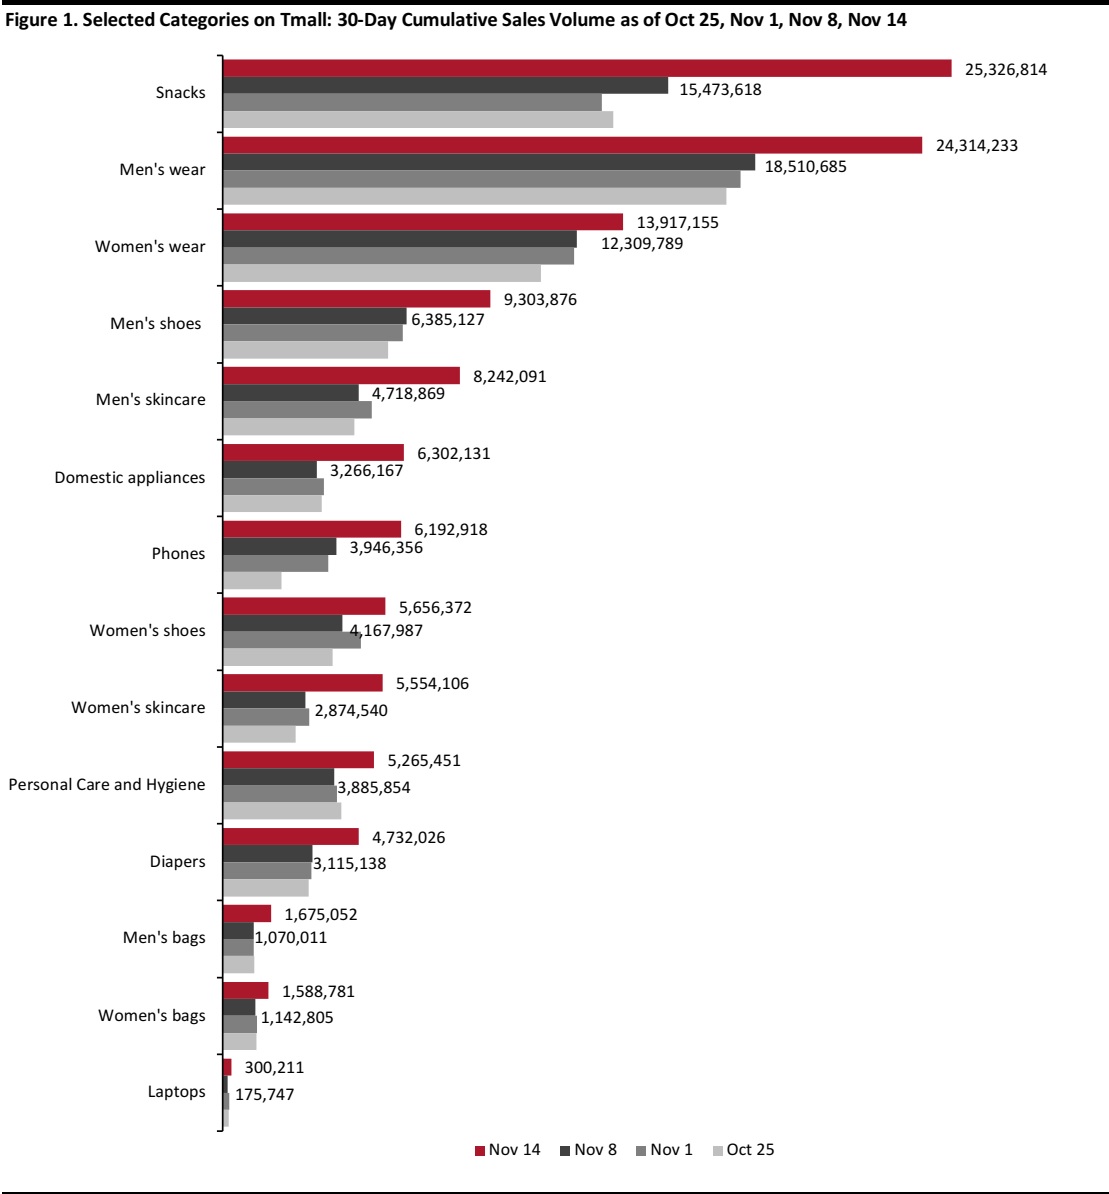
Note: Men’s wear, women’s wear and domestic appliances each include a number of subcategories. Men’s wear includes the subcategories of jackets, trousers and tops; women’s wear includes jackets, trousers, dresses and tops; and the domestic appliances categoryincludes home appliances, kitchen appliances, refrigerators and televisions.
Source: DataWeave/Coresight Research
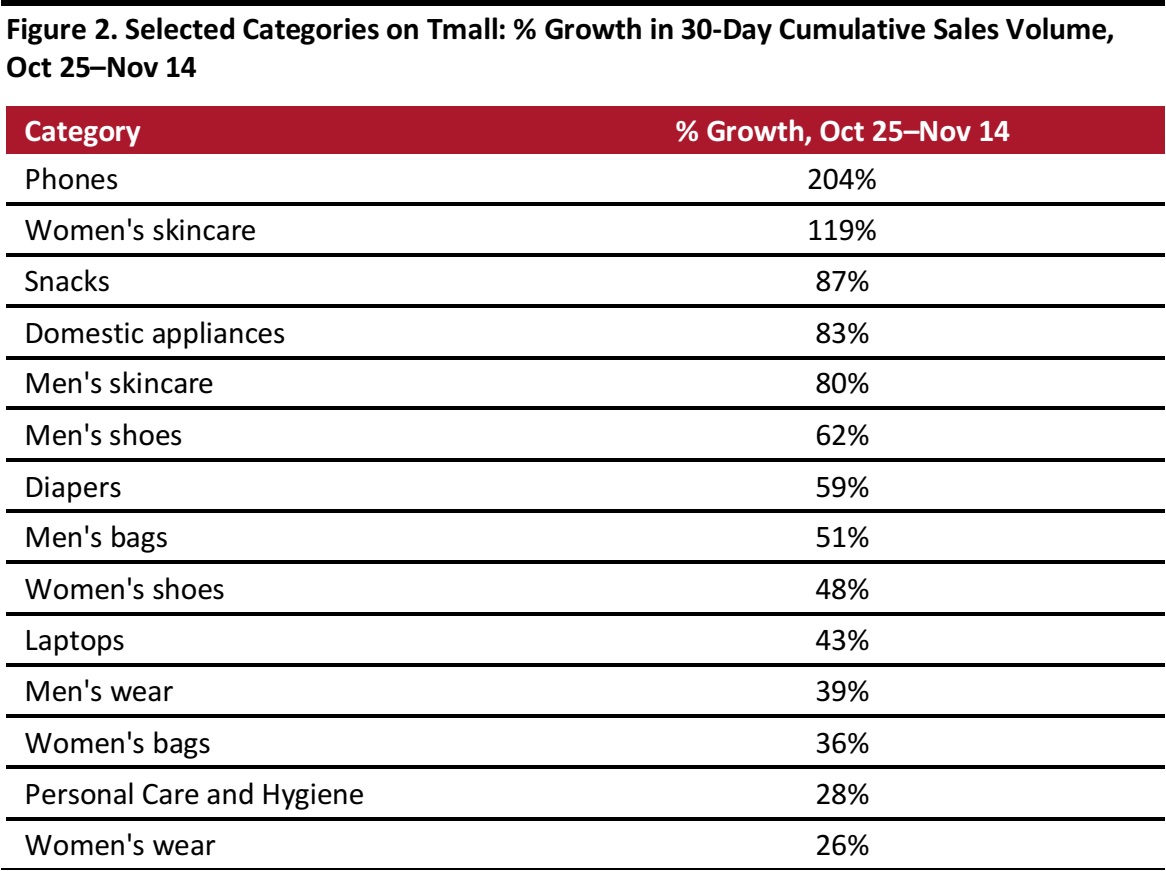
Explosive Growth in 30-Day Rolling Sales Volume from October 25 to November 14
The 30-day rolling sales volume in all categories on Tmall increased 26% or more between November 14 (which included Singles’ Day) over the 30-day period starting October 25 (which did not). The biggest uplifts were seen in phones and women’s skincare, which saw sales volume more than doubled.
On average, sales volume on Tmall grew 69% during the period, much slower than the 157% growth we tracked on Tmall Global. This is due to Tmall customers spreading purchases more evenly from start of pre-sales on October 20till Singles’ Day.
However, these figures are based on 30-day rolling totals,and so do not reflect the scale of growth on Singles’ Day itself. We provide estimated unit sales growth figures for Singles’ Day in the following section.
Source: DataWeave/Coresight Research
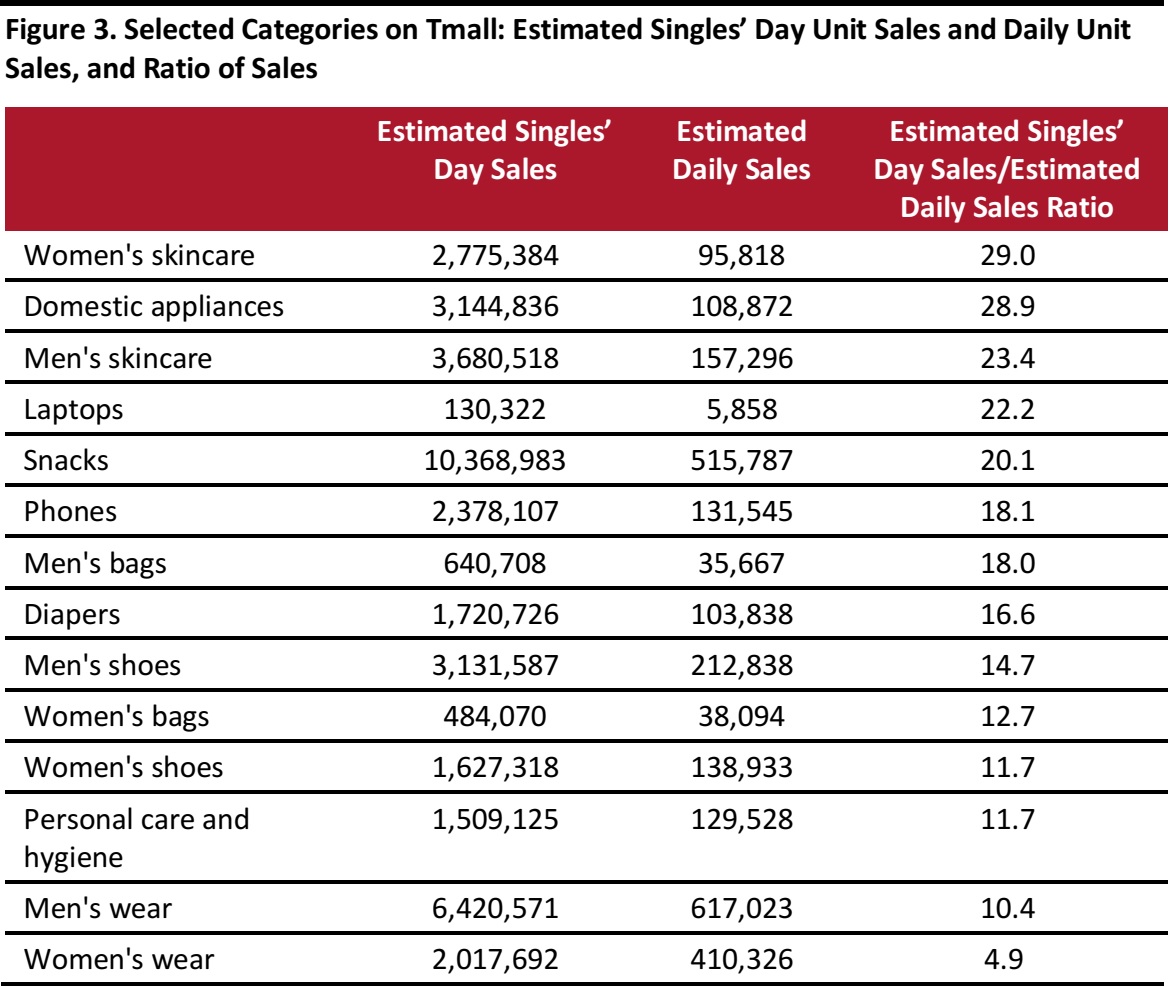
Estimated Sales Volumes on Singles’ Day Up to 30Times Those of Average Daily Sales Volumes
To estimate Singles’ Day sales, we adopted the same approach we used for Tmall Global. We calculated
additional sales generated on Singles’ Day by deducting the 30-day rolling sales at November 8 (representing a typical shopping period) with that at November 14 (which includes Singles’ Day); we then added in the underlying sales generated on a typical day on Tmall. These figures in total create our Singles’ Day estimate.
30-day rolling sales volume at November 14 (30-day sales volume including Singles’ Day).
- 30-day rolling sales volume at November 8 (30-day sales volume excluding Singles’ Day).
+ (30-day rolling sales volume at November 8/30) (Average 1-day sales volume)
Source: DataWeave/Coresight Research
Comparing estimated Singles’ Day sales volume to estimated average daily sales prior to the event, sales volumes on Singles’ Day across most categories were at least five times greater, and for some categories up to 30 times greater. For Tmall, estimated sales volume for women’s skincare on Singles’ Day was 29.0 times that of the estimated average daily sales. The growth on Singles’ Day for men’s wear and women’s wear was slower than for other categories. We believe the spikes in sales during Single’s Day is due to pent-up demand as shopping delay buying waiting for the sale. This gives retailers a huge opportunity to tap into this pent-up demand, but it means the window of opportunity is very narrow.
Despite the sales jumps, our research found that this Singles’ Day uplift ratio was much higher for Tmall Global than for Tmall: on Tmall Global, sales volumes on Singles’ Day across our 14 categories were at least 13 times greater, and sometimes up to50 times greater than that of the preceding period.
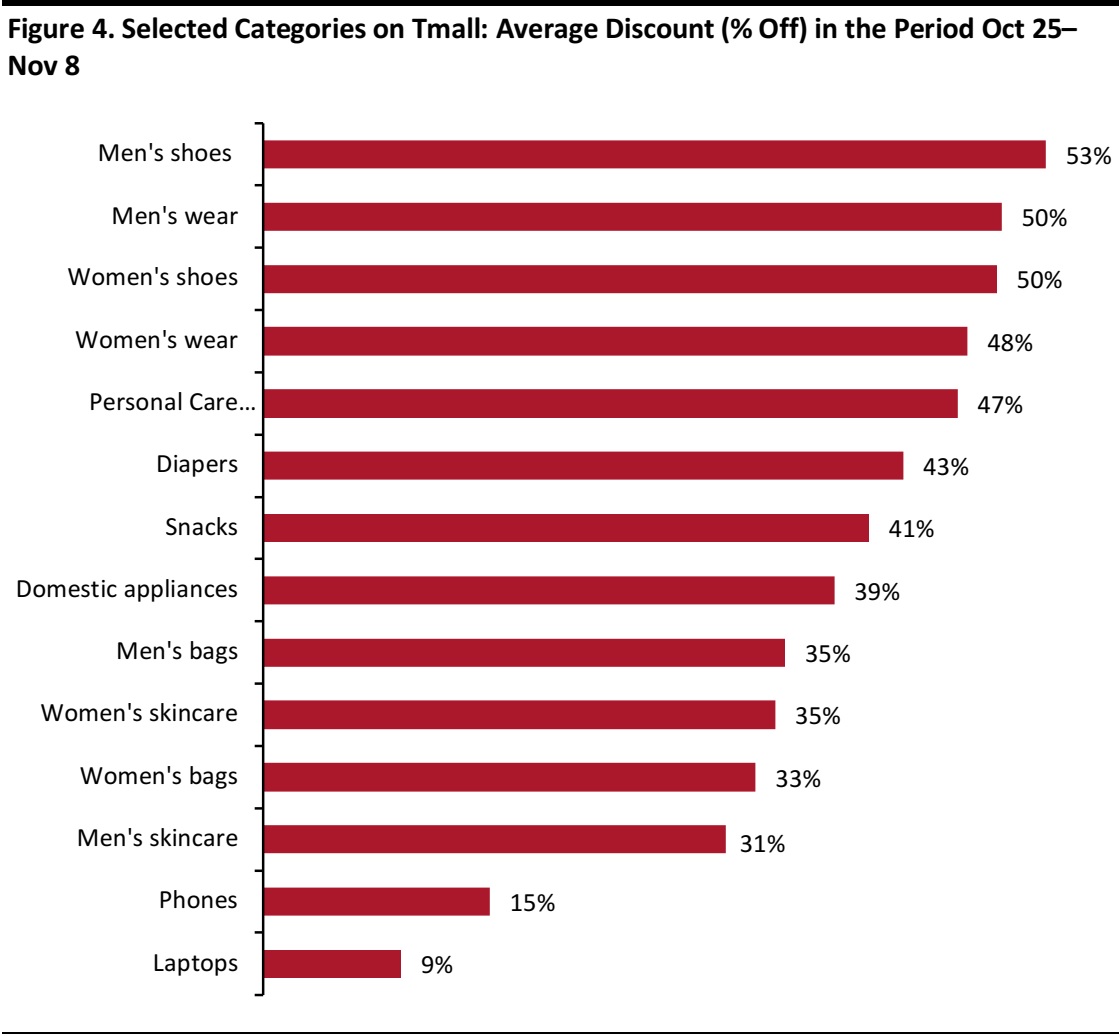
Most Categories Offered Average Discounts of 30% or More for Singles’ Day Promotion
We tracked the discount of products from October 25up to November 8to gauge the extent of discount offered in each product category.The average discount calculated below was based on averaging data across three weeks—October 25, November 1 and November 8.
Most categories on Tmall offered average discounts of over 30% in the lead up to Singles’ Day. Men’s shoes, men’s wear, women’s shoes and women’s wear were the most aggressively promoted categories, with discounts as steep as 53%, 50%, 50% and 48% respectively. The steep discounts in men’s shoes,men’s wear and women’s wear, which are possibly more price elastic product categories, may have explained them being categories with top sales volume as indicated in Figure 1. Durable goods such as phones and laptops offered average discounts of just 9–15%.
Notable findings include the following:
- On Tmall, snacks was the top-selling category in the 30-day period including Singles’ Day, yet only offered an average discount of 41% off.
- Similarly, phones, despite offering low average discount of 15% off, saw sales jump between Oct 25 to Nov 14.
This indicates customers may purchase not only based on discount, but also due to non-price factors such as customer reviews and quality.
Source: DataWeave/Coresight Research
Key Takeaways
Our data reflect sales performance, discount patterns and sales growth of various product categories on Tmall during Singles’ Day compared to the period immediately before the big promotional day.On Tmall, snacks and wear were the best-selling of the categories we tracked, followed by men’s shoes, men’s skincare and domestic appliances.In comparison, on Tmall Global, diapers, cosmetics and snacks were the best-selling of the categories we tracked. It is also found that pent-up demand is slightly weaker on Tmall compared with Tmall Global.
Considering differences in consumers’ purchase preferences across platforms, brands and retailers should adopt different pricing and promotion strategies on Singles’ Day for Tmall and Tmall Global to make the most of this opportunity.
About DataWeave
Powered by proprietary artificial intelligence (AI), DataWeave provides actionable competitive-intelligence-as-a-service to retailers and consumer brands in near real time by aggregating and analyzing data from the web. While retailers use DataWeave’s Retail Intelligence product to make smarter pricing and merchandising decisions and drive profitable growth, consumer brands use DataWeave’s Brand Analytics product to protect their brand equity online and optimize the experience delivered to shoppers on e-commerce websites. For more information, visit
its website.