Introduction
Singles’ Day in China has become a shopping extravaganza. This year, the one-day event set a new record with US$30.8 billion in sales. Singles’ Day is emerging as a critical tool for foreign companies seeking to break into the China market and its fast-growing middle class. We outlined the important dates for brands and retailers seeking to drive sales in the Chinese market
in a separate report.
In this report, we analyze a proprietary data set covering unit sales and pricing of selected major categories on Tmall Global over the Singles’ Day period. Tmall Global is Alibaba’s cross-border business-to-consumer marketplace, so our findings reflect cross-border demand by Chinese shoppers.
Methodology
In collaboration with competitive intelligence provider DataWeave, we aggregated a number of metrics, such as sales volumes and average discounts,on Tmall Global in the period October 25–November 14, 2018.We used 30-day rolling sales data for the top 500 products across 14product categories on Tmall Global, recording these data weekly on October 25, November 1, 8 and 14. The figures for November 14 include Singles’ Day sales.
For the average discount rate, we looked at the percentage difference between the maximum retail price and the available price of each item. DataWeave is able to capture the price listed in text or embedded in an image.
Category-Level Analysis
Diapers and Cosmetics Were the Best-Selling Categories
Of the categories we tracked, diapers and cosmetics were the best-selling, followed by snacks, women’s skincare and infant formula. Both cosmetics and diaper sold over 300,000 units in the 30 days before Singles’ Day. The 30-day rolling sales volume of diapers increased 172.2% and cosmetics 130%, to 836,493 and 828,022 units respectively.
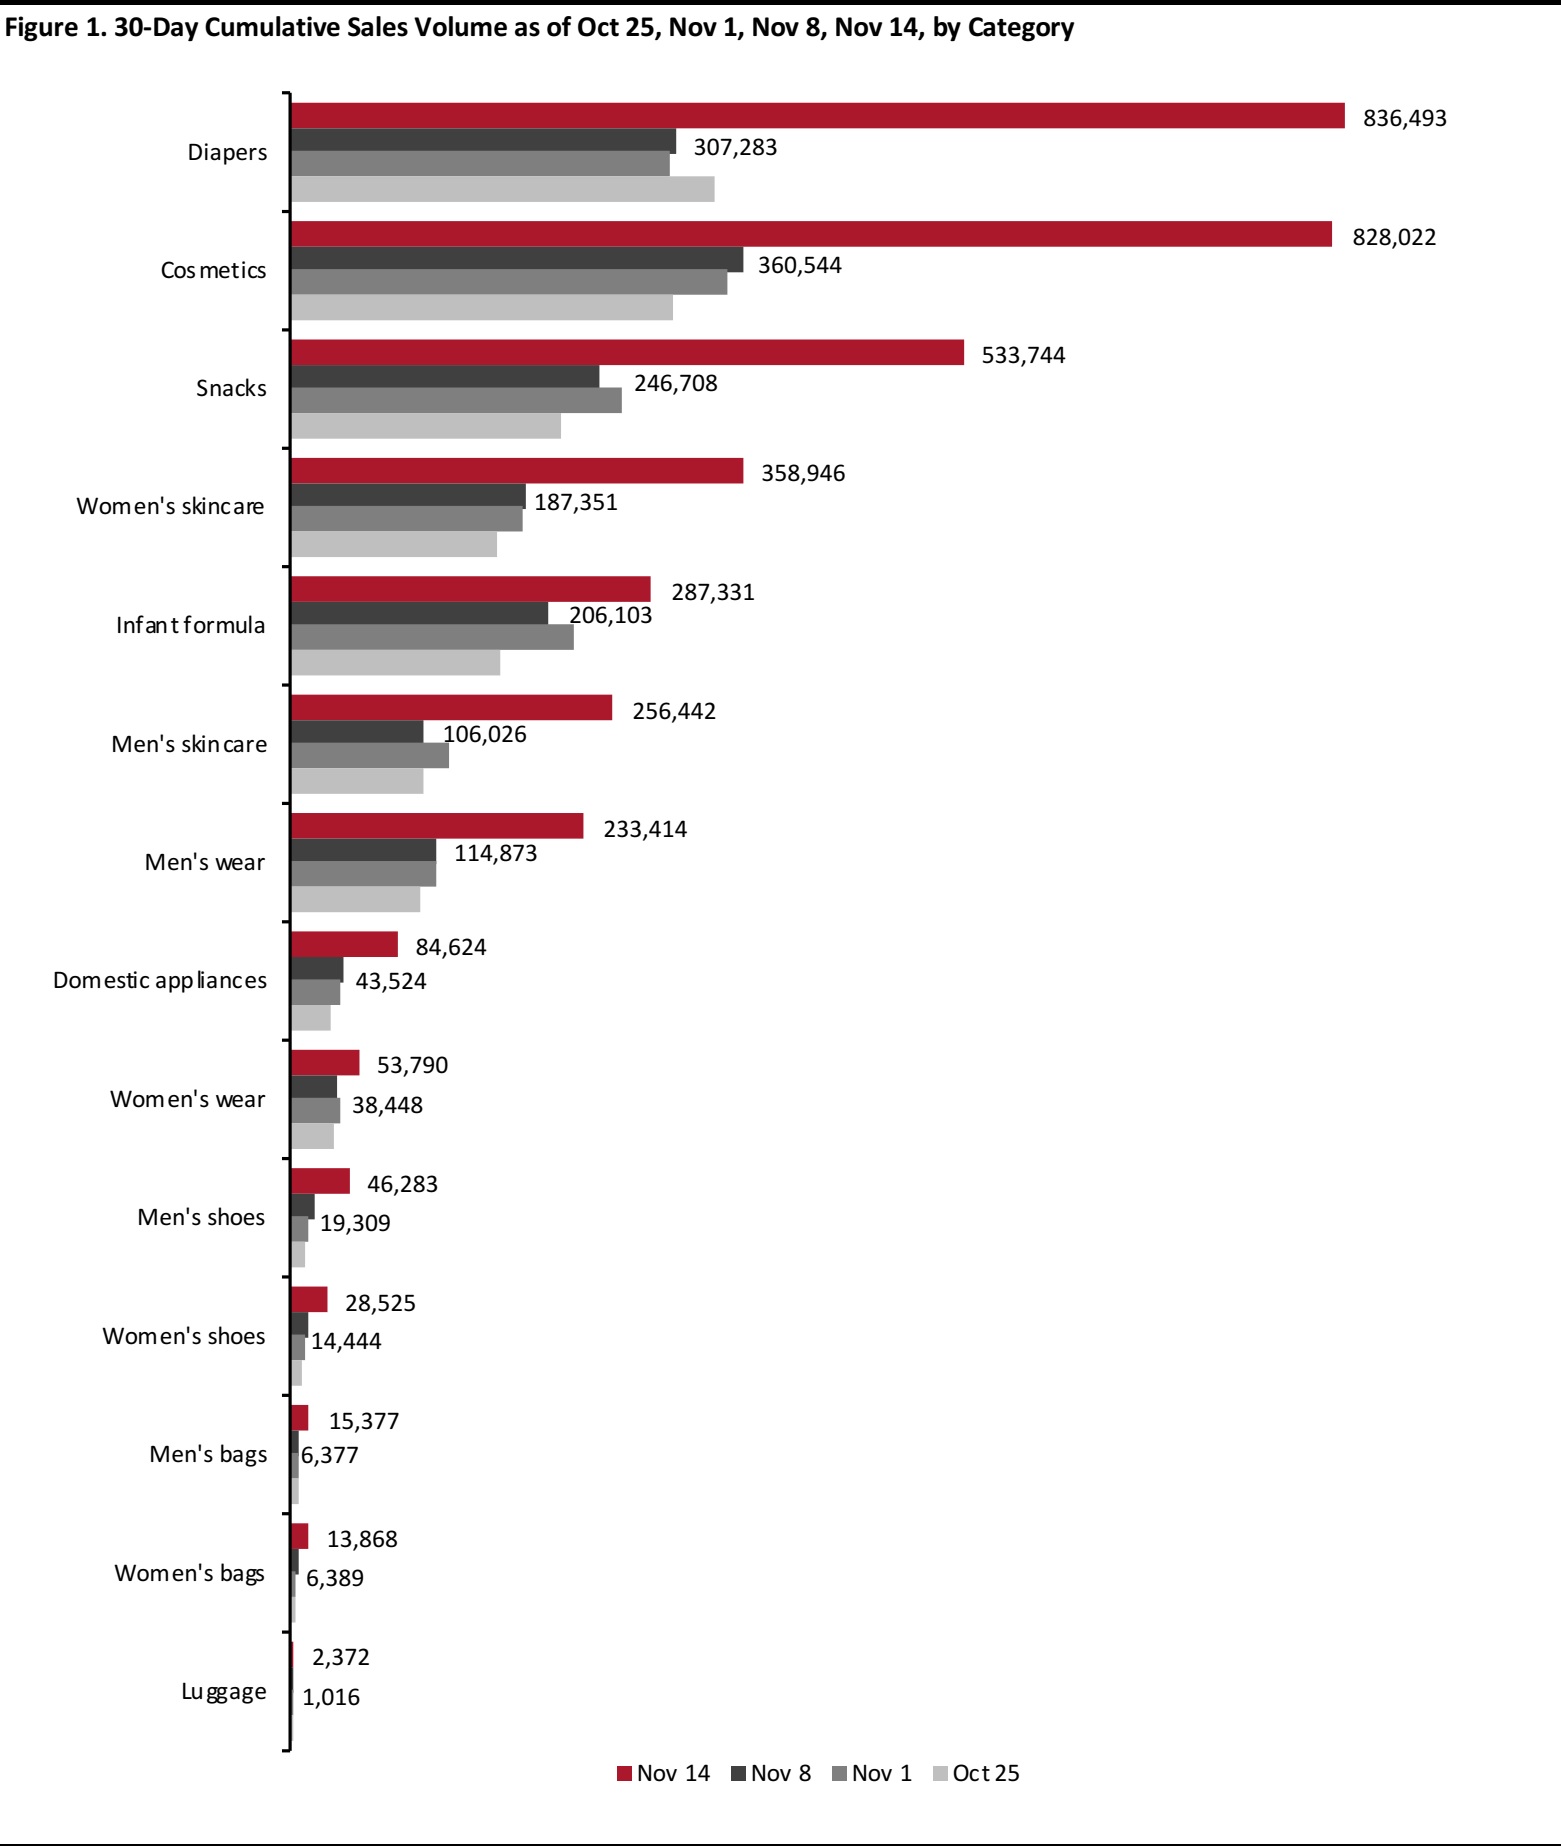 Note: Men’s wear, women’s wear and domestic appliances each include a number of subcategories. Men’s wear comprises the subcategories of jackets, trousers and tops; women’s wear comprises jackets, trousers, dresses and tops; and the domestic appliances category comprises home appliances and kitchen appliances.
Source: DataWeave/Coresight Research
Note: Men’s wear, women’s wear and domestic appliances each include a number of subcategories. Men’s wear comprises the subcategories of jackets, trousers and tops; women’s wear comprises jackets, trousers, dresses and tops; and the domestic appliances category comprises home appliances and kitchen appliances.
Source: DataWeave/Coresight Research
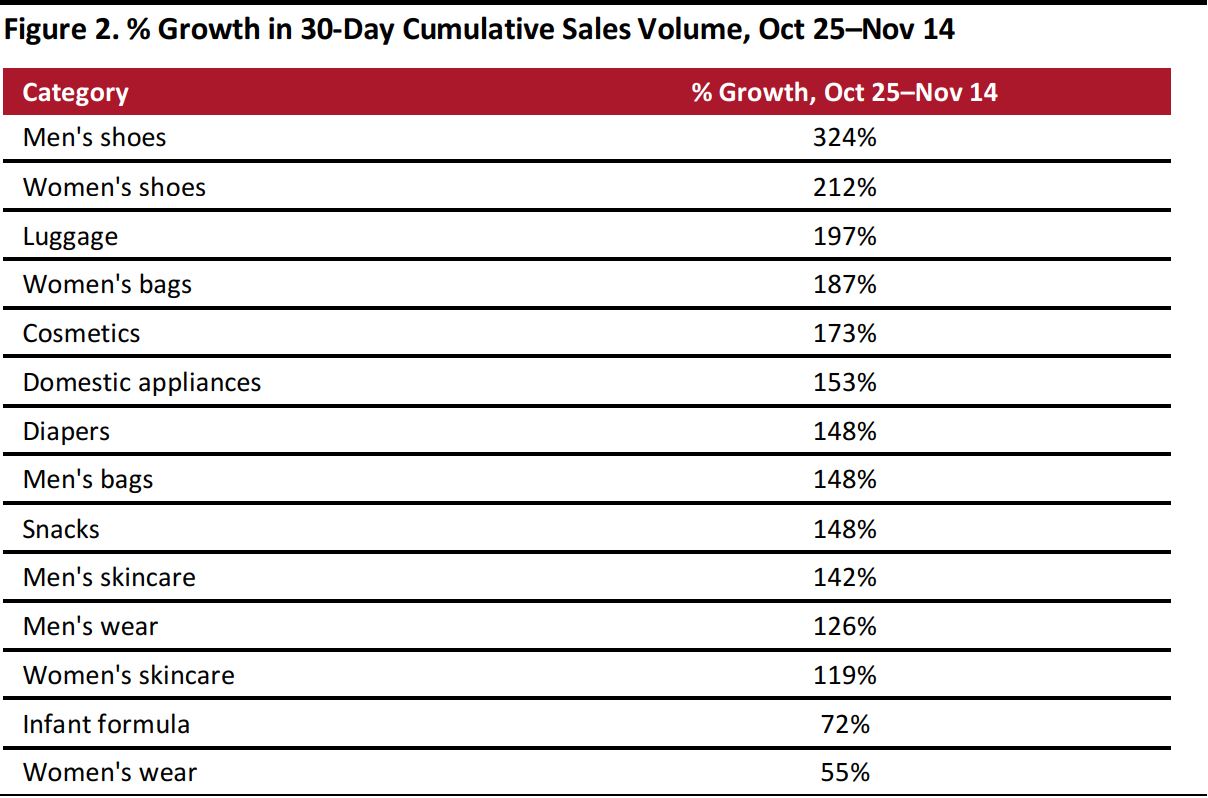
Explosive Growth in 30-Day Rolling Sales Volume from October 25 to November 14
Comparing the 30-day rolling sales volume on November 14 to those from October 25, the volume of sales in all categories except infant formula and women’s wear more than doubled. On average, the sales volume grew by 157% during the period.
However, these figures are based on 30-day rolling totals so they do not reflect the scale of growth on Singles’ Day itself. We provide estimated unit sales growth figures for Singles’ Day in the following section.
Source: DataWeave/Coresight Research
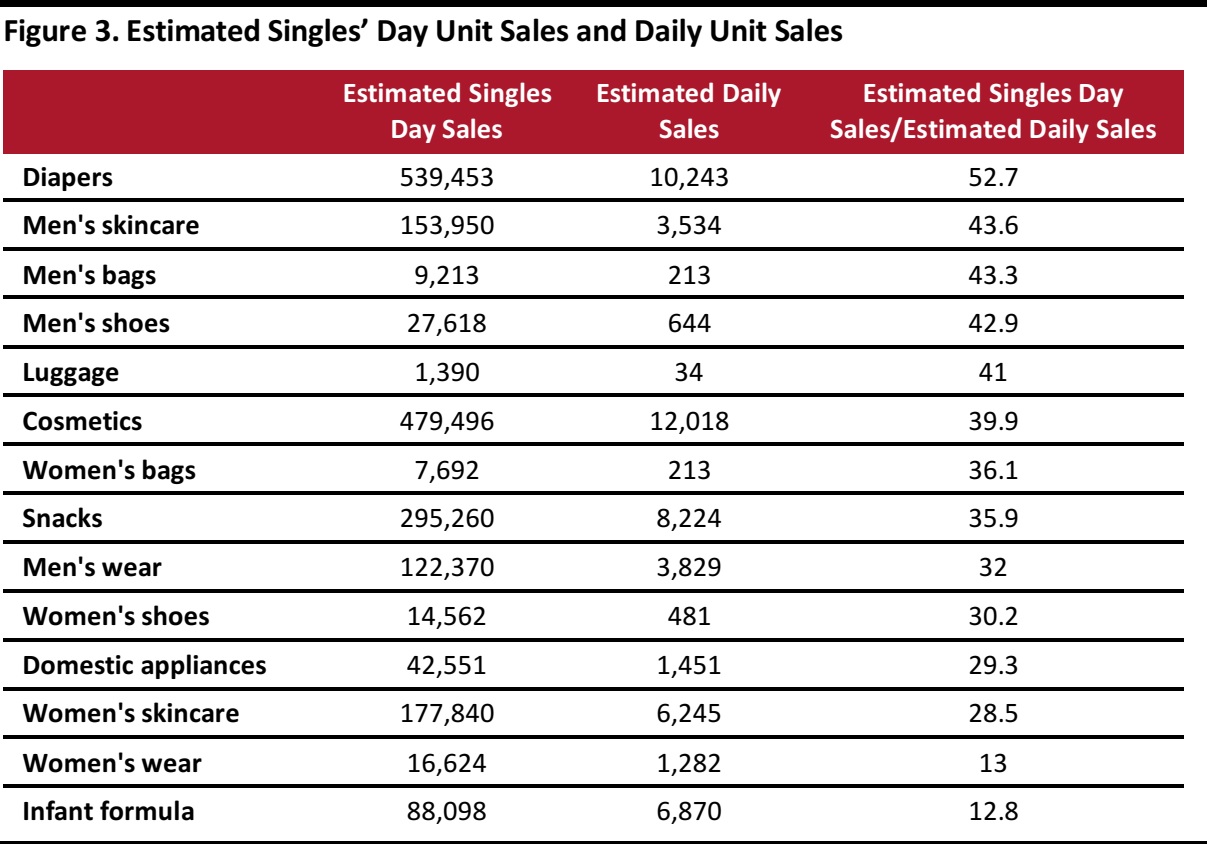
Estimated Sales Volumes on Singles’ Day Up to 50 Times Those of Average Daily Sales Volumes
To estimate the sales on Singles’ Day, we use the formula shown below. In brief, we calculate the
additional sales generated on Singles’ Day by deducting the 30-day rolling sales at November 8 (representing a typical shopping period) with that at November 14 (which includes Singles’ Day); we then add in the underlying sales generated on a typical day on Tmall Global. These figures in total create our Singles’ Day estimate.
30-day rolling sales volume at November 14 (30-day sales volume including Singles’ Day)
- 30-day rolling sales volume at November 8 (30-day sales volume excluding Singles’ Day)
+ (30-day rolling sales volume at November 8/30) (Average 1-day sales volume)
Source: DataWeave/Coresight Research
Comparing the estimated Singles’ Day sales volume to the estimated average daily sales to the 30-day rolling sales volume on November 8, sales volumes on Singles’ Day across categories were mostly at least 30 times greater—and in some categories as much as 50 times greater.
We believe consumers waited for Singles’ Day, resulting in strong pent-up demand for consumer products. In particular, we observed notable growth for men’s items including skincare, bags and shoes on Singles’ Day, suggesting male consumers tended to conserve all their purchasing power for Singles’ Day only. Overall,this reflects how important Singles’ Day is for sales and promotions to a brand and a retailer on Tmall Global.
For diapers, the estimated sales volume on Singles’ Day was 52.7 times that of estimated average daily sales. The growth on Singles’ Day for infant formula and women’s wear was lower than other categories. We estimate that sales for infant formula increased less than other categories, and this was likely due to fewer promotional discounts for infant formula as the demand for the product is less elastic and the market is dominated by a few key players.
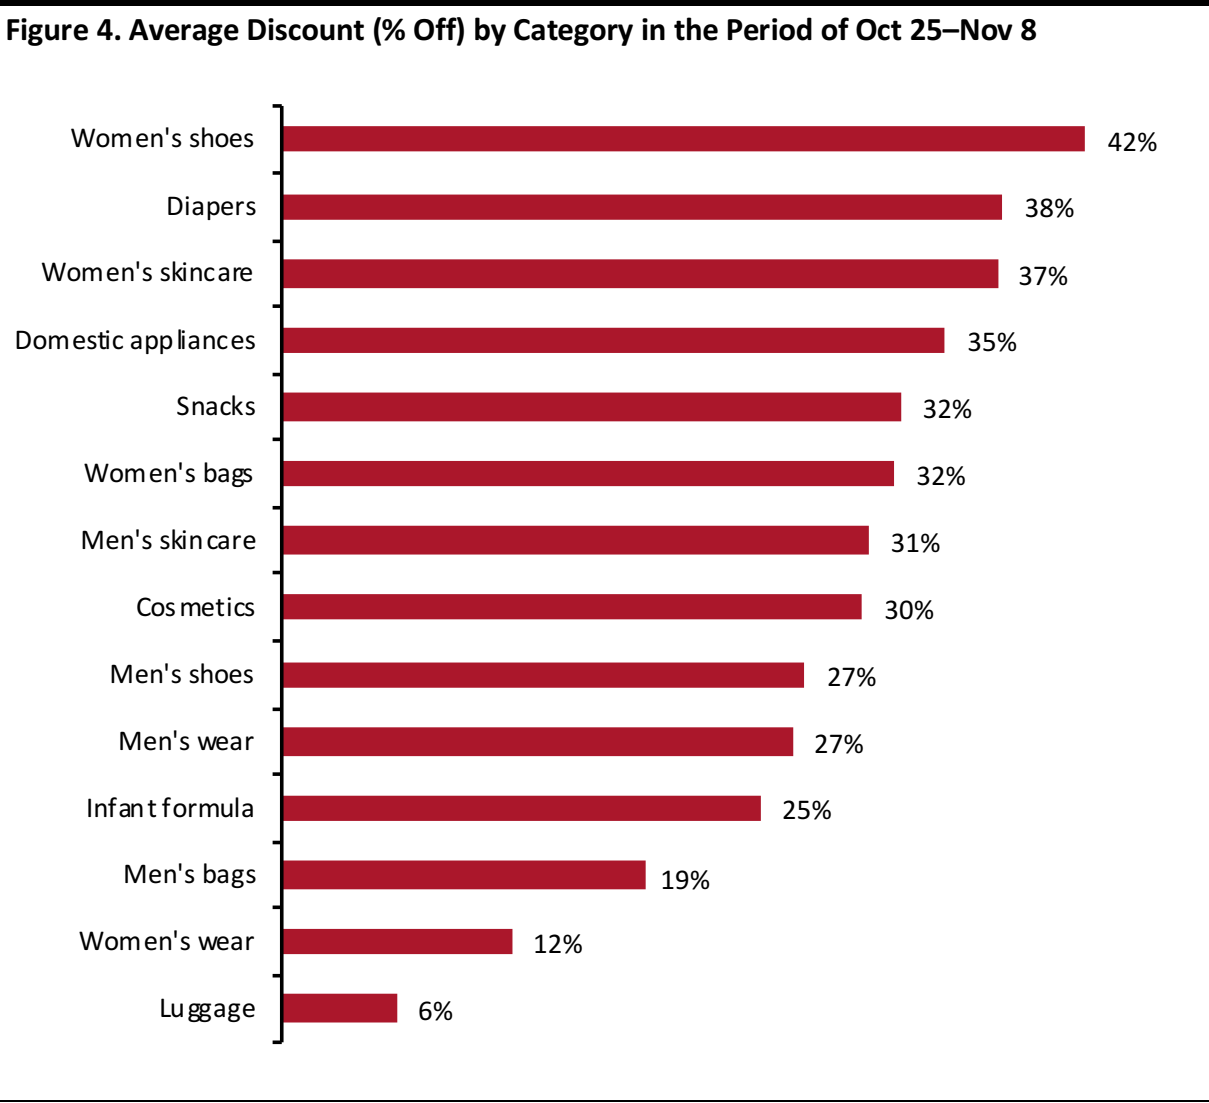
Most Categories Offered Average Discounts of 25% or More for Singles’ Day Promotion
Brands started promotional campaigns as early as October 20 when Tmall Global pre-sales began. We tracked the discount of products from October 25 to November 8 to see how heavy each category was discounting their products. Women’s shoes and diapers were the most aggressively promoted categories, with discounts as steep as 42% and 38% respectively, followed by women’s skincare at 37%. The steep discount in diapers explains the explosive growth in sales on Singles’ Day. Most categories offered average discounts of over 25%. Generally, women’s items including shoes, skincare, bags and cosmetics offered the largest average discounts.
Source: DataWeave/Coresight Research
Key Takeaways
Our data reflect the strength of cross-border demand by category. Diapers and cosmetics were the best-selling of the categories we tracked on Tmall Global, followed by snacks, women’s skincare and infant formula. Brands and retailers should plan their Singles’ Day strategy on the Tmall Global platform well in advance to ensure they make the most of this opportunity.
About DataWeave
Powered by proprietary artificial intelligence (AI), DataWeave provides actionable competitive-intelligence-as-a-service to retailers and consumer brands in near real time by aggregating and analyzing data from the web. While retailers use DataWeave’s Retail Intelligence product to make smarter pricing and merchandising decisions and drive profitable growth, consumer brands use DataWeave’s Brand Analytics product to protect their brand equity online and optimize the experience delivered to shoppers on e-commerce websites. For more information, visit
its website.