
DIpil Das
Introduction
The US has one of the faster growing senior populations among the world’s developed economies. In this report, we explore the size of the senior population in the US and its spending power. We also look at senior spending in core retail categories compared to average household spending to understand how seniors allocate their budgets.US Silvers: From 16% of the Total Population in 2018 to 20% in 2030
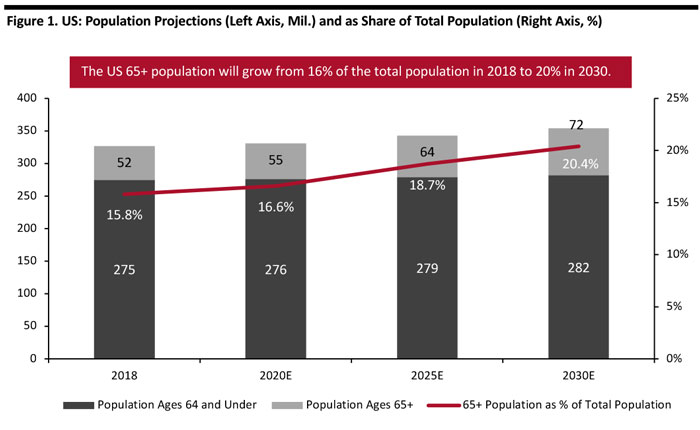
In the US and other major developed markets, the senior population is growing at a faster rate than younger age groups. According to the United Nations (UN):- The US 65+ population stood at 52 million in 2018 and will reach 72 million by 2030.
- This group accounted for 16% of the US population in 2018 and is expected to grow 40%, or 20 million, through 2030.
- This means that it will account for over a fifth or 20% of the total US population in 2030.
 Source: United Nations, Department of Economic and Social Affairs, Population Division (2017). World Population Prospects: The 2017 Revision[/caption]
In comparison, the senior population in Western Europe and Southern Europe will account for more than one-quarter of the total population by 2030.
People aged 75 and over formed some 7% of the total US population in 2018 and that demographic is expected to grow 59% to account for nearly 10% of the total population by 2030.
US Silvers: A $1.6 Trillion Consumer Segment
Silver consumers contribute a fifth of all spending in the US. In 2017, total consumer spending in the US was $7.8 trillion, and seniors accounted for $1.6 trillion of that – up 10% year over year, based on data from the Bureau of Labor Statistics (BLS).
In absolute terms, senior households tend to underindex across more categories than they overindex, which reflects relatively low levels of household spending overall. Below, we illustrate senior households’ share of estimated total household spending by category, in 2017.
[caption id="attachment_91668" align="aligncenter" width="700"]
Source: United Nations, Department of Economic and Social Affairs, Population Division (2017). World Population Prospects: The 2017 Revision[/caption]
In comparison, the senior population in Western Europe and Southern Europe will account for more than one-quarter of the total population by 2030.
People aged 75 and over formed some 7% of the total US population in 2018 and that demographic is expected to grow 59% to account for nearly 10% of the total population by 2030.
US Silvers: A $1.6 Trillion Consumer Segment
Silver consumers contribute a fifth of all spending in the US. In 2017, total consumer spending in the US was $7.8 trillion, and seniors accounted for $1.6 trillion of that – up 10% year over year, based on data from the Bureau of Labor Statistics (BLS).
In absolute terms, senior households tend to underindex across more categories than they overindex, which reflects relatively low levels of household spending overall. Below, we illustrate senior households’ share of estimated total household spending by category, in 2017.
[caption id="attachment_91668" align="aligncenter" width="700"]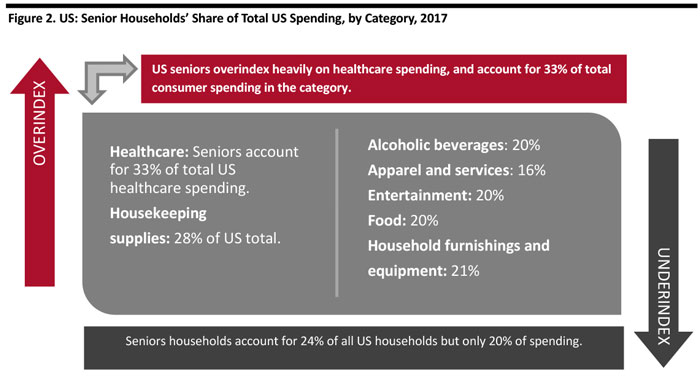 Source: BLS/Coresight Research[/caption]
Senior households underindex on spending on alcohol (accounting for 20% of total consumer spending on the category, while they make up 24% of total consumer households), entertainment (at 20% of the US total), food (20%) and household furnishings (21%), but they still account for a fifth of all spending in these categories. US seniors’ spending on apparel (at 16% of the US total) is significantly lower than their 24% share of US households, but the group overindexes heavily on spending on healthcare and housekeeping supplies.
Within the 65+ demographic there are big differences between younger seniors and older seniors. Of the $1.6 trillion spent by seniors, people aged 65-74 account for $1.0 trillion, with consumers 75 and older accounting for just $0.6 trillion.
[caption id="attachment_91669" align="aligncenter" width="700"]
Source: BLS/Coresight Research[/caption]
Senior households underindex on spending on alcohol (accounting for 20% of total consumer spending on the category, while they make up 24% of total consumer households), entertainment (at 20% of the US total), food (20%) and household furnishings (21%), but they still account for a fifth of all spending in these categories. US seniors’ spending on apparel (at 16% of the US total) is significantly lower than their 24% share of US households, but the group overindexes heavily on spending on healthcare and housekeeping supplies.
Within the 65+ demographic there are big differences between younger seniors and older seniors. Of the $1.6 trillion spent by seniors, people aged 65-74 account for $1.0 trillion, with consumers 75 and older accounting for just $0.6 trillion.
[caption id="attachment_91669" align="aligncenter" width="700"]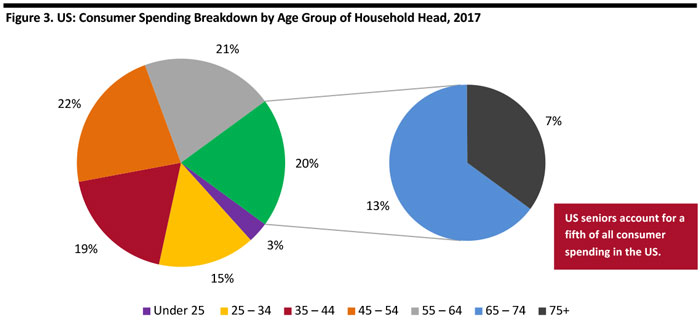 Source: BLS/Coresight Research[/caption]
How Much Do US Seniors Spend on Retail Categories?
When we last tracked US senior consumer spending, in our 2017 report Mining Silver: Identifying Opportunities in the Senior Boom, we found that consumers aged 65 and over directed more of their spending toward shopping than other age groups did in 2015. This trend continued through 2017 (the latest year for which data is available), with the share of senior households’ total expenditure directed toward retail increasing by 0.3 percentage points, to 22.5%. As the chart below shows, spending at retail is driven by younger seniors. Older seniors aged 75 accounted for 20.2% of total US consumer spending in 2015, growing slightly to 21.3% in 2017. [caption id="attachment_91671" align="aligncenter" width="700"]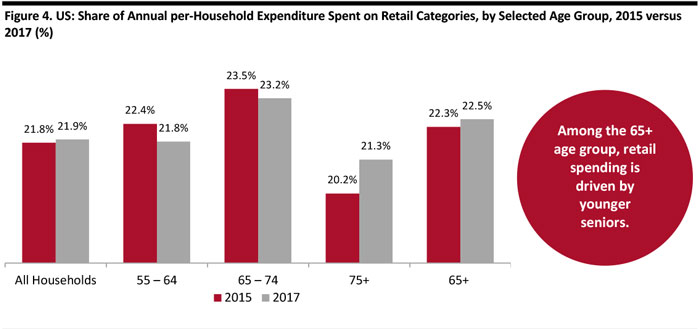 By age of “household reference person,” i.e., the head of the household
 Source: BLS/Coresight Research[/caption] In absolute terms, senior households continue to spend less in total and less on retail categories, partly due to their smaller average household sizes. In 2017, seniors spent just 82% of the amount the average US household did. In figure 5 below, we show the US retail spending data behind our analysis. The ratio of absolute spending by silver households versus the average household is shown in the final column of the table. While senior households in the US still underindex most severely in apparel and footwear, spending has been climbing, from 57% of what the average household spent in 2015 to 65% in 2017. Two outliers are housekeeping supplies (such as cleaning products) and reading (books and periodicals), on which seniors spend 134% of the national average, continue to be the only broad retail categories in which US senior households overindex. [caption id="attachment_91672" align="aligncenter" width="700"]
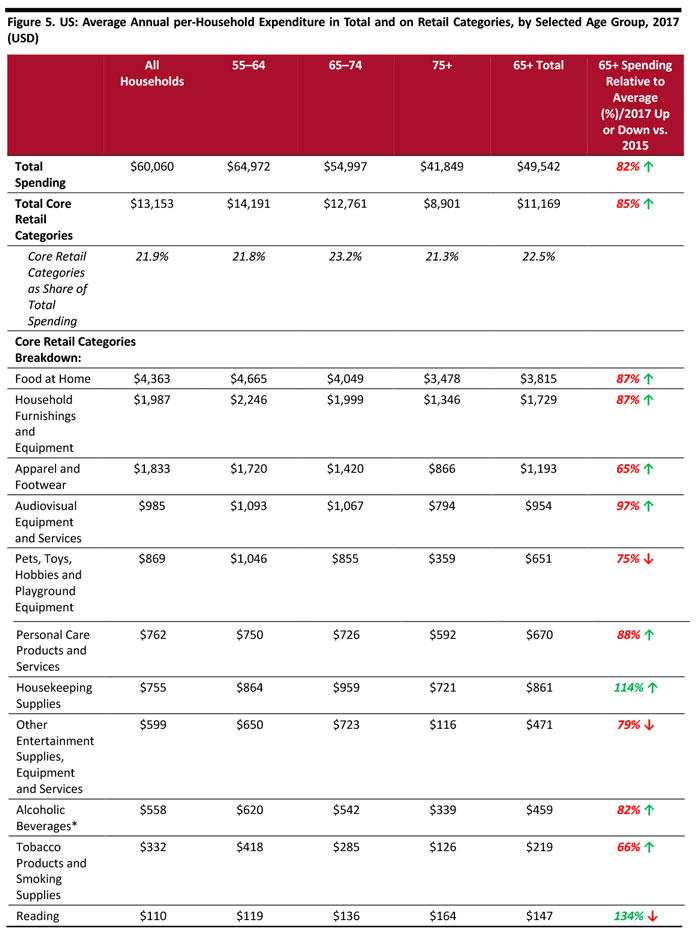 By age of “household reference person,” i.e., the head of the household. ↑ indicates an increase and ↓ indicates a decrease compared to 2015. *Includes an element of spending on services
 Source: BLS/Coresight Research [/caption] Since 2015, senior consumer spending relative to the average consumer household has grown – in terms of total spending and across several retail categories. We examine senior consumer behavior and attitudes across selected retail categories – apparel and footwear, food and beauty and personal care – as we think these are top consumer spending categories and have potential for further growth. For information on these categories, read our Sector Overview reports:
- Apparel & Footwear — Consumer Connectivity Changing Sector Landscape
- North American Food Retailers — Cross-Channel Retailing Is Emerging as the Dominant Model
Apparel and Footwear: Saving Money Key but Clothing Purchases Are Low Priority
Seniors spend just 65% of what the typical US household spends on apparel and footwear, and while they are severely underindexing in this category, this is up from 57% in 2015. For many older shoppers, clothing and footwear purchases appear to be more out of function rather than out of desire but cost-saving is not a top priority when they do spend on clothing. They care about the environment, are conscious about the way clothing is produced and are even willing pay more for clothing producing sustainably.- Seniors are frugal spenders on clothing: In our January-February 2019 consumer survey, 52% of shoppers aged 60 and over (whom we will refer to as senior or older shoppers in discussions regarding this survey) said that they usually try to save money through special offers when shopping for clothing or footwear.
- Spending on clothing takes low priority for seniors compared to younger shoppers: Slightly less than half of 60+ shoppers indicated that clothing is less of a spending priority now than it was three years ago, whereas only about a quarter of shoppers from other age groups said the same.
- Seniors are environmentally conscious apparel shoppers: A greater proportion of senior shoppers are concerned about environmental issues and eco-friendly clothing production than other age groups.
- A greater proportion of seniors than younger shoppers will pay more for eco-friendly clothing: Fully 26% of 60+ shoppers said they try to buy from brands or retailers they perceive to have a good record on environmental issues, while 23% of indicated they will pay more for clothes produced in an environmentally friendly way.
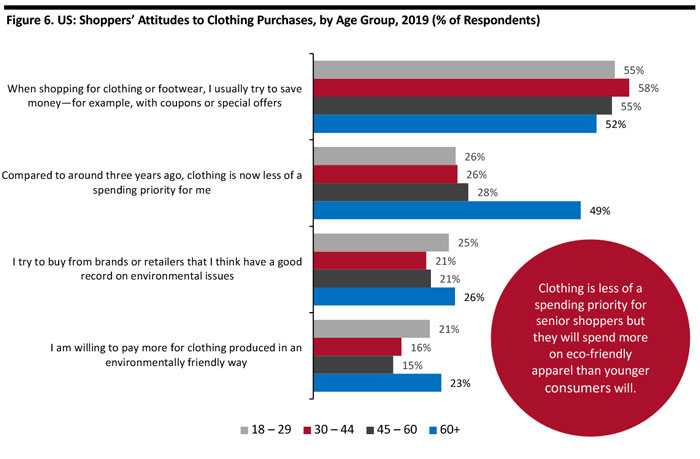 Base: 1,729 US Internet users ages 18+
 Source: Coresight Research [/caption]
Food: Wellness is Important and Mature Shoppers Will Pay More for Healthier Food
In 2017, silver households spent 87% of the amount typical households spend on food, up from 85% in 2015, indicating incremental progress in seniors’ share of total consumer spending. Older consumers spend heavily on healthcare compared to other age groups. In 2017, they accounted for a third of all consumer spending on healthcare in the US, so it is not surprising they willing to spend more on wellness, fitness and healthier food.- Seniors are wellness- and fitness-focused shoppers: Fully 58% of senior shoppers in our 2019 survey indicated that wellness is important to them and one-third said that they prioritize spending on wellness and fitness more now than they did three years ago.
- Seniors will pay more for healthier food: Some 37% of older shoppers said they will pay more for healthier food — the same or a greater proportion than shoppers in other age groups. At the same time, a little less than 60% of shoppers aged 60+ said they look to save money while shopping for food by using coupons or special offers — this is broadly in line with most younger age groups.
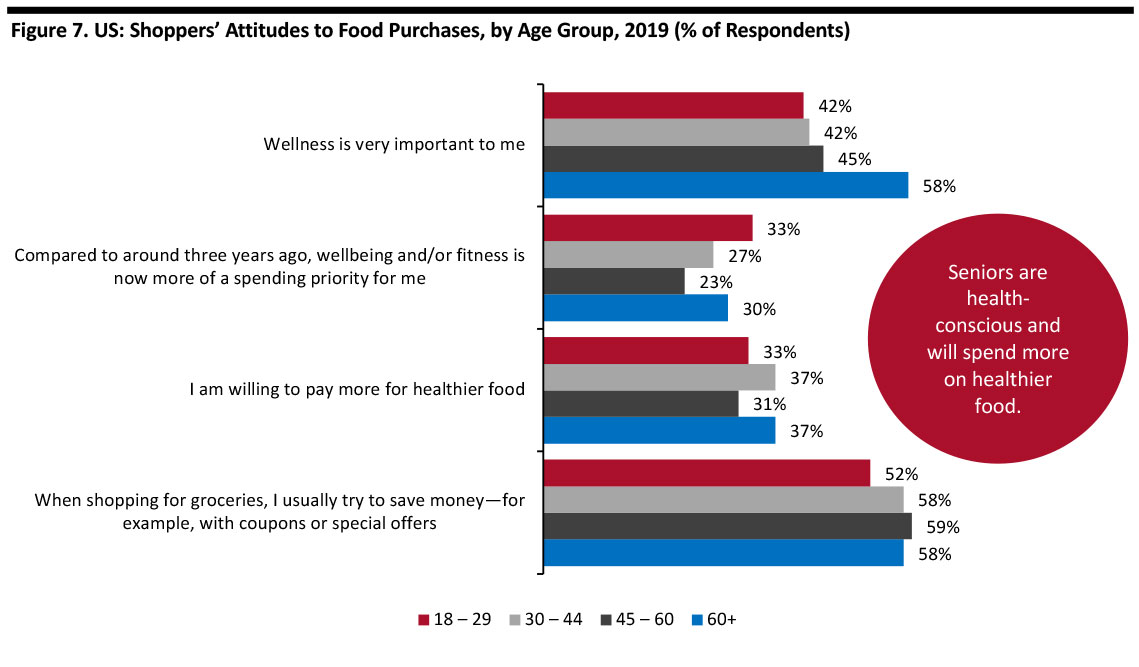 Base: 1,729 US Internet users ages 18+
 Source: Coresight Research [/caption]
Beauty and Personal Care: Preference for Conventional Beauty Products High
Senior household spending on personal care products and services was 88% of the typical household spend in 2017, up from 84% in 2015. Seniors’ preference for eco-friendly products in clothing and footwear does not trickle across through to personal care categories.- Seniors prefer conventional beauty products over those that are organically produced: Many senior shoppers have indicated a preference for conventional beauty products over organic beauty products, according to a 2017 survey of US adults by Statista. Some 70% of shoppers aged 60 and over said they purchase almost only or mainly conventional beauty and personal care products, while a greater proportion of younger shoppers said they would buy both types of products equally or would buy more organic beauty products.
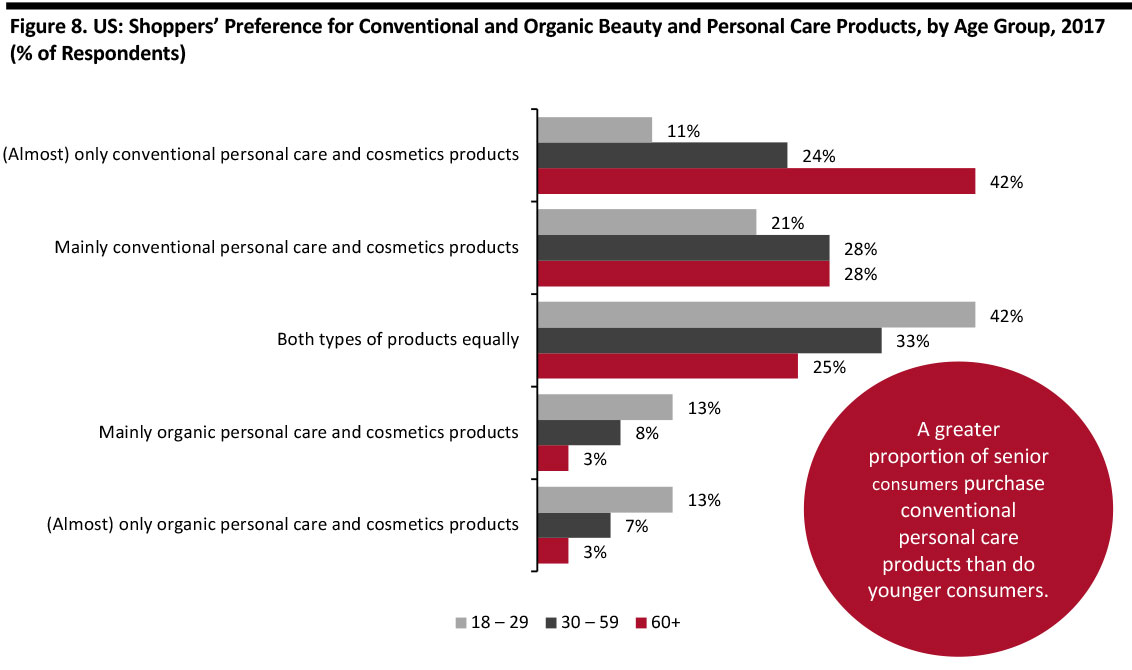 Base: 1,039 US Internet users ages 18+
 Source: Statista [/caption]
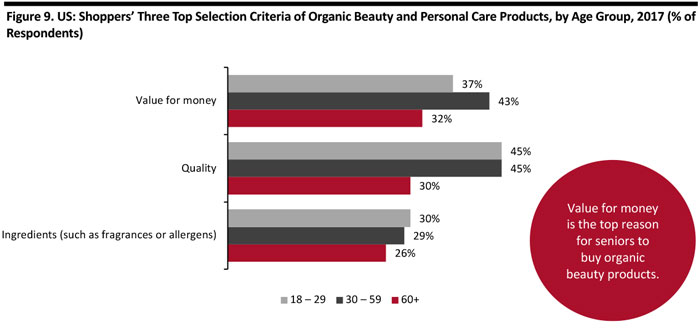
- Seniors are selective in choosing organic beauty products: Older shoppers who do buy organic beauty products are selective with their reasons and over a quarter will buy organic only if they perceive benefits, in terms of value or quality, for the money spent. Top reasons for senior shoppers to select organic beauty products value for money, quality and ingredients, similar to the reasons cited by younger shoppers.
 Base: 1,039 US Internet users ages 18+
 Source: Statista [/caption]