
Nitheesh NH
Introduction
Aging populations impact the economy and society in various ways. In many parts of the world, as older populations grow in size, they present a growing burden to the economy as fewer younger workers have to support benefits for more retirees. But this shift also brings opportunities for retailers and services providers. In this report, we examine the size and growth of the senior population in Europe and key population and spending data in the UK — a major economy in a region in which the population is aging fast.Europe Silvers: Older Southern Europe and Younger Eastern Europe
In many parts of Europe, the senior population (65 and over) already accounts for 20% of the total population and will expand to 25% by 2030. According to the United Nations (UN):- In both western Europe and southern Europe, those aged 65+ accounted for a fifth of the total population in 2018, and will form .
- Countries in northern Europe (which includes the UK) and eastern Europe have younger comparatively populations and will reach roughly the levels their southern and western counterparts saw in 2018 only by 2030.
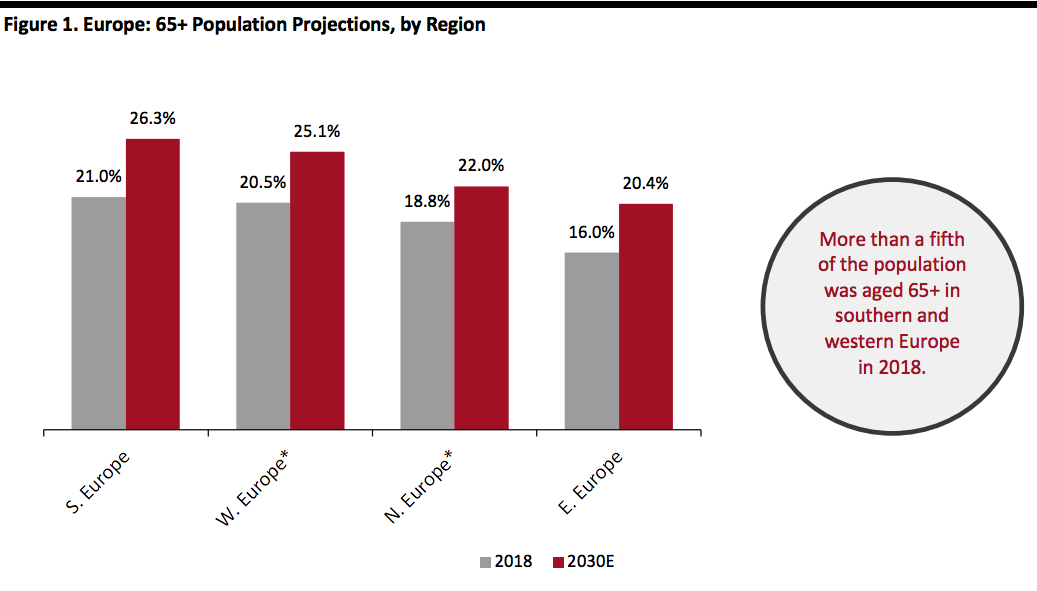 *Germany and France are included in W. Europe. The UK is included in N. Europe.
Source: UN Department of Economic and Social Affairs, Population Division. World Population Prospects: The 2017 Revision[/caption] Below, we focus on the UK, to examine how the population is aging and what senior consumers are spending on.
The UK: Slowly Aging; Healthcare is Major Spending Category
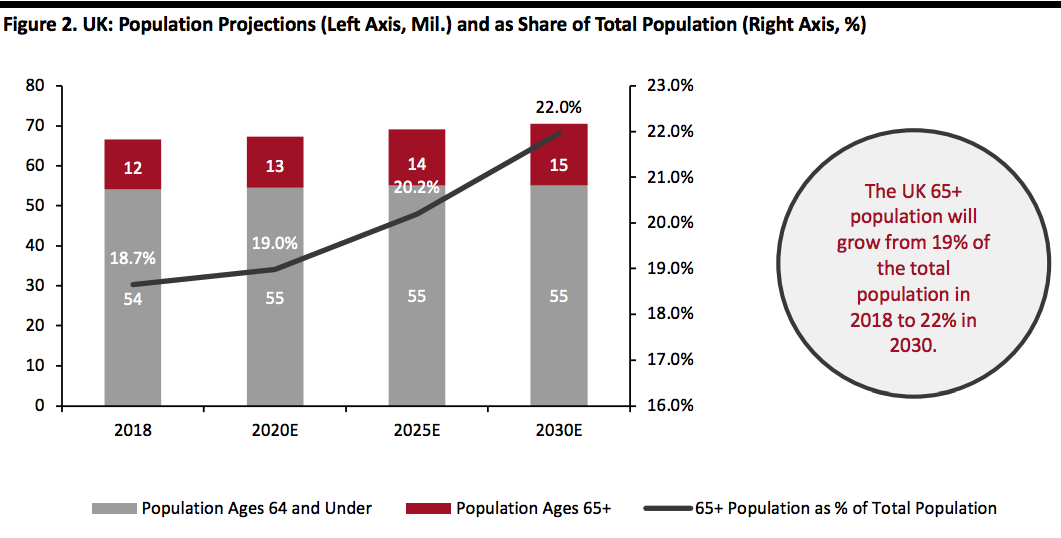
In the UK, the senior population is aging more slowly than in the US. We discussed the senior population in the US, its spending power and spending habits- The UK 65+ population stood at 12 million in 2018 and will reach an estimated 15 million by 2030.
- This group accounted for 19% of the UK population in 2018 and is expected to grow 25%, or three million, through 2030.
- This means seniors will account for over a fifth of the total UK population in 2030.
 Source: United Nations, Department of Economic and Social Affairs, Population Division (2017). World Population Prospects: The 2017 Revision[/caption]
UK Silver Households Account for Nearly a Third of All UK Households
Senior households account for 29% of all households in the UK but Senior household sizes are also relatively smaller — and this helps account for their lower spending: households headed by those aged 65–74 average 1.8 people, while those headed by consumers aged 75 and over average 1.5 people. The overall average UK household size is 2.5 people, and over 3 among those headed by consumers aged 30–49. [caption id="attachment_95327" align="aligncenter" width="700"]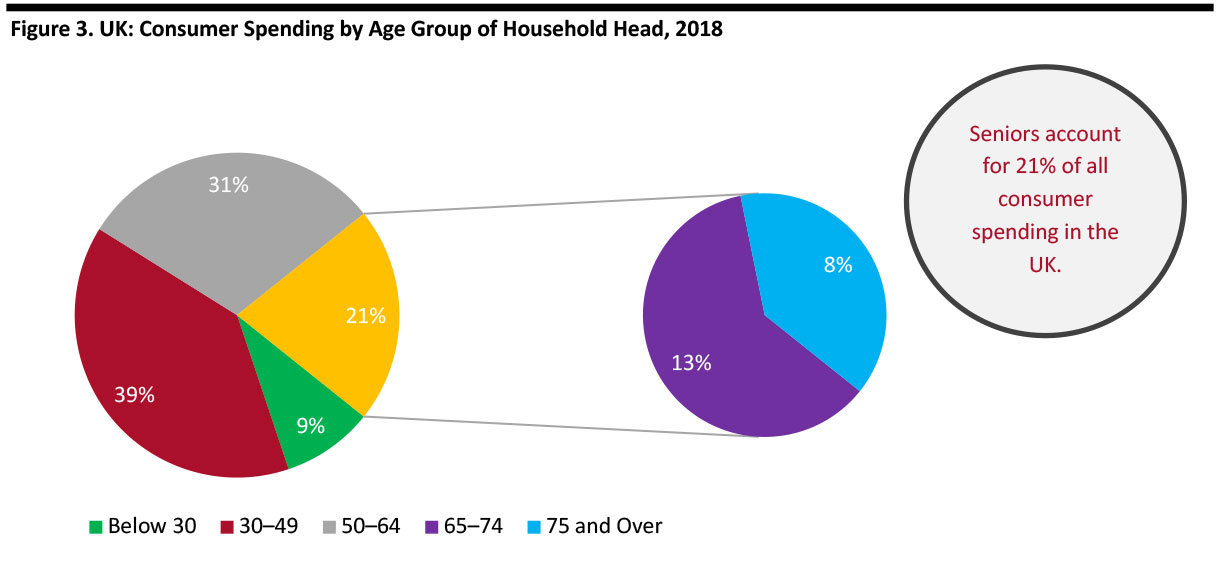 Source: ONS[/caption]
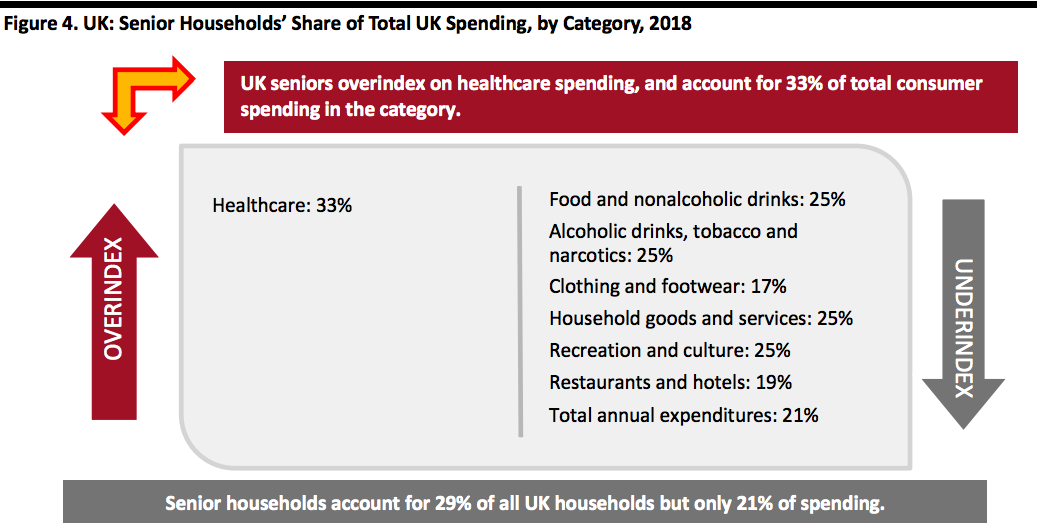
In absolute terms, senior households tend to underindex across more categories than they overindex, which reflects relatively low levels of household spending overall. Below, we illustrate senior households’ share of estimated total household spending by category in 2018.
[caption id="attachment_95287" align="aligncenter" width="700"]
 Source: ONS/Coresight Research[/caption]
Senior households underindex on spending on nearly all major categories, food and nonalcoholic drinks; alcoholic drinks, tobacco and narcotics; household goods and services; and, recreation and culture (accounting for 25% of total consumer spending on the categories, while they make up 29% of the total consumer households). UK seniors’ spending on restaurants and hotels (at 19% of the US total) and apparel (at 17% of the US total) is significantly lower than their 29% share of US households, but the group overindexes on spending on healthcare.
Similar to spending among US seniors, as we observed in our report Silver Consumers in the US, 2019, spending by UK seniors declines with age. Of the £173 billion spent by silvers, people aged 65-74 account for £106 billion, with consumers 75 and older accounting for just £67 billion.
How Much Do UK Seniors Spend on Retail Categories?
Silver consumers in the UK allocate more of their spending to shopping than do other age groups, similar to what we observed among US seniors. As the graph below shows, this retail spending is driven by younger seniors. [caption id="attachment_95328" align="aligncenter" width="700"]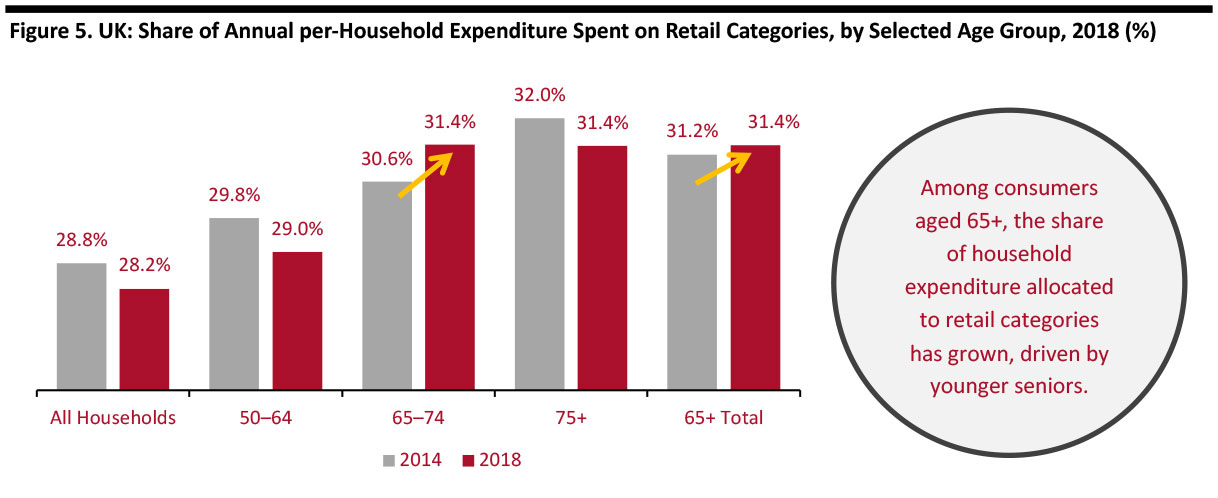 By age of “household reference person,” i.e., the head of the household
Source: ONS/Coresight Research[/caption] In figure 6 below, we present the spending data behind our analysis, showing the categories we consider to be retail categories. The final column of the table shows the ratio of absolute spending by silver households versus the average household. In absolute terms, senior households continue to spend less in total and less on retail categories, partly due to their smaller average household sizes, but their share of average household spending has grown since 2014. In 2018, seniors spent just 74% of the amount spent by the average UK household. While senior households in the UK still underindex most severely in clothing and footwear, spending has been rising, from 52% of average household spend in 2014 to 60% in 2018. The only categories in which British senior households overindex are: household textiles (105% of the average, and a switch from underindexing at 89% in 2014), household appliances (113% of average), goods and services for routine household maintenance (106% of the average), and reading and stationery (136% of the average). [caption id="attachment_95289" align="aligncenter" width="700"]
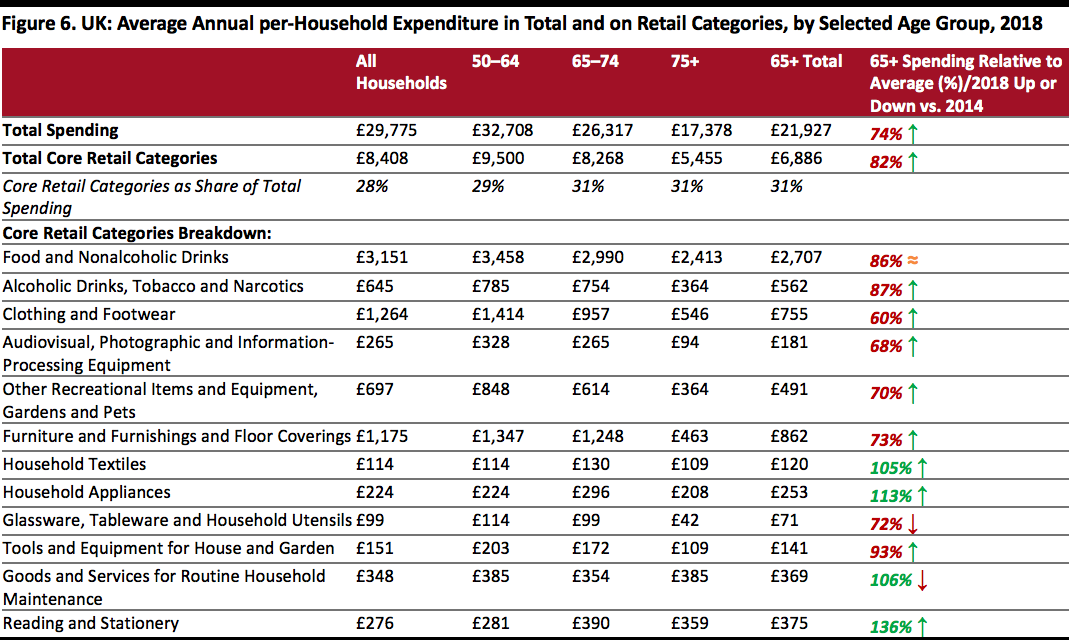 By age of “household reference person,” i.e., the head of the household. 2018 data are latest breakdown. ↑ indicates an increase, ↓ indicates a decrease and ≈ indicates no change compared to 2014.
Source: ONS/Coresight Research[/caption] Silver consumer spending relative to the average consumer household has grown – in terms of total spending and across several retail categories – since 2014 (we used 2014 data, the latest available then, in our earlier report Mining Silver: Identifying Opportunities in the Silver Boom). To tap this segment, retailers must pay attention to its unique preferences and what they want in-store.
Older Shoppers Want Polite Human Interaction and a Comfortable Shopping Experience
Age UK, a British charity that works with older people, held workshops in 2015 to listen to people’s experiences when they shop or when they use customer services. Many expressed they tend to feel overlooked, for example, while shopping for beauty products, or patronized while using certain services, such as the car wash. Those to whom Age UK spoke said regular shopping activities include grocery, clothing, at department stores, online or by phone, and visiting at garden centers and craft shops – indicative of their hobbies. With grocery shopping being a popular activity among older consumers, Age UK surveyed 363 adults aged 65 and over in 2016 to understand what features they look for while shopping for groceries. A quarter said they want parking facilities while 18% want staff to be polite. A number of respondents simply expect accessible aisles and facilities, such as toilets or a place to sit. [caption id="attachment_95290" align="aligncenter" width="700"]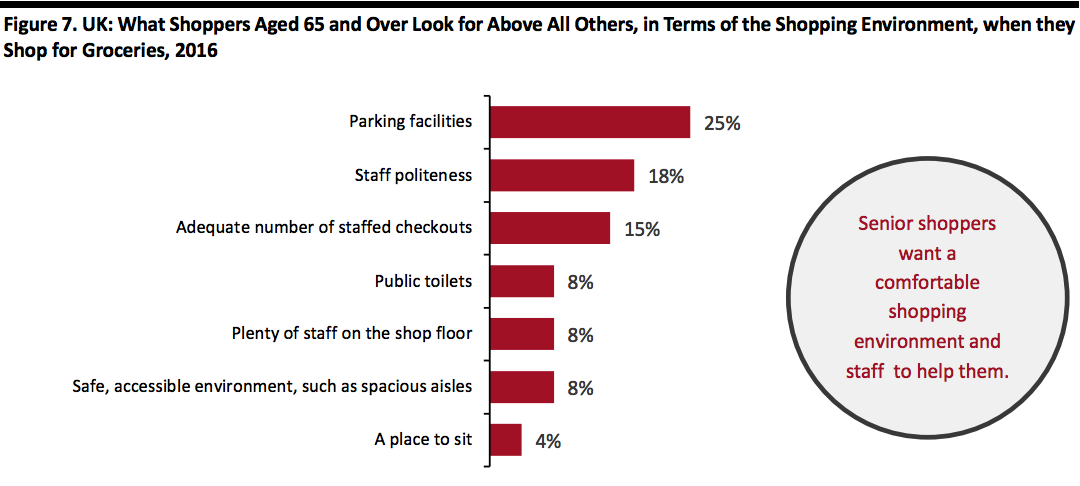 Base: 363 adults aged 65 and over surveyed June 2016
Source: Age UK/TNS[/caption] Findings in this survey conform with another survey the charity Anchor conducted in 2017. Automated checkouts discourage some 24% of seniors from going shopping and some 60% are worried they may not have a place to sit if they need to rest while shopping.
UK Silvers: Influences for Choosing Retailers
Google searches are the most popular choice, according to data from Statista and deals site hotukdeals. Other popular methods are visiting retailers’ websites or apps directly, word-of-mouth recommendations and shopping at the same retailer. Younger consumers, on the other hand, are less dependent on Google searches and use social media more than older shoppers to research retailers. Advertising age-friendly facilities (the ones seniors look for as outlined above) could draw more of this segment to specific locations as they do leverage Google and other Internet searches, visit retailers’ apps and websites or look at advertisements. [caption id="attachment_95291" align="aligncenter" width="700"]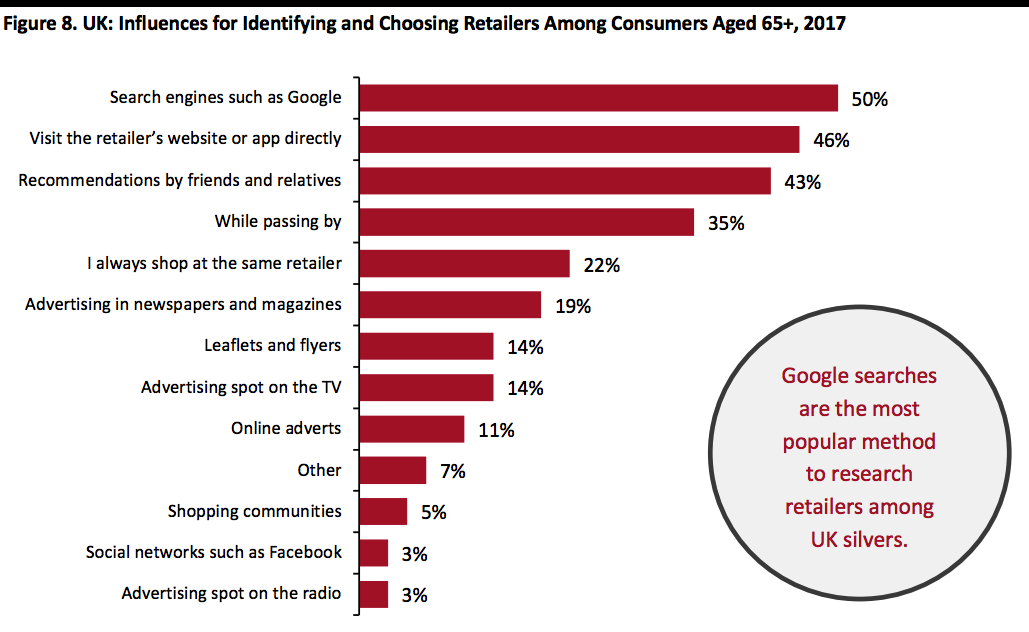 Base: 2,003 UK consumers aged 16 and over surveyed in September 2017
Source: Statista and hotukdeals[/caption]
Where Seniors Like to Shop
For UK baby boomers (1946-1964) Marks & Spencer (M&S) is the most popular department store, home store and supermarket, according to YouGov data. As data specific to shoppers aged 65 and over was unavailable, we are referring to baby boomers as a proxy for this demographic. Among UK supermarkets, baby boomers and generation X shoppers (those born 1965-1981), M&S Food is the most popular destination, indicating that shoppers in this age group value a premium food and shopping experience. On the other hand, Tesco, the UK’s biggest grocery retailer, is the most popular choice for millennials (those born 1982-1999) indicating that younger consumers prefer value for money and discounts over premium products and experience. [caption id="attachment_95329" align="aligncenter" width="700"]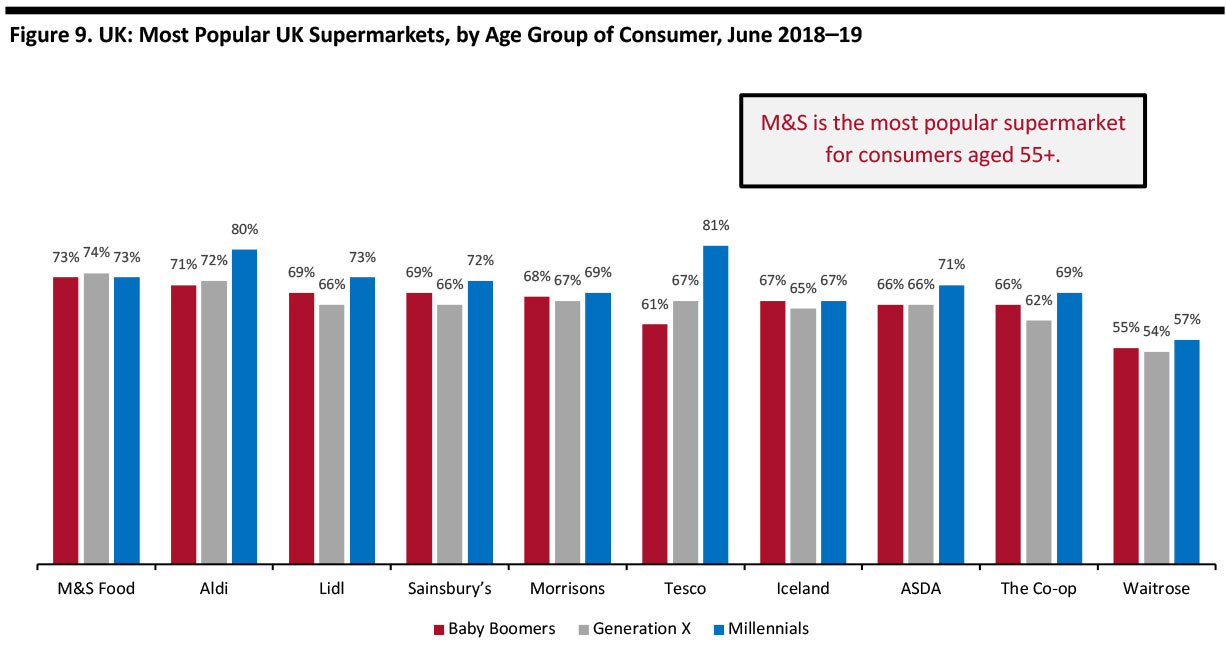 11,098 interviews conducted between June 2018 and June 2019.
Source: YouGov[/caption] For baby boomers and generation X shoppers, M&S is the most popular department and home store. And while a similar proportion of millennials find the department store popular, the majority choose Ikea as the most popular department and home shopping destination. Similar to food shopping, older shoppers seek a more refined shopping experience than do younger shoppers. [caption id="attachment_95330" align="aligncenter" width="700"]
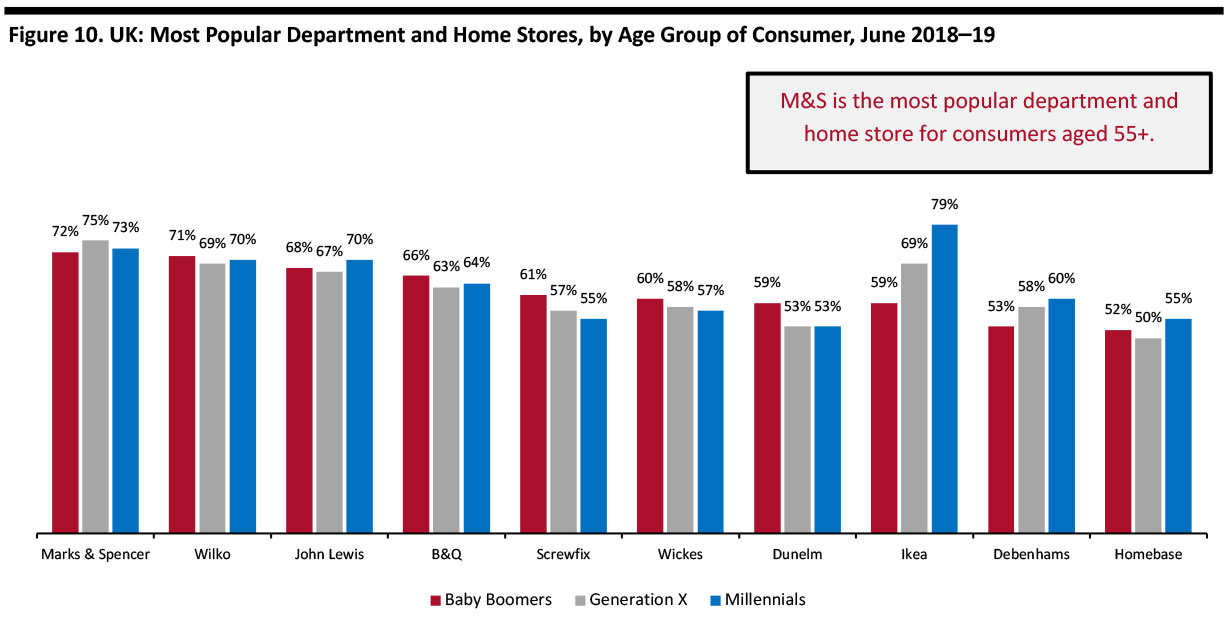 8,982 interviews conducted between June 2018 and June 2019.
Source: YouGov[/caption]