DIpil Das
The Coresight Research US Retail Traffic and In-Store Metrics series reviews changes in selected store-based metrics, as reported by RetailNext. In this month’s report, we review store traffic changes through September 2021—which saw an overall improvement in traffic, with trends impacted by the shift in Labor Day weekend, and which witnessed Covid-19 cases peak in the middle of the month. This series usually reviews year-over-year changes in store-based metrics; however, all March, April, May, June, July, August and September 2021 data in this report are compared to 2019 as stores began closing in March 2020 due to Covid-19 and most stores were closed in April, May, June, July, August and September 2020.
RetailNext’s coverage does not include food retailers but does include some other retail sectors deemed essential; the exclusion of food retail means that the figures cited below almost certainly overstate recent declines in total retail traffic.
Figure 1. US Store-Based Nonfood Retail Metrics: YoY % Change [caption id="attachment_134586" align="aligncenter" width="725"]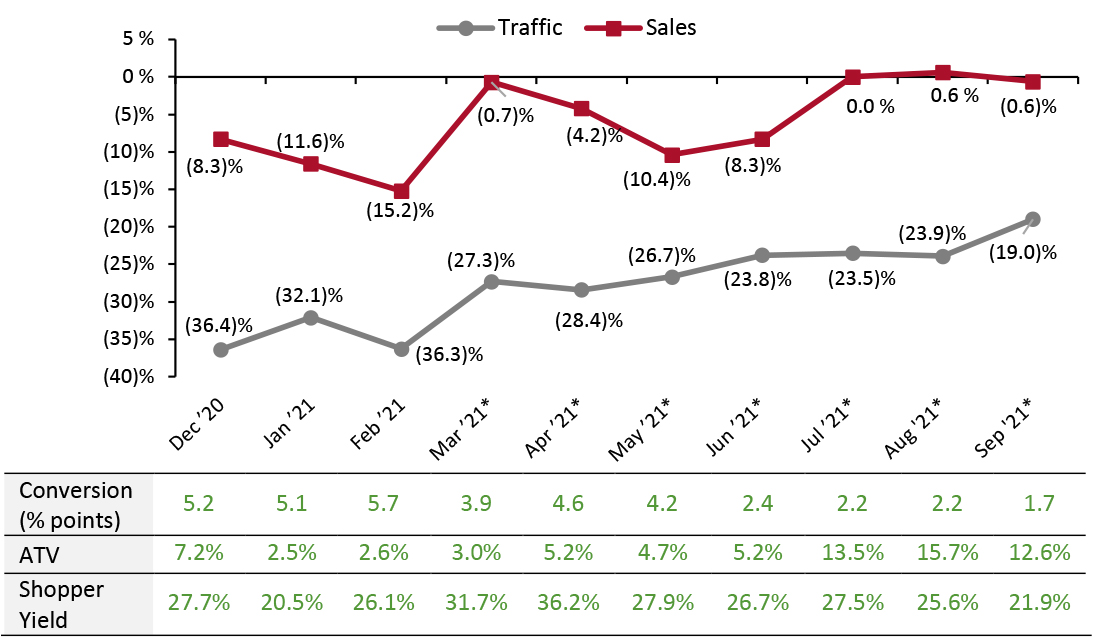 ATV=average transaction value; Shopper yield=Sales divided by traffic
*March, April, May, June, July, August, September 2021 numbers are compared to 2019 as stores began closing in March 2020 due to Covid-19 and most stores were closed in April, May, June, July, August and September 2020.
Source: RetailNext [/caption] Weekly Shopper Traffic Trends Weekly data for September tracks the progress of store traffic over five weeks (August 29–October 2, 2021):
Figure 2. US Retail Traffic by Industry Vertical: YoY % Change [caption id="attachment_135672" align="aligncenter" width="700"]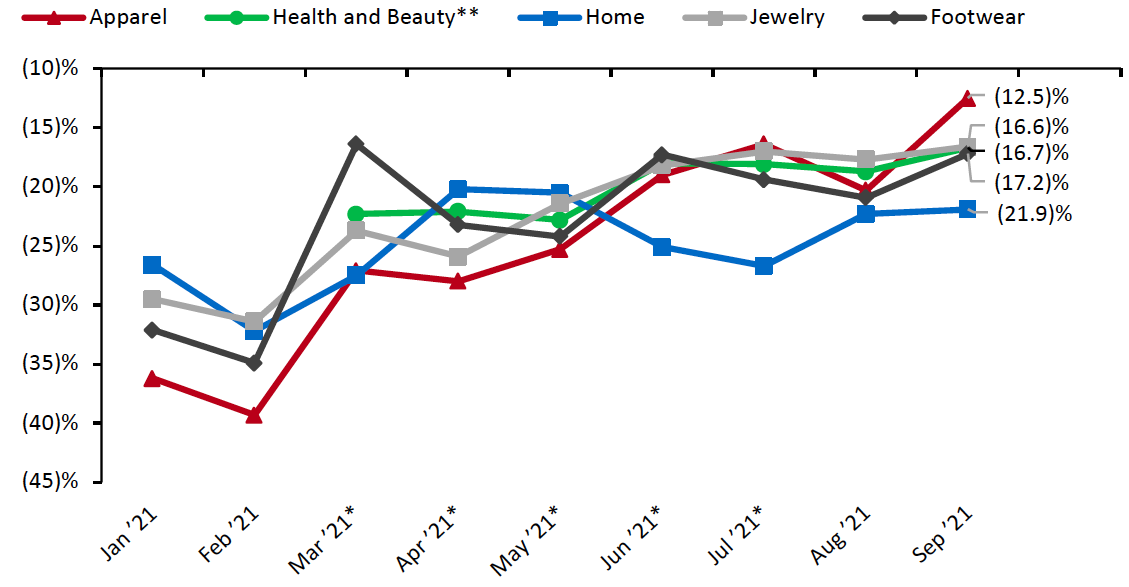 *March, April, May, June, July, August and September 2021 numbers are compared to 2019, as stores began closing in March 2020 due to Covid-19 and most stores were closed in April, May, June, July, August and September 2020.
**RetailNext started providing traffic trends for the health and beauty sector from March 2021.
Source: RetailNext [/caption] Regional Traffic Trends New Covid-19 cases peaked in the middle of September, a week after Labor Day, and declined towards the end of the month. September was affected by natural disasters as Hurricane Ida brought heavy rains to Northeastern states in the first week, causing severe flooding and breaking the record for the amount of rainfall in Manhattan—previously set by Tropical Storm Henri just 10 days before. The hurricane impacted traffic in the region. New Jersey, New York and Pennsylvania experienced the lowest traffic comps of (19.9)%, (31.9)% and (23.6)%, respectively. Additionally, in the fourth week, the state of California mandated proof of vaccination against Covid-19 or a negative test in order to attend indoor events hosting over 1,000 attendees, including sporting events and concerts. Cities such as San Francisco have enforced proof of vaccination requirements since the end of August for entry to bars, gyms and restaurants, and New York City requires proof of at least one dose of Covid-19 vaccine. However, many states, including Florida, Georgia and Texas do not require proof of vaccination. Retail traffic in September varied across regions:
- September saw an improvement in traffic trends: Traffic declined by 19.0% on a two-year basis in September, stronger than August’s 23.9% decline versus 2019.
- The conversion rate (sales transactions as a percentage of traffic) grew 1.7 percentage points in September, versus August’s growth of 2.2 percentage points. The easing of this metric since April reflects an incremental normalization of in-store shopping trends, including more leisure shopping and a deconsolidation of shopping trips.
- In September, ATV (average transaction value, or sales divided by transactions) increased by 12.6%, with the growth rate declining by 3.1 percentage points from August. This fueled a slight decline in store-based sales of 0.6%, decreasing from 0.6% in August.
- Shopper yield (sales divided by traffic) increased by 21.9% in September, lower than August’s 25.6% growth. Like the conversion rate, the general trend in this metric since April reflects a gradual return to more normal in-store shopping patterns.
Figure 1. US Store-Based Nonfood Retail Metrics: YoY % Change [caption id="attachment_134586" align="aligncenter" width="725"]
ATV=average transaction value; Shopper yield=Sales divided by traffic *March, April, May, June, July, August, September 2021 numbers are compared to 2019 as stores began closing in March 2020 due to Covid-19 and most stores were closed in April, May, June, July, August and September 2020.
Source: RetailNext [/caption] Weekly Shopper Traffic Trends Weekly data for September tracks the progress of store traffic over five weeks (August 29–October 2, 2021):
- On a week-by-week basis, traffic performance was mixed in September, recording the lowest performance in the first week on a two-year basis and the highest in the second—caused by the shift in Labor Day weekend from the first week to the second.
- In the first week, traffic declined by 26.8%, a slight deterioration from the final week of August, which saw a traffic decline of 26.4%. Traffic declines decelerated significantly to 12.9% in the second week of September but accelerated in the third week to 21.0%.
- Traffic declines decelerated to 17.3% in the fourth week but spiked to 20.3% in the fifth. In the fourth week, the Federal Drug Agency (FDA) approved a booster dose of Pfizer-BioNTech Covid-19 vaccine for those aged 65 years and over, and for adults who face more risk of severe illness or are engaged in an environment with Covid-19 exposure.
- The home sector reported the highest traffic decline of 21.9%, an improvement of 40 basis points compared to August.
- The footwear sector posted a traffic decline of 17.2%, a decrease of 370 basis points compared to August.
- The health and beauty sector saw a traffic decrease of 16.7%, a decrease of 200 basis points from August.
- The jewelry sector saw a traffic decline of 16.6%, a decrease of 110 basis points compared to August.
- The apparel sector posted a traffic decline of 12.5%, a decrease of 780 basis points compared to August.
Figure 2. US Retail Traffic by Industry Vertical: YoY % Change [caption id="attachment_135672" align="aligncenter" width="700"]
*March, April, May, June, July, August and September 2021 numbers are compared to 2019, as stores began closing in March 2020 due to Covid-19 and most stores were closed in April, May, June, July, August and September 2020. **RetailNext started providing traffic trends for the health and beauty sector from March 2021.
Source: RetailNext [/caption] Regional Traffic Trends New Covid-19 cases peaked in the middle of September, a week after Labor Day, and declined towards the end of the month. September was affected by natural disasters as Hurricane Ida brought heavy rains to Northeastern states in the first week, causing severe flooding and breaking the record for the amount of rainfall in Manhattan—previously set by Tropical Storm Henri just 10 days before. The hurricane impacted traffic in the region. New Jersey, New York and Pennsylvania experienced the lowest traffic comps of (19.9)%, (31.9)% and (23.6)%, respectively. Additionally, in the fourth week, the state of California mandated proof of vaccination against Covid-19 or a negative test in order to attend indoor events hosting over 1,000 attendees, including sporting events and concerts. Cities such as San Francisco have enforced proof of vaccination requirements since the end of August for entry to bars, gyms and restaurants, and New York City requires proof of at least one dose of Covid-19 vaccine. However, many states, including Florida, Georgia and Texas do not require proof of vaccination. Retail traffic in September varied across regions:
- The South posted the strongest traffic performance this month, recording a decline of only 16.5% when compared to 2019. It outperformed all regions throughout every week in the month.
- The Midwest was the second-best performing region in September, witnessing a traffic decline of 18.8%. The first week recorded the softest trend, while the second performed the strongest, as a result of the shift in the Labor Day weekend from the first week to the second.
- The West slightly underperformed the national average, declining only 19.3%, as several states including Oregon, Nevada and Washington require masks to be worn indoors, irrespective of vaccination status, while California has required indoor mask usage for unvaccinated people since the end of July.
- The softest traffic trend was recorded in the Northeast, which recorded declines of 20.1% and had lower traffic comps than any other region in the first week—caused by the impact of Hurricane Ida and also the shift of Labor Day weekend from the first week to the second.
- Traffic by mall location type declined between 7.1% and 27.2%. Strip malls outperformed all other location types, declining by 7.1%—while outlet locations performed the weakest this month, registering a 27.2% decline.
- Traditional malls were the second-highest performing location type, recording a traffic decline of 14.9%—an improvement from August’s 16.3% decline.
- Lifestyle centers outperformed half of all location types, declining by 16.8%.
- Street-front/freestanding locations slightly underperformed the national average with traffic decline of 19.3%, while luxury locations reported a traffic decline of 26.5%.
- Other retail locations, including airports, casinos and hotels, reported a traffic decline of 20.9%— an increase from August’s 17.0% decline.