
DIpil Das
US Retail Sales: September 2021
Coresight Research’s measure of core retail sales is the unadjusted year-over-year change, excluding gasoline and automobiles. This metric remained healthy at 11.1% in September—however, it is a slight deceleration from 12.3% (revised value) in August, as reported by the US Census Bureau on October 16, 2021. Declining infection rates of Covid-19 Delta cases, combined with the in-person back-to-school season and increasing numbers of workers heading back to the office likely supported retail sales growth in September. Home-improvement and garden retailers, nonstore retailers, and sporting goods and hobby stores led retail sales growth this month.Figure 1. US Total Retail Sales ex. Gasoline and Automobiles: YoY % Change [caption id="attachment_134547" align="aligncenter" width="700"]
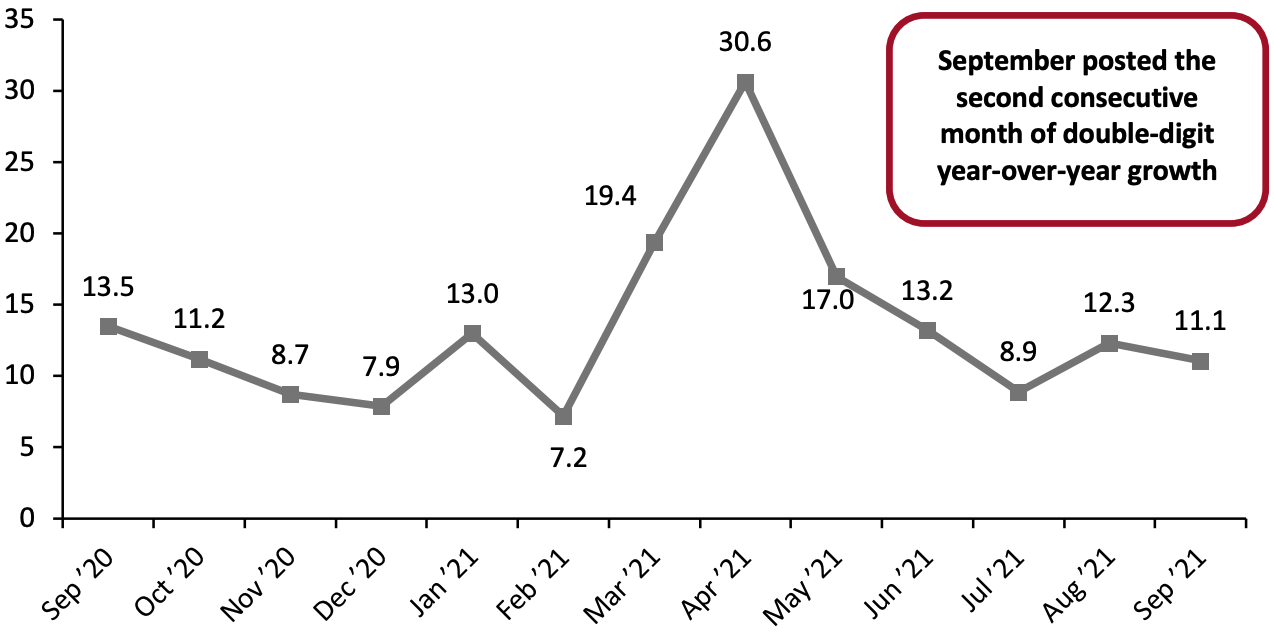 Data are not seasonally adjusted
Source: US Census Bureau/Coresight Research[/caption] In relation to the more consistent comparatives of 2019, September retail sales were stronger than August’s. Retail sales grew 25.8% from 2019 values in September, an increase of 5.9 percentage points from August. On a two-year basis, this was the second strongest growth in sales in the past year (see Figure 2).
Figure 2. US Total Retail Sales ex. Gasoline and Automobiles: % Change from Two Years Prior [caption id="attachment_136411" align="aligncenter" width="725"]
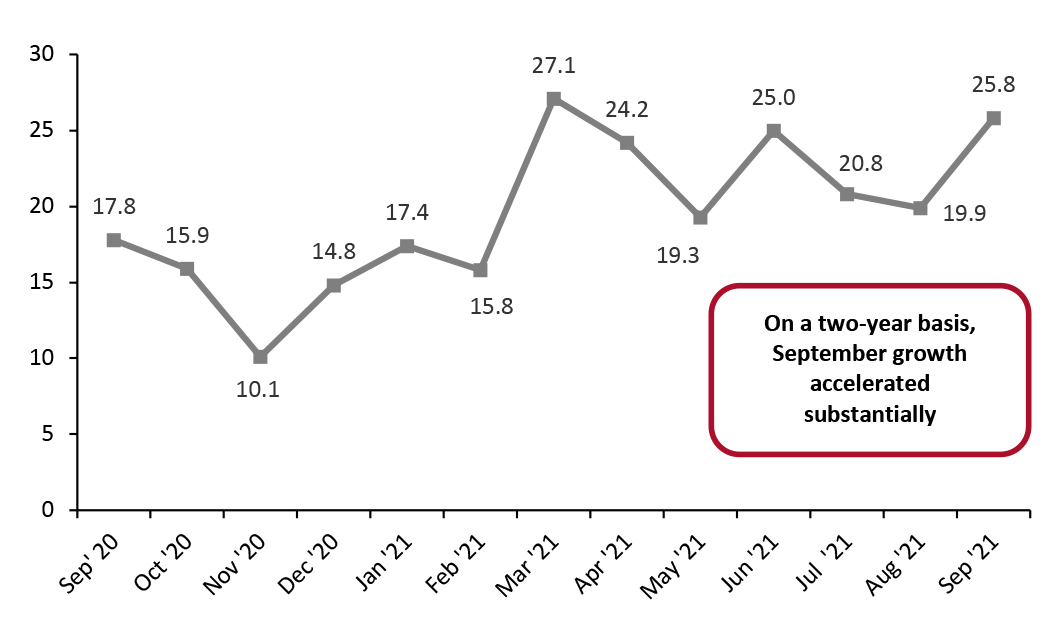 Source: US Census Bureau/Coresight Research[/caption]
Seasonally adjusted retail sales, including automobiles and gasoline, grew 12.2% year over year, a decline from August’s 13.5% revised growth. In September, sales of new motor vehicles continued to decline due to a global semiconductor scarcity.
Source: US Census Bureau/Coresight Research[/caption]
Seasonally adjusted retail sales, including automobiles and gasoline, grew 12.2% year over year, a decline from August’s 13.5% revised growth. In September, sales of new motor vehicles continued to decline due to a global semiconductor scarcity.
Figure 3. US Total Retail Sales incl. Gasoline and Automobiles: Seasonally Adjusted YoY % Change [caption id="attachment_134549" align="aligncenter" width="700"]
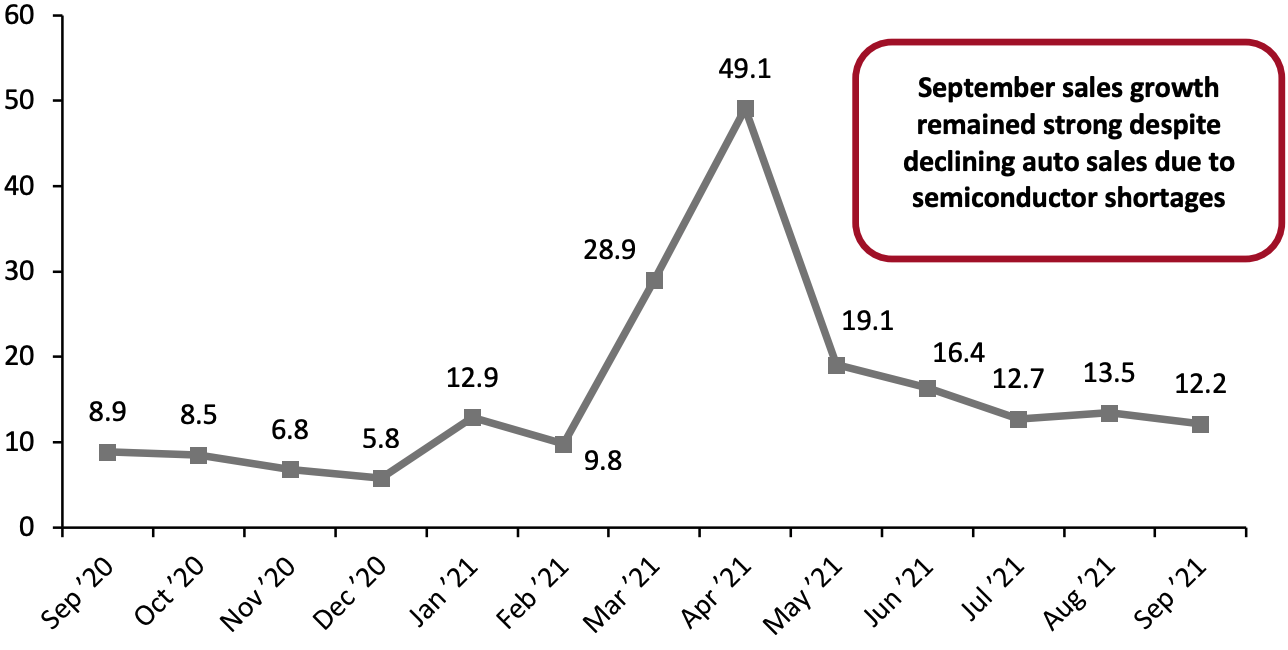 Data are seasonally adjusted
Source: US Census Bureau/Coresight Research[/caption] Sales Slightly Increase Month over Month On a month-over-month basis, seasonally adjusted sales (excluding automobiles and gas) increased by 0.8% in September—down from 2.4% in August, but still remaining positive. September’s strong retail sales continues the overall positive trend of high retail sales this year. However, economists remain doubtful that this trend will continue as we close out 2021, due to supply chain challenges, inventory shortages and increased spending on services as the US pulls further out of the pandemic.
Figure 4. US Total Retail Sales ex. Gasoline and Automobiles: MoM % Change [caption id="attachment_134550" align="aligncenter" width="700"]
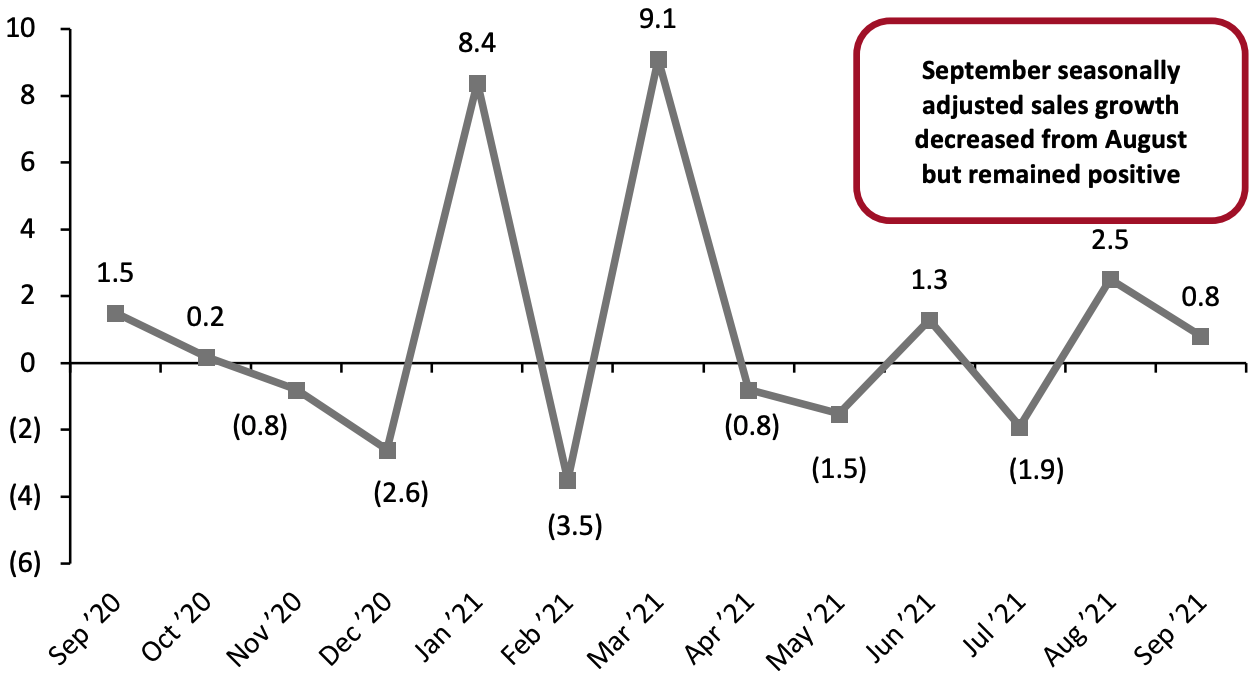 Data are seasonally adjusted
Source: US Census Bureau/Coresight Research[/caption] Retail Sales Growth by Sector Although overall retail sales saw double-digit sales growth from September 2020, the spread of Covid-19 through the US last spring hit some sectors much harder than others. To control for the effects of the pandemic in 2020’s retail sales figures, we largely compare September 2021 sales to pre-pandemic September 2019 sales in this section. In a very strong month, several sectors saw sales growth of roughly 15% or more from 2019 levels:
- Sporting goods and hobby store sales rose 28.9% from 2019 values. Compared to 2020 values, the sector saw growth of 13.0% year over year.
- Nonstore retailers continued to thrive in September, with sales growing 41.8% from 2019 values. This sector saw sales growth of 10.5% compared to 2020, when many states saw major spikes in Covid-19 cases, prompting them to pause or roll back reopening plans, which pushed sales online. Continued surges in this sector, even as stores across the country are now open without restrictions, suggest that there will not be a post-pandemic e-commerce retrenchment.
- Miscellaneous store retailers saw sales growth of 30.8% from 2019, accelerating strongly from August’s healthy 20.5% two-year growth.
- Home-improvement and garden retailers saw 30.0% two-year growth from September 2019, rising from August’s revised 23.5% increase.
- Furniture and home-furnishings stores—which did not perform nearly as well as home-improvement retailers amid the initial Covid-19 outbreak—continued their strong performance, recording growth of 24.5%in September 2021 on a two-year basis and accelerating from August’s 20.5% increase compared to 2019.
- General merchandise stores saw sales growth of 21.9% on a two-year basis. The department stores subsector saw continued robust recovery, posting strong sales growth of 14.5% compared to 2019.
- Food and beverage stores continued to see elevated sales, rising 20.0% from 2019 levels while year-over-year growth stood at 7.4%. Grocery stores saw 19.5% growth from 2019 and 7.9% growth from 2020. While the year-over-year increases are far lower than in most other categories, they represent a strong performance from the grocery industry following very demanding 2020 comparatives, which have caused major grocers to project low-single-digit sales declines in 2021.
- Clothing and clothing accessories stores saw solid sales growth of 17.7% from 2019 levels and 22.5% compared to 2020. This supports our expectation of strong recovery in the overall US apparel and footwear market in 2021.
- Electronics and appliance stores saw sales rise by 6.4% in September from 2019 values, decelerating from August’s 7.3%. Although consumers have spent substantially on electronics throughout the crisis, for much of 2020 they directed their spending away from specialty electronics retailers to online channels. While sales growth remains strong, we believe the sector has gradually begun to feel the tangible impacts of the growing scarcity of microchips (used in electronics and appliances)—which has already hit the auto industry—as two-year growth rates have slowed for three consecutive months.
Figure 5. US Total Retail Sales, by Sector: YoY % Change from 2020 (Top) and 2019 (Bottom) [wpdatatable id=1351 table_view=regular] [wpdatatable id=1352 table_view=regular]
Data are not seasonally adjusted Source: US Census Bureau/Coresight Research