
Nitheesh NH
US
| What’s New? | Trend Data | Positive or Negative* |
| Earnings vs. Inflation: In the US, seasonally adjusted inflation accelerated to 5.4% in September, up by 0.2% from August. Inflation remained high, mainly due to increases in the price of food, gasoline and home furnishings. Nominal wage growth slightly accelerated sequentially to 4.6% in September. In September 2021, average hourly earnings rose by $0.12 to $30.85, following an increase of $0.19 in August. Average weekly hours increased to 34.8 from a revised 34.6 August figure. Still, consumer price increases are outpacing average weekly earnings increases. In September, the seasonally adjusted unemployment rate fell below the 5.0% mark considered to be full employment by economists, to 4.8%. Improvements were seen in the business and professional services, leisure and hospitality, and retail sectors. Retail posted an addition of 56,000 jobs this month after posting losses for the last two months. Still, the retail sector remains 202,000 jobs lower than its February 2020 pre-pandemic level of employment. In the week ended October 16, 2021, approximately 290,000 Americans filed for unemployment benefits, around 6,000 less than the previous week’s revised level. |
Average Weekly Earnings vs. Consumer Prices: YoY % Change 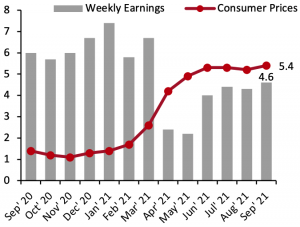 |
|
| Food and Fuel Prices: Food and gas price inflation rates are significant metrics because higher costs in these categories can impact discretionary spending. September saw US food inflation accelerate for the fifth consecutive month. Gasoline price inflation has fluctuated over the last three months but remains very high, caused by a rapid recovery in demand and a tightening of global crude supply by the Organization of the Petroleum Exporting Countries (OPEC). On August 11, the office of US President Joe Biden requested that OPEC and its allies boost crude oil production to mitigate rising gasoline prices. Separately, in July, OPEC and its allies agreed to boost crude oil production by 400,000 barrels per day (bpd), starting in August, until bpd reaches pre-pandemic levels—the oil producers are currently supplying 5.8 million bpd fewer than before the crisis. On September 1, OPEC held a meeting with its allies to reaffirm the 400,000 bpd supply boost. |
Consumer Prices for Food at Home and Gasoline: YoY % Change 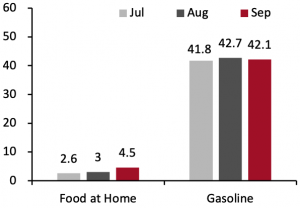 |
|
| Retail Sales: Total US retail sales, excluding gasoline and automobiles, grew by a strong 11.1% year over year and by 25.8% when compared to 2019 values. Many sectors saw strong sales growth in September 2021 compared to pre-pandemic September 2019: Sales increased by 41.8% at nonstore retailers, by 30.8% at miscellaneous store retailers, by 28.9% at sporting goods and hobby stores, by 24.5% at furniture stores, by 21.9% at general merchandise stores and by 17.7% at clothing and clothing accessory retailers. US department store sales are recovering, posting a strong 14.5% two-year growth in September. |
Total Retail Sales ex. Automobiles and Gasoline: YoY % Change 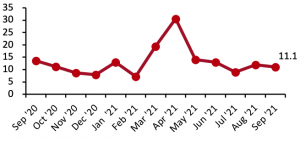
|
UK
| What’s New? | Trend Data | Positive or Negative* |
| Earnings vs. Inflation: In the UK, inflation remained in line with recent trends. Consumer prices grew 2.9% in September, slightly down from August’s 3.0% increase. Average earnings growth decelerated for the third consecutive month in August to 5.6% (latest data), from 7.2% year-over-year growth in July. In September 2021, the number of payroll employees increased by 1,008,000 or 3.6% year over year. Median monthly pay increased by 5.2% compared to September 2020. Month over month, August saw the number of payroll employees rise by 207,000 or 0.7%, from August. Currently, the number of payroll employees stands at a record 29.2 million, surpassing pre-pandemic values. The largest job growth in September was in the administrative and support services sector, while the transportation sector saw the largest number of job losses. At the end of the third quarter of 2021, retail vacancies were 5,000 higher than they were during their pre-pandemic value. |
Average Weekly Earnings vs. Consumer Prices: YoY % Change [caption id="attachment_134959" align="aligncenter" width="300"]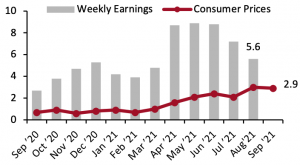 Latest earnings data are for July Latest earnings data are for JulySource: ONS[/caption] |
|
| Food and Fuel Prices: Higher costs for food and automotive fuel can impact discretionary spending. In September, UK food prices increased year over year for the second consecutive month—although the increase was just 0.8%. Automotive fuel price inflation remained relatively flat from August to September, increasing by just 0.1% month over month. Fuel prices remain high due to pent up demand. |
Consumer Prices for Food at Home and Automotive Fuel: YoY % Change 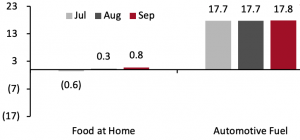 |
|
| Retail Sales: Total UK retail sales growth continued its downward trend, slowing all the way to a halt in September year over year. However, on a two-year basis (versus pre-pandemic 2019), retail sales remained in line with recent trends. September retail sales grew 5.7% on a two-year basis—a slight acceleration from August’s 5.4% two-year growth and in line with July’s 5.7% growth compared to 2019 values. Clothing specialists’ sales increased by 12.1% year over year in September 2021. Compared to 2019, specialists’ sales remain down by 4.6%. On a two-year basis, sales at department stores—which have been severely challenged during the pandemic—decreased by 2.9% in September, an improvement compared to August’s 5.3% two-year decline. Health and beauty sales were up 18.3% in September 2021 compared to two years prior, accelerating substantially from August’s 6.6% two-year growth. Online sales accounted for 25.9% of all retail sales in September. Despite accounting for a quarter of all retail sales, online sales growth stayed negative, declining by 2.9% year over year. |
Total Retail Sales ex. Automobiles and Automotive Fuel: YoY % Change [caption id="attachment_134979" align="aligncenter" width="300"]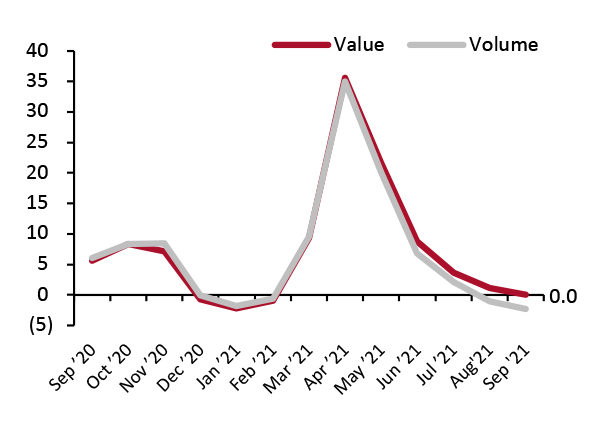 Data are not seasonally adjusted[/caption] Data are not seasonally adjusted[/caption] |
|
China
| What’s New? | Trend Data | Positive or Negative* |
| Income vs. Inflation: In China, the consumer price index grew 0.7% in September, slightly down from August’s 0.8% growth. Data on per capita disposable income are released quarterly. In the third quarter of 2021, per capita disposable income grew 10.4% year over year—down slightly from 12.6% growth in the second quarter, but still remains healthy, as the economy continues to recover steadily. |
Per Capita Disposable Income vs. Consumer Prices: YoY % Change [caption id="attachment_134980" align="aligncenter" width="301"]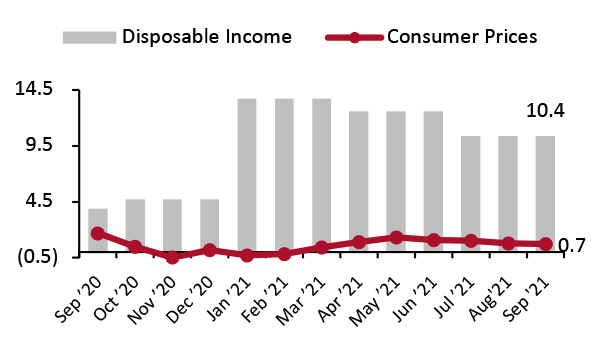 Disposable income data are quarterly[/caption] Disposable income data are quarterly[/caption] |
|
| Food and Fuel Prices: Higher costs for food and automotive fuel can impact discretionary spending. In September, food prices in China decreased for the fourth consecutive month. Food prices declined 5.2% in September. Beijing’s fuel price inflation remained unchanged month over month, standing high at 24.1%. |
Consumer Prices for Food at Home and Automotive Fuel: YoY % Change 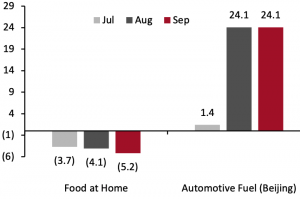 |
|
| Retail Sales: Retail sales growth in China picked from a slow August. September saw retail sales increase 4.5% year over year and 7.4% on a two-year basis. Apparel and footwear sales continued to decline year over year, recording a decrease of 4.8%. On a two-year basis, the sector’s sales saw slight positive growth of 0.4%. This sector is likely impacted by China’s strict Covid-19 restrictions aiming to contain local outbreaks. Beauty retailers grew 3.9% year over year, after a flat August. On a two-year basis, beauty sales were up 24.3%. Communication equipment had the strongest month of any sector as sales growth increased by 22.8% year over year and 20.4% on a two-year basis. Food retailers saw continued steady growth, despite slight declines from August. Food sales grew 9.2% year over year and 12.3% compared to the same period in 2019. |
Total Retail Sales incl. Automobiles and Gasoline: YoY % Change [caption id="attachment_134981" align="aligncenter" width="300"] Data for January and February 2021 are aggregated[/caption] Data for January and February 2021 are aggregated[/caption] |