albert Chan
What’s the Story?
In our Leading Indicators of US Retail Sales monthly series, we examine several key macroeconomic indicators of US retail sales and analyze how they may impact the industry in the months to come. We analyze the latest available data, as of the end of September 2021, from sources such as the US Census Bureau, the US Bureau of Economic Analysts (BEA), the US Bureau of Labor Statistics (BLS) and the US Department of Housing and Urban Development (HUD).
Why It Matters
Macroeconomic indicators have a significant impact on overall retail sales growth. Looking at 10 indicators (unemployment rate, labor force participation rate, disposable income per capita, average hourly wages, consumer sentiment, saving rate, gas price, federal funds rate, housing starts and housing prices), we can historically account for a majority of the variation in retail sales growth and create a strong basis for predicting sales moving forward.
The close correlation between retail sales growth predictions based on economic indicators and actual retail sales growth is shown in Figure 1.
Figure 1. US Actual Retail Sales ex. Auto and Gas Sales vs. Model Predicted Sales, January 2000–January 2021 (YoY % Change)
[caption id="attachment_134391" align="aligncenter" width="700"]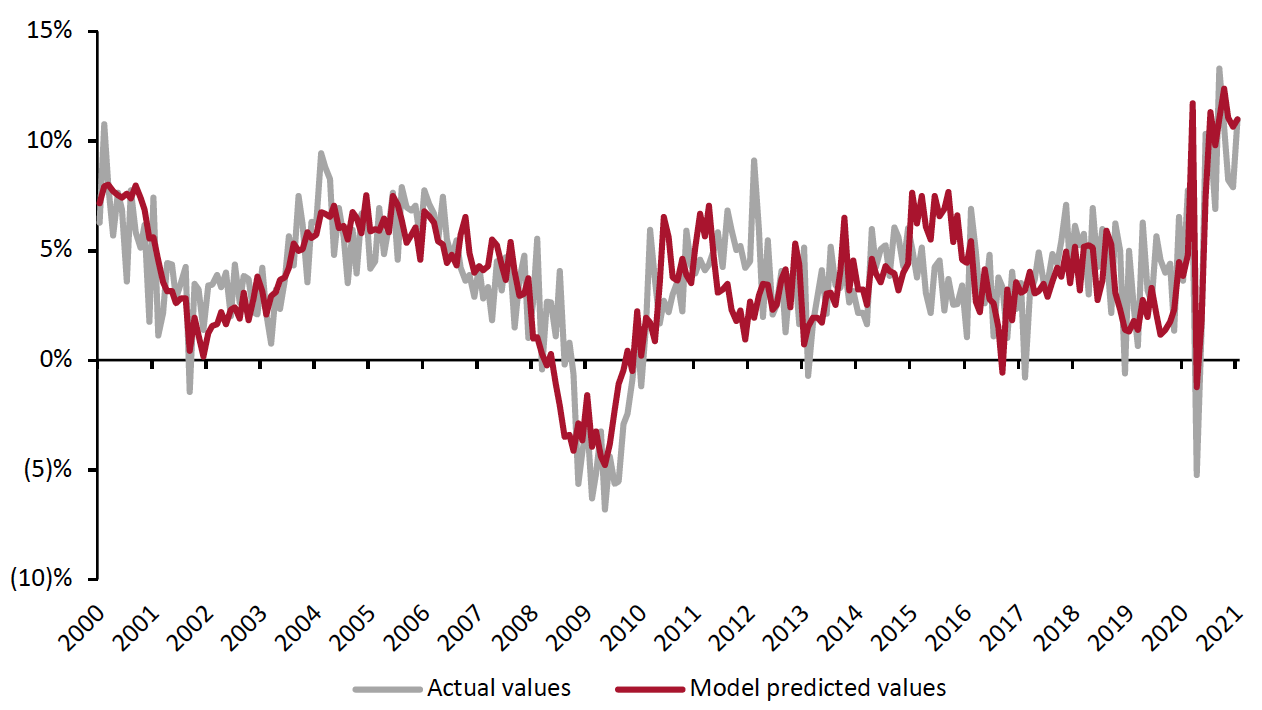 Source: BEA/BLS/Federal Reserve Board of Governors/S&P/Coresight Research[/caption]
In August, retail sales growth accelerated from July, increasing by 12.0% year over year, from 8.9% in July, as reported by the US Census Bureau. August posted healthy retail sales levels in line with the second half of 2020, against tough year-over-year comparatives. Our model predicts a year-over-year increase of around 11% in retail sales during September as we complete the back-to-school season and look ahead to the holiday season.
Leading Indicators of US Retail Sales: In Detail
Indicators Overview
Of the 10 indicators we examined, six are likely to have a positive impact on retail sales in the coming months. In August, the unemployment rate continued to improve while the labor force participation rate stayed flat. Disposable income and wages increased, month over month. Consumer sentiment took a steep decline in August. Gas and housing prices continued to rise.
Figure 2. US: Leading Indicators of Retail Sales, as of the End of September 2021 [caption id="attachment_134392" align="aligncenter" width="700"]
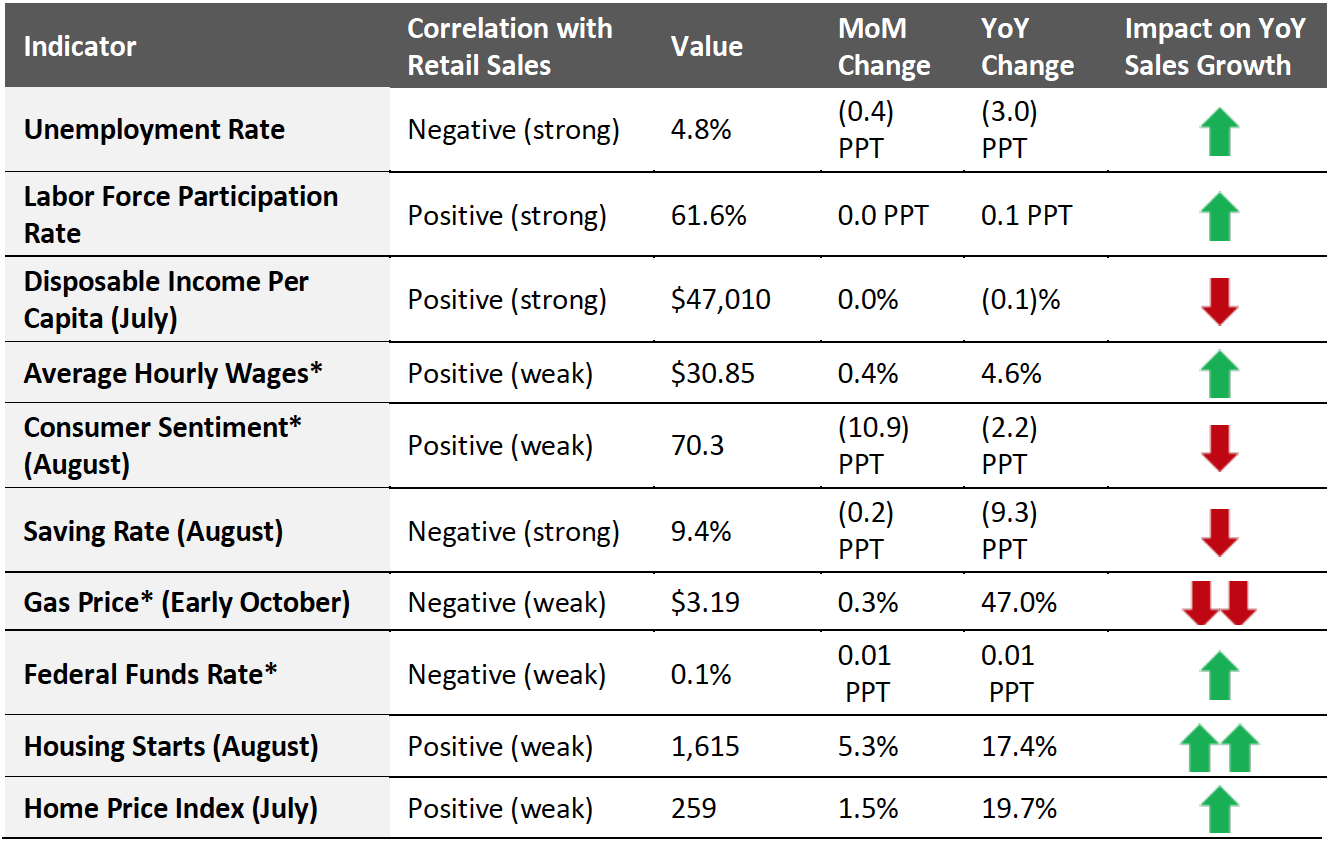 Latest available data from September unless otherwise indicated
*Not included in predictive model
Source: BEA/BLS/Federal Reserve Board of Governors/S&P/University of Michigan/US Energy Information Administration/Coresight Research[/caption]
Looking ahead to soon-to-be-reported September retail sales (at the time of publication), we expect retail sales growth to slow to 11.1% year over year, as illustrated in Figure 3. This is around one-third of the growth experienced in April 2021 and is in line with growth trends in the second half of 2020.
Figure 3. US Retail Sales ex. Auto and Gas (YoY % Change)
[caption id="attachment_134393" align="aligncenter" width="700"]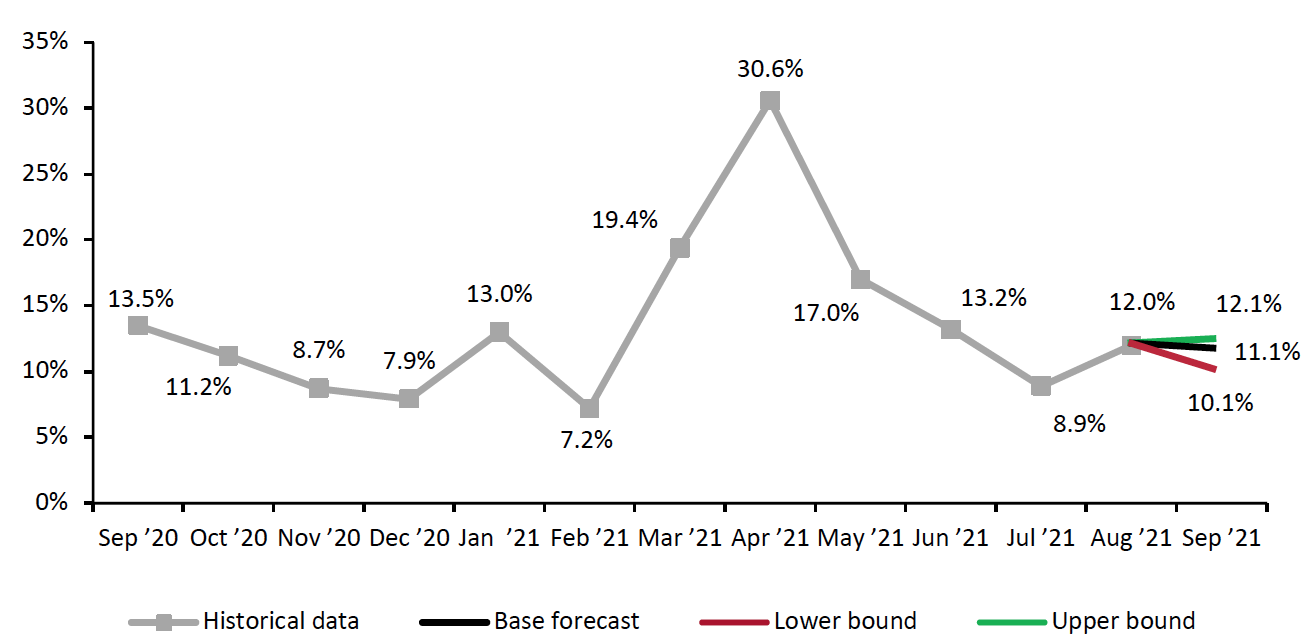 Source: US Census Bureau/Coresight Research[/caption]
The Job Market
The narrative around the job market is one of continued slow growth amid a tight labor market. The US added only 194,000 workers in non-farm payrolls in September, far below the 500,000 expected by economists. Job growth was led by the leisure and hospitality, business and professional services, and retail sectors. The retail sector recorded an addition of 56,000 jobs after posting losses for the last two months. Still, retail employment remains 202,000 jobs lower than its February 2020 pre-pandemic level. The tight labor market will pose challenges for retailers as we enter the holiday season. Target has already announced that it will hire fewer seasonal workers this year and will instead ask its current employees to cover an additional 5 million hours. Other retailers are expected to follow suit. This will likely result in reduced store hours this holiday season as well as longer checkout lines.
In September, the labor force participation rate declined by 0.1% to 61.6%. The slight downtick in labor force participation is notable because it came after the expiry of federal pandemic unemployment benefits in September; we expected to see an increase in the labor force participation rate, but the opposite occurred. Potential workers may be cautious about joining the labor force when cases of Covid-19 and the Delta variant are still widespread.
Figure 4. US Unemployment Rate (Left Axis, %) and Labor Force Participation Rate (Right Axis, %)
[caption id="attachment_134394" align="aligncenter" width="700"]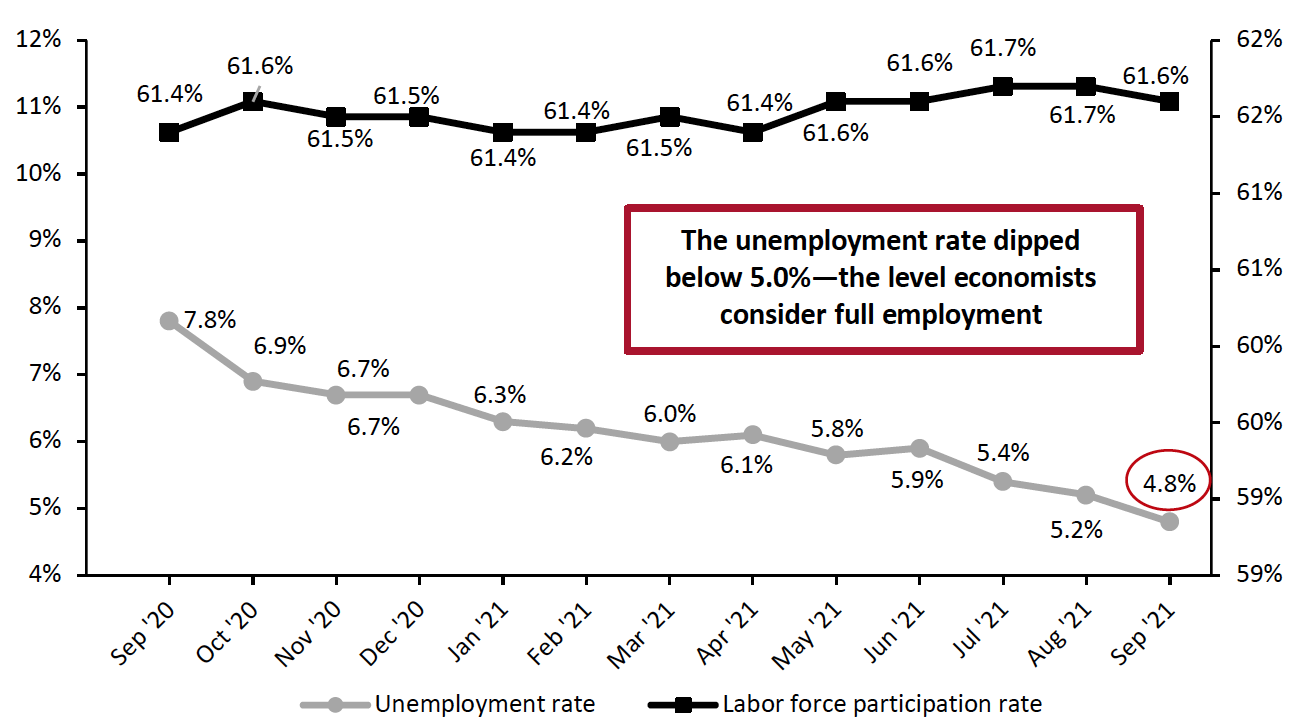 Source: BLS[/caption]
The average private sector hourly wage continued to climb in September, setting a new record for the sixth consecutive month: $30.85 per hour. However, these hourly wage increases have yet to draw a substantial number of workers back into the workforce.
Figure 5. US Average Hourly Wages, All Private-Sector Employees (USD)
[caption id="attachment_134395" align="aligncenter" width="700"]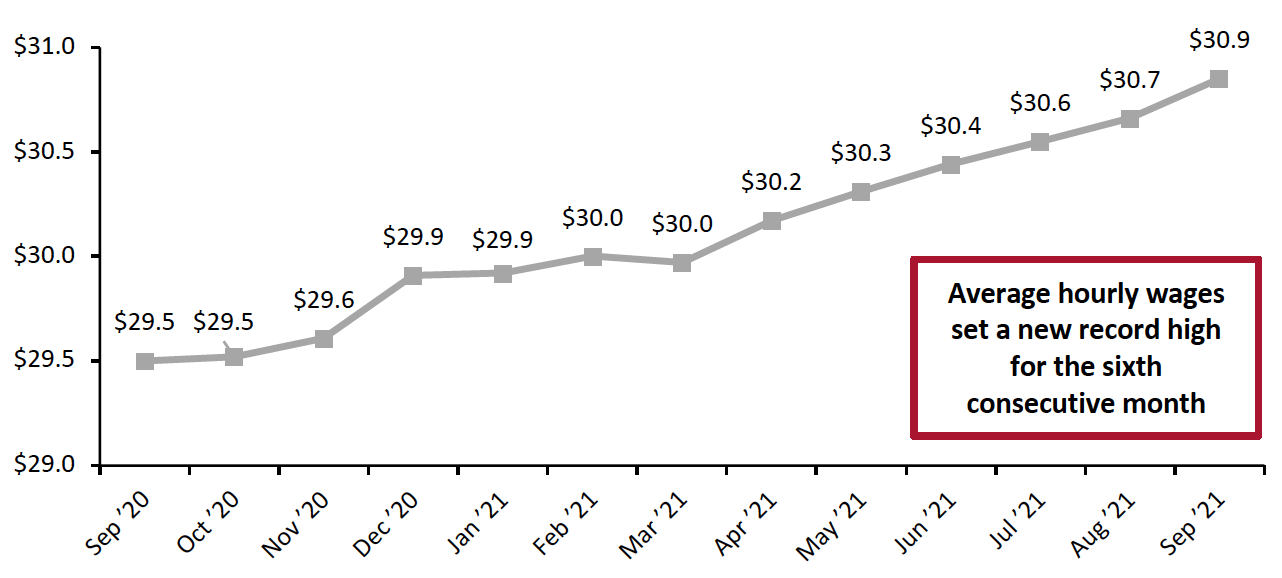 Source: BLS[/caption]
Implications
The shortage of available workers means retailers will have to navigate a complex holiday season this year. It is likely that we will see reduced store opening hours this holiday season, with fewer stores remaining open late as in previous holiday seasons. Reduced seasonal workers may also mean longer checkout lines, emptier shelves and a worse in-store experience. We expect the labor shortage to contribute to sustained e-commerce growth, as many consumers may turn to online shopping this holiday season.
Despite lower new infection rates in recent weeks, Covid-19 and the Delta variant remain a threat to the labor supply, as evinced by the downtick in labor force participation this month. The shortage of available workers poses challenges not only for in-store retail operations but also in transportation and warehousing. We could also see long shipping delays this holiday season.
Income, Savings and Sentiment
Real disposable income per capita has fallen substantially since the stimulus-driven spike in March. Despite a slight uptick in July, due to the beginning of Child Tax Credit payments, real disposable income per capita fell slightly in August (latest available data) to $47,010.
Figure 6. US Annualized Real Disposable Income Per Capita (USD)
[caption id="attachment_134396" align="aligncenter" width="700"]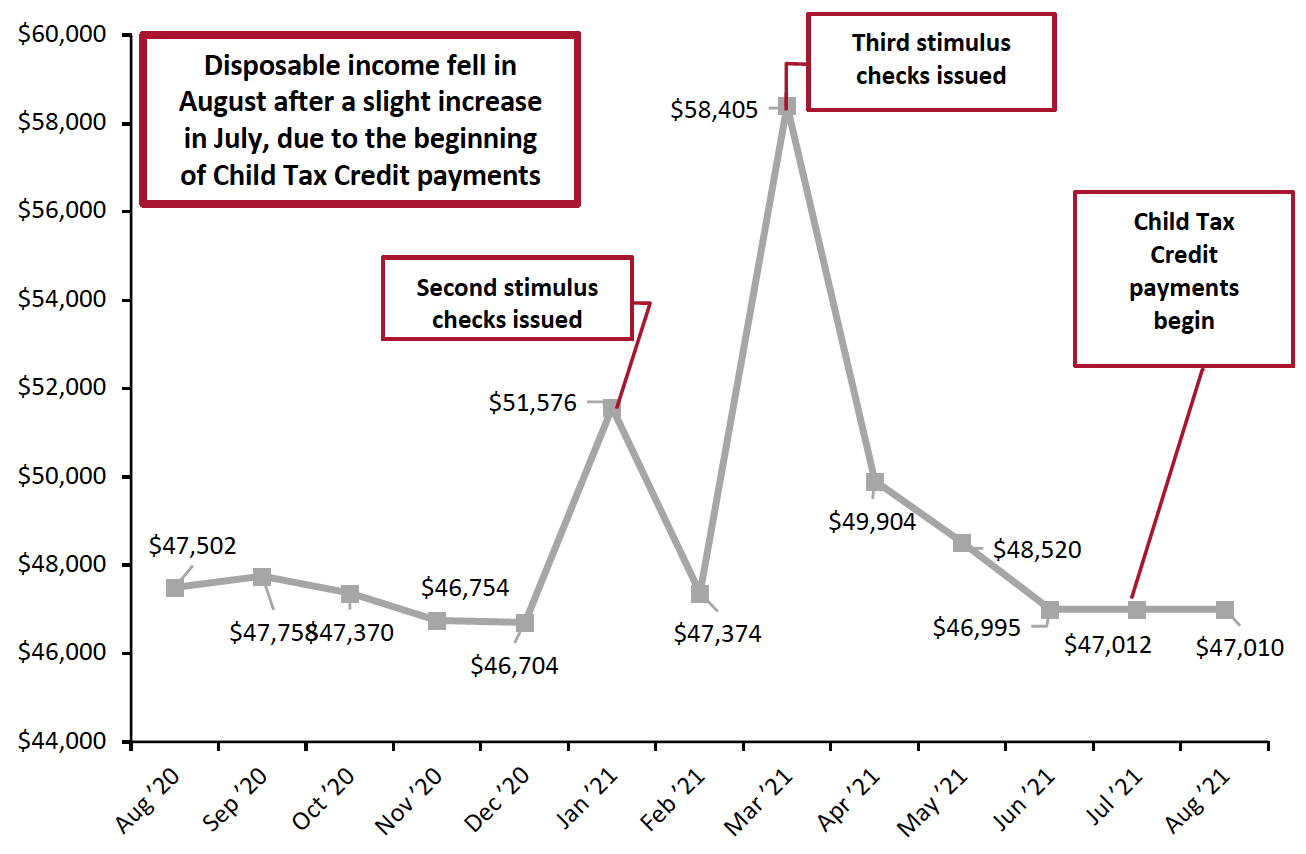 Source: BEA[/caption]
The personal saving rate has declined substantially since the third round of stimulus checks in March. July saw a small uptick, likely due to the beginning of Child Tax Credit payments. In August (latest available data) the personal saving rate fell back to its June level. It is likely that the personal saving rate will continue to fall after the elimination of supplemental unemployment benefits in September. Lower saving rates will push consumers to cut back discretionary spending.
Figure 7. Personal Saving Rate (%)
[caption id="attachment_134397" align="aligncenter" width="700"]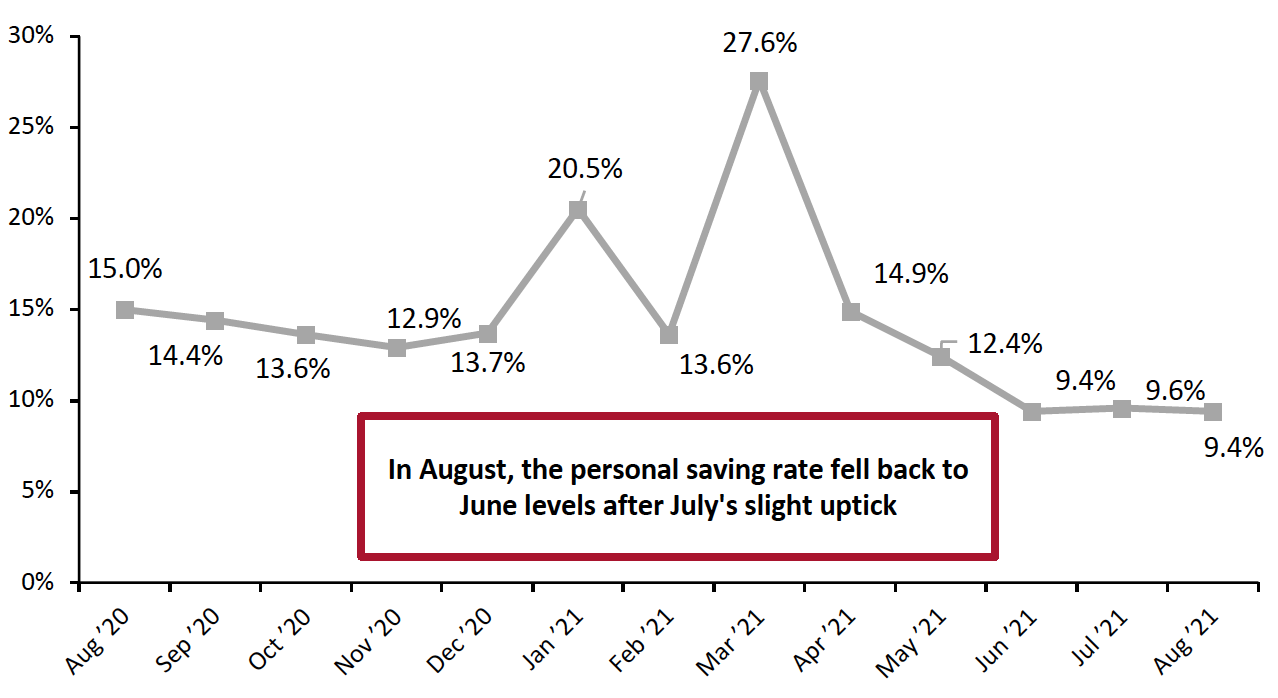 Source: BEA[/caption]
Consumer confidence fell by 10.9% in August, to 70.3. Consumers are concerned about higher inflation, smaller declines in unemployment, and the elimination of government assistance such as supplemental unemployment benefits and renter’s insurance.
Source: BEA[/caption]
Consumer confidence fell by 10.9% in August, to 70.3. Consumers are concerned about higher inflation, smaller declines in unemployment, and the elimination of government assistance such as supplemental unemployment benefits and renter’s insurance.
Figure 8. University of Michigan Consumer Sentiment Index [caption id="attachment_134398" align="aligncenter" width="700"]
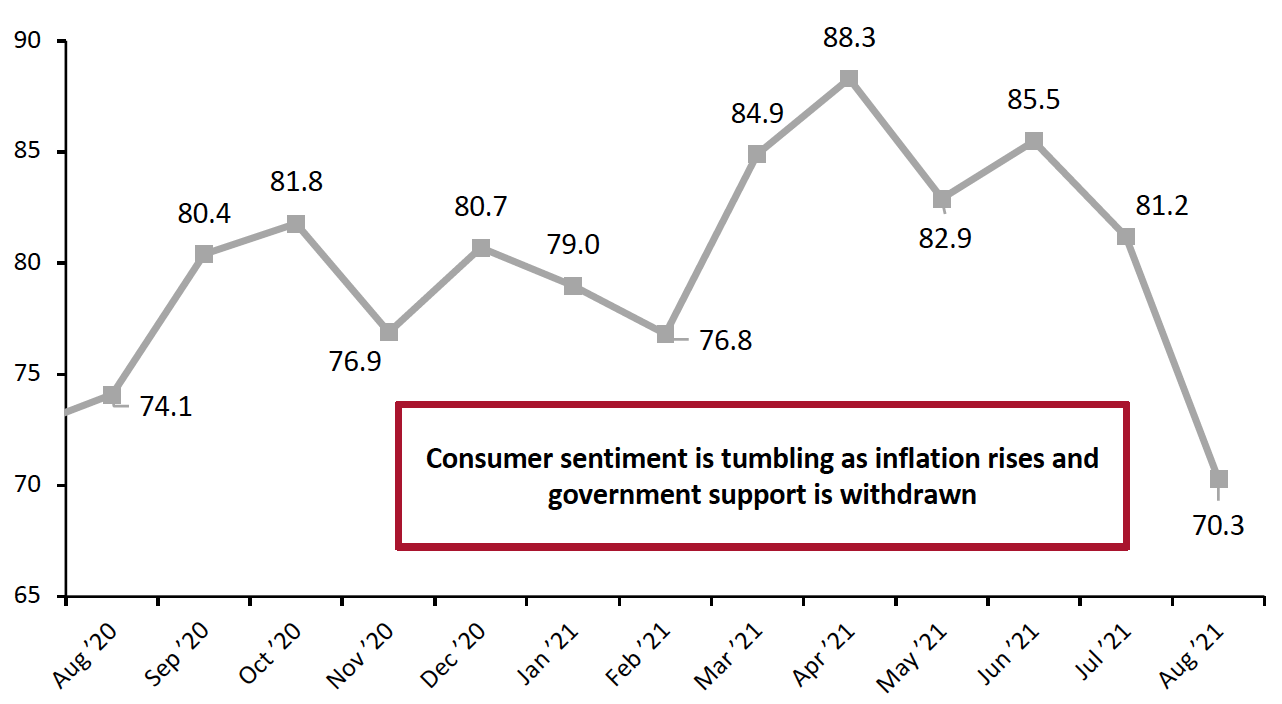 Source: University of Michigan[/caption]
Gas prices continue to rise dramatically, contributing to inflation concerns. Gas prices have now risen for nine consecutive months, reaching $3.18 in early September—up 43.7% year over year.
Rising gas prices have an outsize impact at this point, as consumers increasingly venture outside their homes during the back-to-school season and many are still avoiding public transport due to Covid-19 concerns.
Figure 9. US Regular All Formulations Gas Price (Dollars per Gallon)
[caption id="attachment_134399" align="aligncenter" width="700"]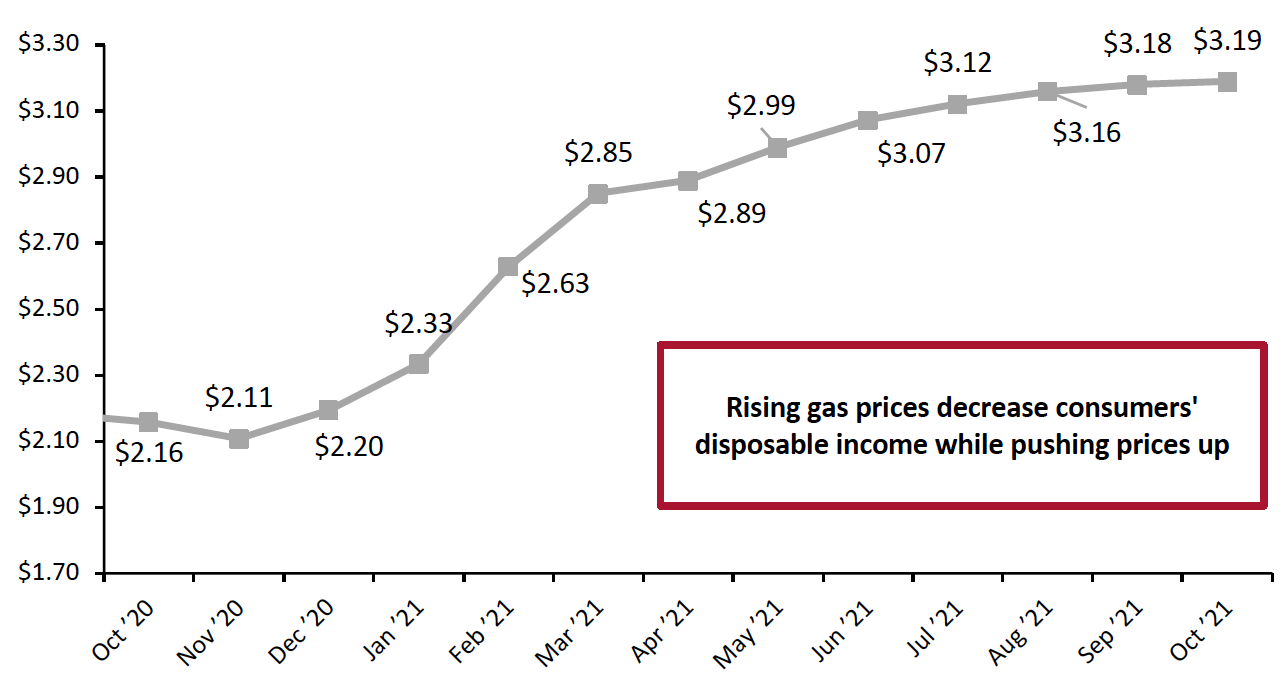 Source: US Energy Information Administration[/caption]
Implications
Higher gasoline prices have a multiplier effect throughout the entire economy, impacting the price of goods as well as personal travel. Increased gas prices are likely contributing to consumer expectations of higher inflation, as the cost of filling up their gas tanks increases. They also reduce consumer disposable income, hitting lower-income consumers harder—as many need to drive to work and the cost of fuel now consumes a greater proportion of their income.
Housing
Housing starts picked up in August, increasing 5.3% month over month after a slow July, and by 17.4% year over year. There were 1.6 million new housing starts in August.
Home prices continued to climb in July (the latest month for which Case-Shiller Index data is available), reaching 263.3 points, up from 259.3 in June. Rising home prices can create a wealth effect, making consumers feel more affluent and emboldening them to spend.
Figure 10. Housing Starts (Thousands, Left Axis) and Case-Shiller US Home Price Index (Right Axis)
[caption id="attachment_134400" align="aligncenter" width="700"]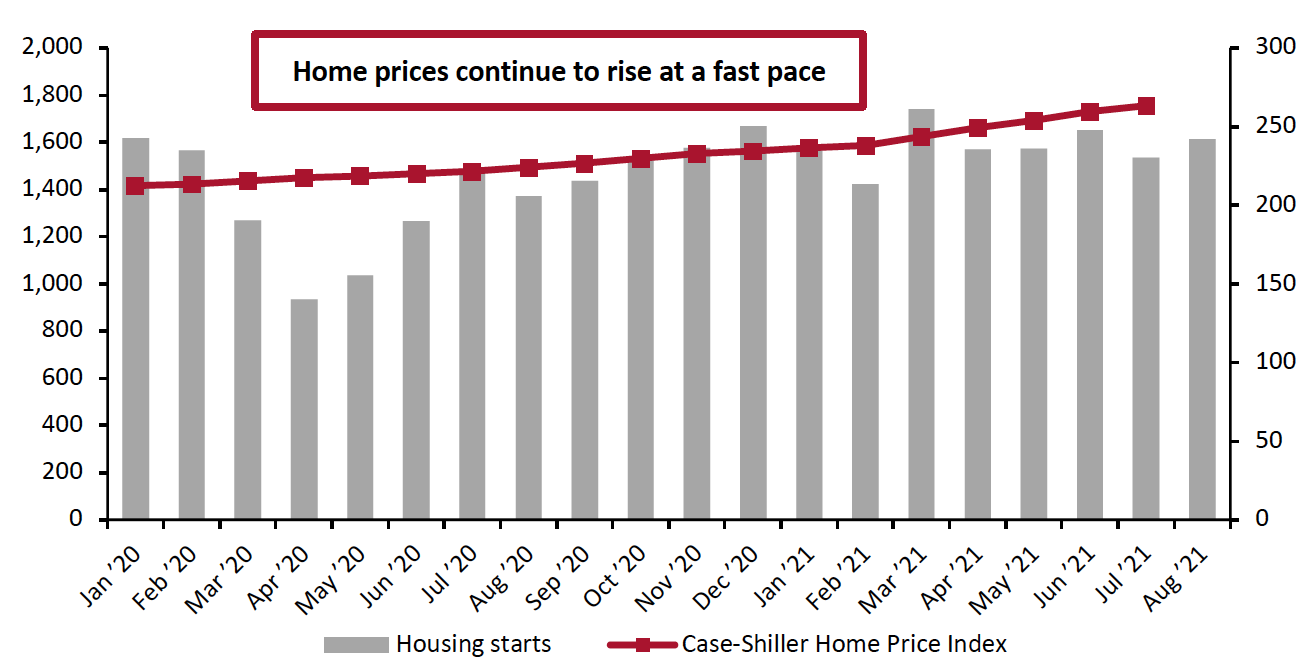 Source: HUD/US Census Bureau[/caption]
While the rise in housing prices causes some homeowning consumers to feel more affluent, it also means many prospective homebuyers are forced to rent rather than buy—which could dampen housing starts in the future.
Implications
In the past three reports in this series, we have commented on the meteoric rise in home prices, which is hindering the ability of consumers to buy homes, making the rental market tight. However, rising home prices are likely to lure more developers into entering the housing market.
What We Think
Despite reduced consumer confidence and a tight labor market, the overall trends in retail sales remain healthy. We expect to see retail sales growth in September to have been in the 10.1%–12.1% range (the Census Bureau reports this metric on October 14).
Implications for Brands/Retailers
- The Delta variant continues to pose a significant challenge to the labor supply: workers left the workforce this month despite an already tight labor market. Retailers will struggle to recruit enough staff over the holiday season, which we expect to result in reduced store hours.
- Consumer sentiment is taking a downturn, due the spread of the Covid-19 Delta variant, higher consumer inflation expectations, weak job growth and the suspension of government programs.