DIpil Das
The Coresight Research US Retail Traffic and In-Store Metrics report reviews year-over-year changes in selected store-based metrics as reported by RetailNext. In this month’s report, we review store traffic changes through September, when nonessential businesses continued to reopen and many states revisited their reopening plans for indoor malls as the number of new coronavirus cases reduced from August. RetailNext’s coverage does not include food retailers but does include some other retail sectors deemed essential; the exclusion of food retail means that the figures cited below almost certainly overstate recent declines in total retail traffic.
- Total US nonfood traffic declined by 34.1% year over year in September versus August’s 40.8% decline, reflecting further recovery for store-based discretionary retail.
- The conversion rate (sales transactions as a percentage of traffic) grew by 2.7 percentage points in September versus August’s 4.2-percentage-point growth.
- In September, ATV (sales divided by transactions) increased by 5.2%, up from August’s 4.4% growth.
- Shopper yield (sales divided by traffic) grew 20.0% in September versus August’s 28.0% increase.
- RetailNext did not publish data for transaction volume and product return rates.
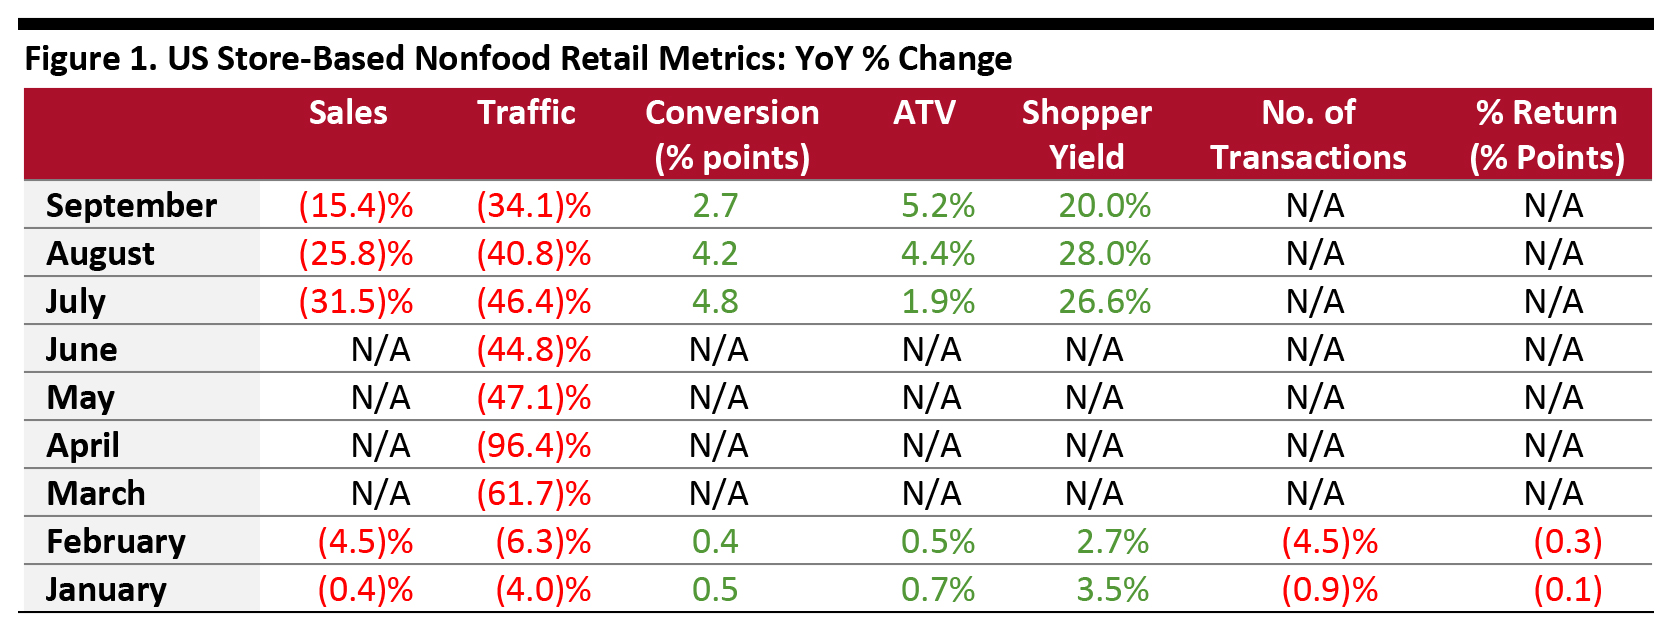 ATV=average transaction value; % Return=percentage of goods returned to stores
 Source: RetailNext [/caption] Weekly Shopper Traffic Trends Weekly data for September tracks the progress of store reopenings over five weeks (August 30–October 3, 2020):
- Traffic declined by 39.8% in the first week, partly impacted by the shifts in holiday dates and Labor Day weekend being a week later this year; however, it still showed an improvement from the final week of August, which saw traffic decline by 40.2%. Traffic declines eased to 32.0% in the second week of September.
- Declines accelerated slightly to 33.2% in the third week of September before easing again to 31.2% in the fourth week. In the fifth week, traffic declines slightly accelerated to 34.0% as some states began to see a rise in Covid-19 cases—although declines remained at an improved level compared to the first week of the month.
- The apparel sector experienced the greatest traffic decline at 36.1%, followed by the jewelry sector, which saw a 35.0% decrease in traffic.
- The home sector posted the lowest decline in traffic, at 20.3%.
- The footwear sector reported a traffic decline of 20.4%.
- The Northeast saw the greatest traffic decline of 35.5%, as many states were slower to reopen and some states witnessed a rise in Covid-19 cases. The region’s traffic performed slightly better in the second and third week of September, with New York City reopening indoor malls at the beginning of the month and New York Fashion Week taking place during the second and third weeks of the month. New York City also reopened indoor dining at the end of September.
- The Midwest posted the lowest decline in traffic, at 28.5%, as this region had limited closures owing to a low number Covid-19 cases. This region outperformed other regions every week in September except the first. However, this trend is expected to slow in the coming months as coronavirus cases started to rise throughout the region at the end of the month.
- The South was the second-best performing region, posting a traffic decline of 30.1%. However, the third week of the month saw a major decline in traffic due to the impacts of Hurricane Sally.
- The West posted a traffic decline of 35.1%. Compared to August, the number of Covid-19 cases reduced in September. Many states, such as California and Washington, revisited reopening plans for indoor malls during the month. However, the region saw the largest declines in traffic in the second and third weeks of September due to the impacts of heatwaves and major wildfires in the Pacific Northwest area, which caused people to stay indoors to avoid poor air quality.
- Traffic by mall location type declined between 21% and 50%, with strip malls outperforming other location types by more than 15 percentage points, with a decline of only 21.3%; these benefitted from being open-air centers and the presence of nondiscretionary retailers such as food retailers.
- Luxury, outlet, lifestyle centers, street front and traditional mall locations witnessed traffic declines of between 37% and 39%.