DIpil Das
[caption id="attachment_97963" align="aligncenter" width="700"]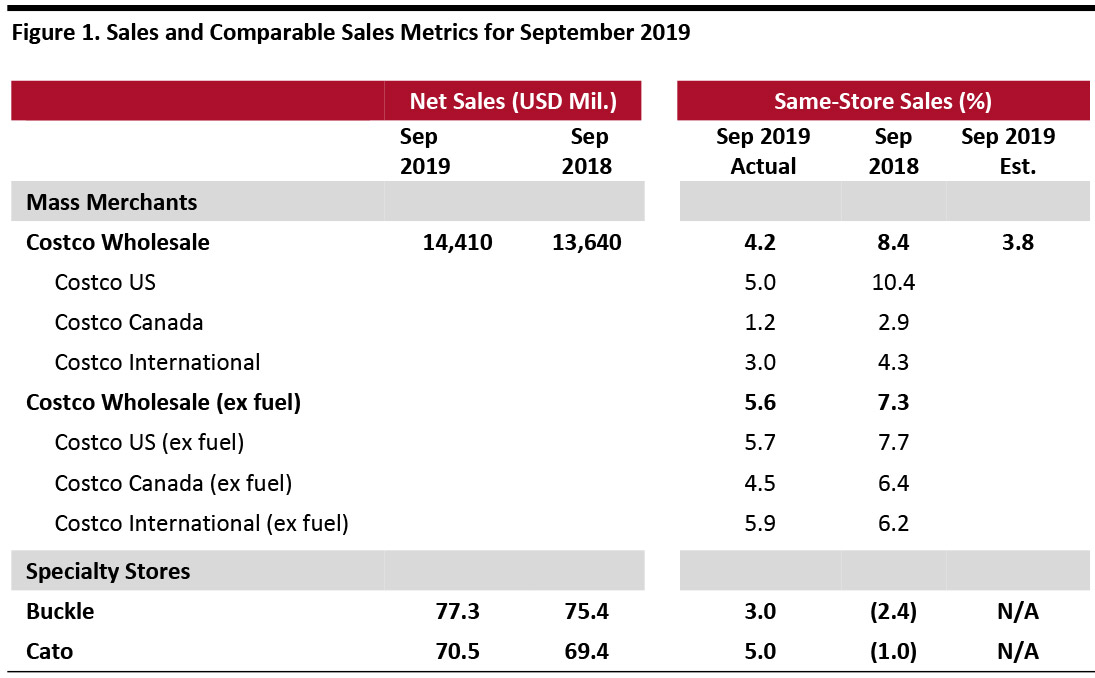 Source: Company reports/StreetAccount[/caption]
Costco Comps Beat Consensus; E-Commerce Comparable Sales Growth Decelerates
Source: Company reports/StreetAccount[/caption]
Costco Comps Beat Consensus; E-Commerce Comparable Sales Growth Decelerates
Source: Company reports/StreetAccount[/caption]
Costco Comps Beat Consensus; E-Commerce Comparable Sales Growth Decelerates
- In September, Costco grew global same-store sales by 4.2% year over year, slower than the 5.5% growth in August, but 40 basis points (bps) above the consensus estimate recorded by StreetAccount. Ex fuel, global comps were up 5.6% in September.
- Costco’s e-commerce comparable sales growth was 17.8% in September, decelerating from August’s 23.9% growth.
- Ex fuel, Costco US comps were up 5.7% in September, lower than 5.9% in August. In terms of US regions, the retailer witnessed the strongest results in the Bay Area, San Diego and Los Angeles in September. Internationally, Costco saw strong sales growth in Japan, Spain and Taiwan.
- Currency fluctuations negatively impacted the company’s comps. Canada same-store sales growth was hurt by about 200 bps, while other international comp growth was negatively impacted by approximately 260 bps. Overall, group comparable sales were negatively impacted by 65 bps.
- Cannibalization negatively impacted US comps by about 30 bps and other international segments by 190 bps. Overall, cannibalization negatively impacted comparable sales by 50 bps.
- In the merchandise segment, excluding currency effects, comps for food and sundries were positive mid-single digits; departments that showed the strongest results were candy, liquor and sundries. Hardlines posted comps in the positive high single digits; the departments with the strong performances were sporting goods, majors, and health and beauty aids. Softlines were up low-single digits; the departments that showed better performance were home furnishing, kiosks and houseware.
- Fresh food comparable sales were up mid-single digits, with service deli and produce being better-performing departments. In the ancillary businesses, hearing aids, optical and pharmacy saw the strongest comp sales increases.
- Gasoline price deflation negatively impacted total comps by about 75 bps; the overall average selling price decreased to $2.86 per gallon this year from $3.03 last year.
- Buckle’s comparable sales increased 3.0% year over year in September, following a 3.1% increase in August. In September, the company’s net sales increased 2.5% year over year following a 2.6% rise in August.
- By business segment, total sales in men’s were up 4.5% year over year. The men’s segment accounted for approximately 49% of total sales in September 2019, the same as in September 2018. In September 2019, price points were down by about 1.5% in the men’s segment.
- Total sales in the women’s segment were up 4% year over year. The women’s segment accounted for 51% of total monthly sales in September 2019, the same as in September 2018. In the women’s business, price points were down about 2% for the month of September.
- By product type, accessories sales were up 7% year over year in September and accounted for 8.5% of total sales. Footwear sales were up 20% year over year and represented 8% of total sales. Average accessory price points decreased about 6% and average footwear price points were down by about 9.5%.
- In September, units per transaction grew about 1.5%.
- Cato’s sales increased 1.6% year over year to $70.5 million in September, slightly higher than the 1.0% increase in August. Comparable sales increased 5.0% year over year in September, accelerating from a 3.0% increase in August.
- The company’s CEO John Cato commented, “September same-store sales continued our positive trend. However, September same-store sales benefited from the negative impact of Hurricane Florence last year. September tariffs have been implemented, and we remain cautiously optimistic as we evaluate the impact of these and future tariffs.”
- As of October 5, 2019, the company operated 1,299 stores in 31 states, down from 1,350 stores in 33 states as of October 6, 2018.