
Nitheesh NH
Introduction
Each report in our Sector Overview series analyzes a retail sector or consumer market. In this report, we dive into retail REITs, with a focus on the U.S.
This report includes:
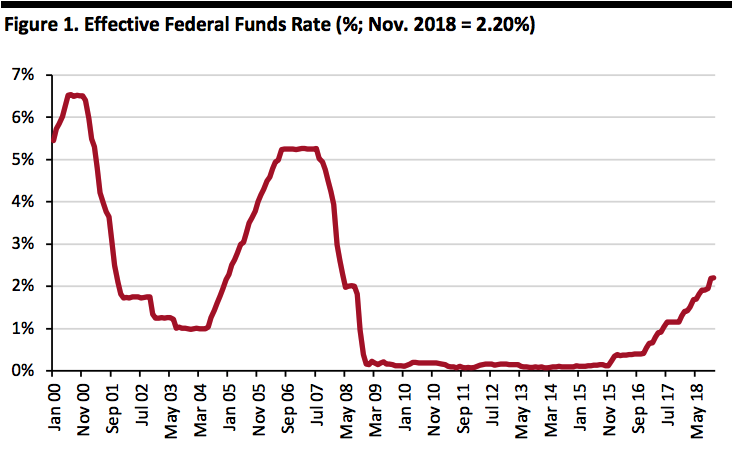 Source: Board of Governors of the Federal Reserve System (U.S.)[/caption]
Occupancy Rates Continue to Rise
The occupancy rate for U.S. malls and shopping centers owned by REITs has shifted upward, growing from 92% in 2010 to 95% or higher in recent years, according to the NaREIT T-Tracker and depicted in the graph below. The increase in occupancy from 2003 until 2017 among retail REITs was second only to the increase seen by industrial REITs, which were buoyed by demand for logistics services needed to fulfill e-commerce orders.
As of the second quarter of 2018, the occupancy rate for retail REITs was 95.2%; for all equity REITs, the rate was lower at 94.3%.
[caption id="attachment_75081" align="aligncenter" width="800"]
Source: Board of Governors of the Federal Reserve System (U.S.)[/caption]
Occupancy Rates Continue to Rise
The occupancy rate for U.S. malls and shopping centers owned by REITs has shifted upward, growing from 92% in 2010 to 95% or higher in recent years, according to the NaREIT T-Tracker and depicted in the graph below. The increase in occupancy from 2003 until 2017 among retail REITs was second only to the increase seen by industrial REITs, which were buoyed by demand for logistics services needed to fulfill e-commerce orders.
As of the second quarter of 2018, the occupancy rate for retail REITs was 95.2%; for all equity REITs, the rate was lower at 94.3%.
[caption id="attachment_75081" align="aligncenter" width="800"]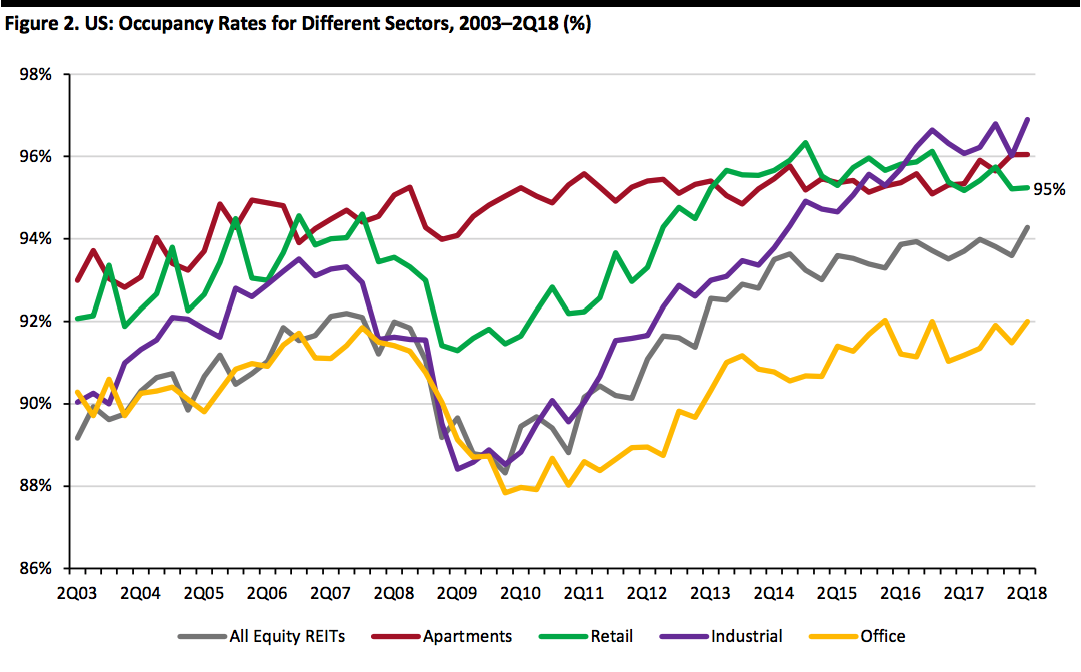 Source: NaREIT T-Tracker[/caption]
Vacancy Rates Are Declining and Rent Asking Rates Are Increasing
Vacancies increased in 32 of 77 metropolitan U.S. regions and effective rents declined in 15 U.S. regions in the fourth quarter of 2018, according to Reis (Real Estate Solutions by Moody’s Analytics).
For the whole year, 51 metropolitan regions saw higher vacancy rates, with three experiencing a rent decline. The increase in vacancy rates was largely due to higher supply than demand.
[caption id="attachment_75082" align="aligncenter" width="580"]
Source: NaREIT T-Tracker[/caption]
Vacancy Rates Are Declining and Rent Asking Rates Are Increasing
Vacancies increased in 32 of 77 metropolitan U.S. regions and effective rents declined in 15 U.S. regions in the fourth quarter of 2018, according to Reis (Real Estate Solutions by Moody’s Analytics).
For the whole year, 51 metropolitan regions saw higher vacancy rates, with three experiencing a rent decline. The increase in vacancy rates was largely due to higher supply than demand.
[caption id="attachment_75082" align="aligncenter" width="580"]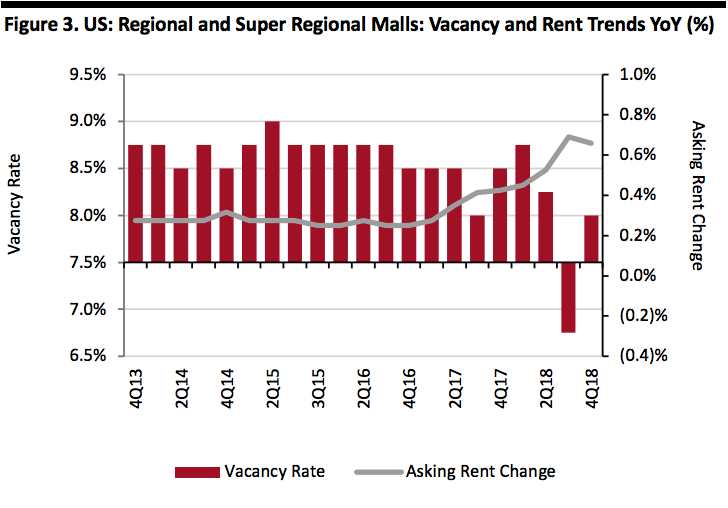 Source: Reis, Real Estate Solutions by Moody’s Analytics[/caption]
The US Is Saturated with Malls
The U.S. is over-retailed, with 23.5 square feet of retail per person, compared to 16.4 square feet in Canada and 11.1 square feet in Australia, according to Morningstar, and this saturation exhibits itself in the proliferation of shopping malls.
Over the past 45 years, the number of malls in the U.S. has grown 300%. According to the International Council of Shopping Centers (ICSC), there are currently 1,221 malls in the U.S. versus just 305 in 1970. Malls gained popularity and more than doubled in number between 1970 and 1980, from 305 to 707. From 1980 to 1990, mall growth continued at a rate of 36%, and there were 965 malls in the U.S. in 1990. Growth slowed to 13% from 1990 to 2000 and fell to 10% from 2000 to 2010. Although the pace of mall development has slowed, the continued and consistent growth overall has created an abundance of malls in the U.S.
[caption id="attachment_75083" align="aligncenter" width="580"]
Source: Reis, Real Estate Solutions by Moody’s Analytics[/caption]
The US Is Saturated with Malls
The U.S. is over-retailed, with 23.5 square feet of retail per person, compared to 16.4 square feet in Canada and 11.1 square feet in Australia, according to Morningstar, and this saturation exhibits itself in the proliferation of shopping malls.
Over the past 45 years, the number of malls in the U.S. has grown 300%. According to the International Council of Shopping Centers (ICSC), there are currently 1,221 malls in the U.S. versus just 305 in 1970. Malls gained popularity and more than doubled in number between 1970 and 1980, from 305 to 707. From 1980 to 1990, mall growth continued at a rate of 36%, and there were 965 malls in the U.S. in 1990. Growth slowed to 13% from 1990 to 2000 and fell to 10% from 2000 to 2010. Although the pace of mall development has slowed, the continued and consistent growth overall has created an abundance of malls in the U.S.
[caption id="attachment_75083" align="aligncenter" width="580"]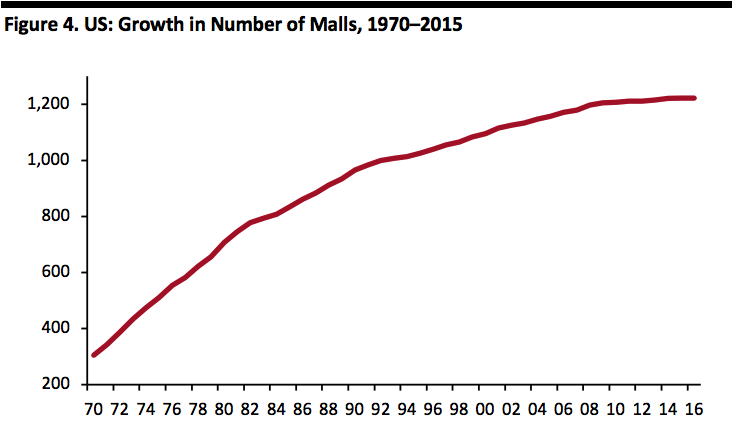 Source: ICSC[/caption]
All Malls Are Not Created Equal: Just 20% of A Malls Generate 72% of All Mall Sales
Malls are classified from A–D in the retail real estate industry based on sales per square foot. The ICSC does not further classify its super-regional and regional malls by type in terms of A–D types and there is no universally accepted method for calculating sales per square foot in the industry. Therefore, there may be some variation among REITs on how each classifies A-D malls.
The table below shows Podell Real Estate Advisors’ regional mall classifications based on sales per square foot.
[caption id="attachment_75084" align="aligncenter" width="580"]
Source: ICSC[/caption]
All Malls Are Not Created Equal: Just 20% of A Malls Generate 72% of All Mall Sales
Malls are classified from A–D in the retail real estate industry based on sales per square foot. The ICSC does not further classify its super-regional and regional malls by type in terms of A–D types and there is no universally accepted method for calculating sales per square foot in the industry. Therefore, there may be some variation among REITs on how each classifies A-D malls.
The table below shows Podell Real Estate Advisors’ regional mall classifications based on sales per square foot.
[caption id="attachment_75084" align="aligncenter" width="580"]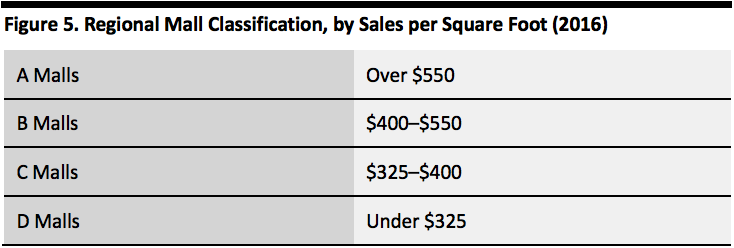 Source: Podell Real Estate Advisors[/caption]
The graph below shows the distribution of U.S. malls by quality grade, broken down into public and private ownership.
[caption id="attachment_75085" align="aligncenter" width="580"]
Source: Podell Real Estate Advisors[/caption]
The graph below shows the distribution of U.S. malls by quality grade, broken down into public and private ownership.
[caption id="attachment_75085" align="aligncenter" width="580"]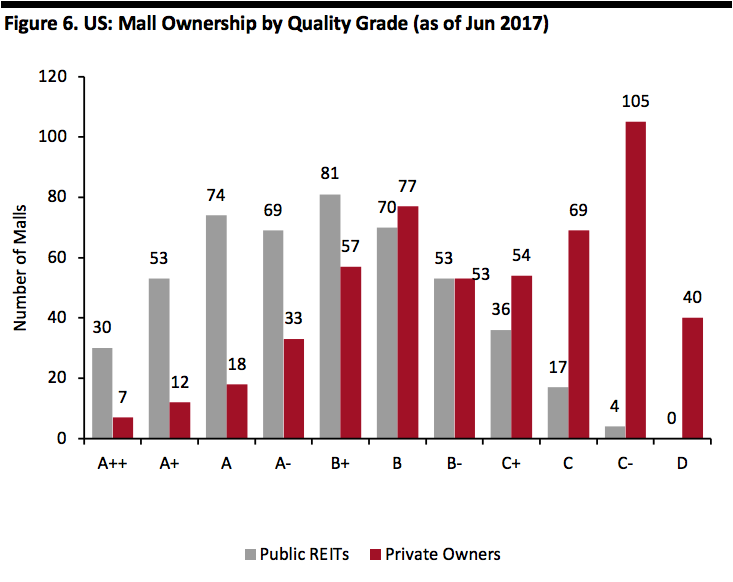 Source: ICSC/Green Street Advisors/Brookfield/NaREIT[/caption]
Over the past 10 years, A malls have seen sales productivity increases of over 10%, whereas B and C malls have seen increases in only the low-to-mid-single digits. According to commercial real estate group CoStar, sales per square foot at A+ malls have grown by more than 50% during the period.
Approximately 20% of the malls in the U.S. are classified as A malls, 55% are B malls, and 25% are C and D malls. Fluctuations may exist among REIT portfolios depending upon individual REIT classifications of A-D malls.
Changes in Store Traffic and Other Metrics Remain Negative
Retail store traffic has been on the decline for several years, and this trend continued through the end of 2018. In the table below, we see a continued year-over-year decline in sales, traffic and the number of transactions at brick and mortar stores through November 2018.
These changes in traffic and sales have serious consequences for landlords, who sometimes are paid based on a share of their tenants’ sales.
[caption id="attachment_75086" align="aligncenter" width="800"]
Source: ICSC/Green Street Advisors/Brookfield/NaREIT[/caption]
Over the past 10 years, A malls have seen sales productivity increases of over 10%, whereas B and C malls have seen increases in only the low-to-mid-single digits. According to commercial real estate group CoStar, sales per square foot at A+ malls have grown by more than 50% during the period.
Approximately 20% of the malls in the U.S. are classified as A malls, 55% are B malls, and 25% are C and D malls. Fluctuations may exist among REIT portfolios depending upon individual REIT classifications of A-D malls.
Changes in Store Traffic and Other Metrics Remain Negative
Retail store traffic has been on the decline for several years, and this trend continued through the end of 2018. In the table below, we see a continued year-over-year decline in sales, traffic and the number of transactions at brick and mortar stores through November 2018.
These changes in traffic and sales have serious consequences for landlords, who sometimes are paid based on a share of their tenants’ sales.
[caption id="attachment_75086" align="aligncenter" width="800"]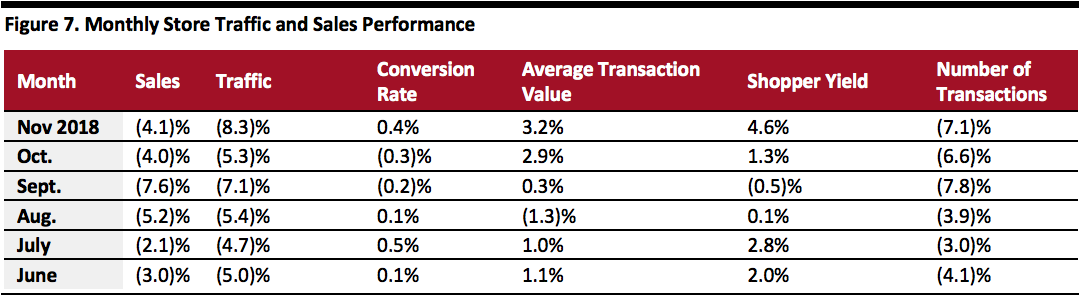 Source: RetailNext[/caption]
Public REIT Owners Are Better Positioned than Private REIT Owners
Retail REITs in the U.S. have fared surprisingly well in terms of operational performance, likely due to their typically investing in properties in higher-income areas, which have not felt the impact of store closures as acutely as other areas. Also, many retail REITs own malls and open-air shopping centers that have effectively strategized to deal with the changing environment.
Figure 6 above shows that the public REITS have more malls clustered in the A and B categories, whereas private owners have more malls classified as grade C and D.
Funds from Operations (FFO) Appear to Have Peaked
FFO is considered a better measure of REIT performance than net income because it discounts the influence of depreciation. FFO is calculated by adding depreciation expense back into net income, along with a few other adjustments, to give investors a more accurate picture of a REIT’s cash flow.
FFO for U.S. equity REITs in the second quarter of 2018 grew to $16.4 billion, which represented a 5.5% rise quarter over quarter and a 6% rise year over year. For retail REITs specifically, FFO grew by more than 10% over the five-year period ended 2017, highlighting positive operational performance, although there was a flattening toward the end, which can be seen in the graph below.
Regional mall REITs contributed the highest share toward total FFO of retail REITs between 2000 and 2017, followed by shopping center REITs and freestanding REITs. In 2017, FFO from shopping center REITs declined by 2.9% year over year, whereas FFO from regional mall and freestanding REITs grew by 1.2% and 9.2%, respectively.
[caption id="attachment_75088" align="aligncenter" width="800"]
Source: RetailNext[/caption]
Public REIT Owners Are Better Positioned than Private REIT Owners
Retail REITs in the U.S. have fared surprisingly well in terms of operational performance, likely due to their typically investing in properties in higher-income areas, which have not felt the impact of store closures as acutely as other areas. Also, many retail REITs own malls and open-air shopping centers that have effectively strategized to deal with the changing environment.
Figure 6 above shows that the public REITS have more malls clustered in the A and B categories, whereas private owners have more malls classified as grade C and D.
Funds from Operations (FFO) Appear to Have Peaked
FFO is considered a better measure of REIT performance than net income because it discounts the influence of depreciation. FFO is calculated by adding depreciation expense back into net income, along with a few other adjustments, to give investors a more accurate picture of a REIT’s cash flow.
FFO for U.S. equity REITs in the second quarter of 2018 grew to $16.4 billion, which represented a 5.5% rise quarter over quarter and a 6% rise year over year. For retail REITs specifically, FFO grew by more than 10% over the five-year period ended 2017, highlighting positive operational performance, although there was a flattening toward the end, which can be seen in the graph below.
Regional mall REITs contributed the highest share toward total FFO of retail REITs between 2000 and 2017, followed by shopping center REITs and freestanding REITs. In 2017, FFO from shopping center REITs declined by 2.9% year over year, whereas FFO from regional mall and freestanding REITs grew by 1.2% and 9.2%, respectively.
[caption id="attachment_75088" align="aligncenter" width="800"]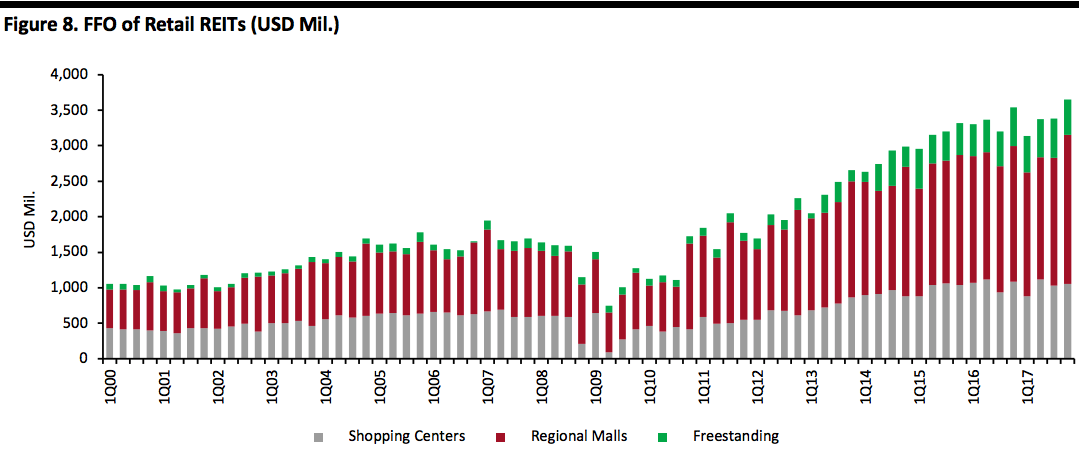 Source: NaREIT T-Tracker[/caption]
Store Openings and Closures Are Affecting the Retail Mix
Retail REITs have countered the challenging retail environment by reexamining and reshaping tenant mixes. Many REITs have welcomed new tenants, to ensure that occupancy rates remain high, and factored in shoppers’ desire for experiences when choosing tenants. Retail REITs are also investing in improvements to properties to enhance appeal to shoppers.
In 2018, Coresight Research tracked 5,524 store closures in the U.S., down from 8,139 store closures in 2017. By sector, apparel specialist stores led the pack with 766 closures; Payless ShoeSource contributed 408 of these closures. Toys “R” Us closed the most stores in the U.S. in 2018.
See also our report Reviewing 2018 U.S. and U.K. Store Closures.
The table below depicts the largest declines and increases in REIT-owned mall anchors over the 2011–2016 period.
Largest Number of Store Closures
Source: NaREIT T-Tracker[/caption]
Store Openings and Closures Are Affecting the Retail Mix
Retail REITs have countered the challenging retail environment by reexamining and reshaping tenant mixes. Many REITs have welcomed new tenants, to ensure that occupancy rates remain high, and factored in shoppers’ desire for experiences when choosing tenants. Retail REITs are also investing in improvements to properties to enhance appeal to shoppers.
In 2018, Coresight Research tracked 5,524 store closures in the U.S., down from 8,139 store closures in 2017. By sector, apparel specialist stores led the pack with 766 closures; Payless ShoeSource contributed 408 of these closures. Toys “R” Us closed the most stores in the U.S. in 2018.
See also our report Reviewing 2018 U.S. and U.K. Store Closures.
The table below depicts the largest declines and increases in REIT-owned mall anchors over the 2011–2016 period.
Largest Number of Store Closures
 Source: ICSC/NaREIT[/caption]
Retail REITs Are Welcoming More Non-Traditional Occupants, Particularly Food
There is a growing trend among mall REITs to lease out more space in their properties to non-traditional tenants such as banks, fitness centers, coworking spaces and entertainment centers.
In August, Macerich announced that it will team up with coworking company Industrious to bring shared office spaces into some of its shopping centers, while Brookfield Properties Retail Group signed a deal with coworking space WeWork in 2017.
Simon Property Group has redeveloped department stores in malls that have closed into hotels, fitness centers, entertainment centers and modern dining outlets.
Taubman centers has strategically added destination retailers and anchors such as Sea Life Aquarium, Legoland, RH Gallery, Round1, Sports Monster and Aquafield to its centers.
Mall owners have been focusing less on apparel and more on food and beverage outlets as potential traffic drivers in recent years. In European malls, food service accounts for up to 25% of gross leasable area and it accounts for up to 40% in Asian malls, but U.S. malls may not be able to support that level of food and beverage outlets: Many industry experts think there is a high-teens ceiling on how much mall space can realistically be allocated to food service in the U.S. market. Food service currently accounts for 5%–10% of gross leasable area in U.S. malls.
Sector Momentum
Sector Size and Growth
The U.S. REIT industry has a total market capitalization of more than $1 trillion and holds more than $3 trillion in gross real estate assets. According to the Internal Revenue Service, there are around 1,100 U.S. REITs that have filed tax returns. Of these, as of December 2018, 226 REITs feature on the FTSE NaREIT All REITs Index with 186 trading on the NYSE.
[caption id="attachment_75094" align="aligncenter" width="580"]
Source: ICSC/NaREIT[/caption]
Retail REITs Are Welcoming More Non-Traditional Occupants, Particularly Food
There is a growing trend among mall REITs to lease out more space in their properties to non-traditional tenants such as banks, fitness centers, coworking spaces and entertainment centers.
In August, Macerich announced that it will team up with coworking company Industrious to bring shared office spaces into some of its shopping centers, while Brookfield Properties Retail Group signed a deal with coworking space WeWork in 2017.
Simon Property Group has redeveloped department stores in malls that have closed into hotels, fitness centers, entertainment centers and modern dining outlets.
Taubman centers has strategically added destination retailers and anchors such as Sea Life Aquarium, Legoland, RH Gallery, Round1, Sports Monster and Aquafield to its centers.
Mall owners have been focusing less on apparel and more on food and beverage outlets as potential traffic drivers in recent years. In European malls, food service accounts for up to 25% of gross leasable area and it accounts for up to 40% in Asian malls, but U.S. malls may not be able to support that level of food and beverage outlets: Many industry experts think there is a high-teens ceiling on how much mall space can realistically be allocated to food service in the U.S. market. Food service currently accounts for 5%–10% of gross leasable area in U.S. malls.
Sector Momentum
Sector Size and Growth
The U.S. REIT industry has a total market capitalization of more than $1 trillion and holds more than $3 trillion in gross real estate assets. According to the Internal Revenue Service, there are around 1,100 U.S. REITs that have filed tax returns. Of these, as of December 2018, 226 REITs feature on the FTSE NaREIT All REITs Index with 186 trading on the NYSE.
[caption id="attachment_75094" align="aligncenter" width="580"] Source: NAREIT/Coresight Research[/caption]
Headwinds and Tailwinds
Sector Headwinds
Source: NAREIT/Coresight Research[/caption]
Headwinds and Tailwinds
Sector Headwinds
 Source: Taubman Centers/Statista[/caption]
Despite challenging times, top-tier retail REITs reported positive performance in 2017 because of strategies they adopted in anticipation of the difficult environment.
The table below evaluates retailers covered in this report based on revenues, margins, net income, and compares their sales by segment and geography.
Company Summaries
[caption id="attachment_75097" align="aligncenter" width="800"]
Source: Taubman Centers/Statista[/caption]
Despite challenging times, top-tier retail REITs reported positive performance in 2017 because of strategies they adopted in anticipation of the difficult environment.
The table below evaluates retailers covered in this report based on revenues, margins, net income, and compares their sales by segment and geography.
Company Summaries
[caption id="attachment_75097" align="aligncenter" width="800"]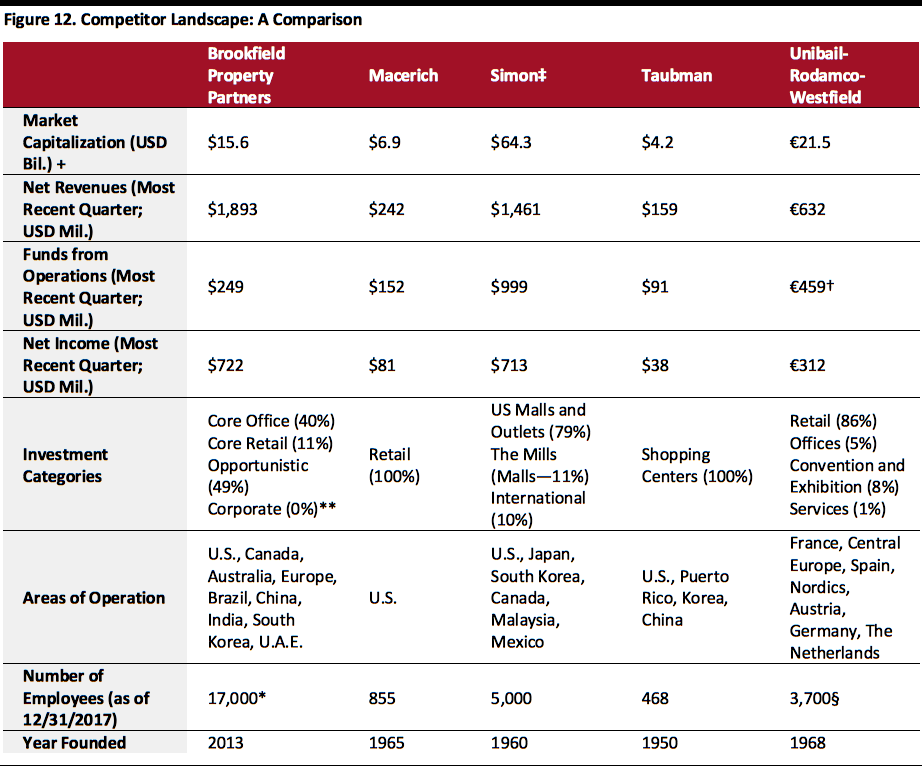 *Includes Brookfield Property Group employees and operating employees employed by affiliated and/or portfolio companies owned by Brookfield or Brookfield-sponsored funds.
**Less than 0.5%
+As of January 14, 2019
§As of December 1, 2018
‡Quarter ended December 31, 2018
†Operating income
Source: Company reports/S&P Capital IQ/Coresight Research[/caption] Innovators and Disruptors The challenging environment for REITs in recent times has led to the adoption of innovative strategies by proactive REITs. As discussed previously in this report, REITs have started welcoming new and non-traditional tenants into their properties. Mixed use mall properties, coworking spaces and food services have risen in prominence. Retail REITs have also focused on enhancing the experiential element in its centers. Simon Property Group, Brookfield, Macerich and Taubman Centers have led innovation in these areas. Among non-retail REITs, Innovative Industrial Properties Inc. (Innovative), the only publicly traded cannabis REIT in the U.S. has emerged as one of the best performing U.S. REITs in 2018. The company, which was founded in December 2016, owns properties in eight states. With marijuana being a controlled substance, growers face difficulty in securing space with regular landlords, presenting and opportunity for Innovative, as the lone cannabis REIT, to charge higher rents. The company raised $119.6 million in its fourth round of funding in October 2018. Sector Outlook 2017 was a year of consolidation, and in 2018, various factors, especially rising interest rates, contributed to making it a tough climate for REITs. In 2019 further interest rate hikes, slower demand for housing and growing economic uncertainty are likely to dominate the REIT landscape, which will mean testing times ahead for REITs, with weaker REITs particularly vulnerable.
- A discussion of key sector themes.
- A review of retail sector momentum.
- A summary of the sector landscape, including market shares for the top retailers in their respective categories.
- The outlook for the sector.
Source: Board of Governors of the Federal Reserve System (U.S.)[/caption]
Occupancy Rates Continue to Rise
The occupancy rate for U.S. malls and shopping centers owned by REITs has shifted upward, growing from 92% in 2010 to 95% or higher in recent years, according to the NaREIT T-Tracker and depicted in the graph below. The increase in occupancy from 2003 until 2017 among retail REITs was second only to the increase seen by industrial REITs, which were buoyed by demand for logistics services needed to fulfill e-commerce orders.
As of the second quarter of 2018, the occupancy rate for retail REITs was 95.2%; for all equity REITs, the rate was lower at 94.3%.
[caption id="attachment_75081" align="aligncenter" width="800"] Source: NaREIT T-Tracker[/caption]
Vacancy Rates Are Declining and Rent Asking Rates Are Increasing
Vacancies increased in 32 of 77 metropolitan U.S. regions and effective rents declined in 15 U.S. regions in the fourth quarter of 2018, according to Reis (Real Estate Solutions by Moody’s Analytics).
For the whole year, 51 metropolitan regions saw higher vacancy rates, with three experiencing a rent decline. The increase in vacancy rates was largely due to higher supply than demand.
[caption id="attachment_75082" align="aligncenter" width="580"] Source: Reis, Real Estate Solutions by Moody’s Analytics[/caption]
The US Is Saturated with Malls
The U.S. is over-retailed, with 23.5 square feet of retail per person, compared to 16.4 square feet in Canada and 11.1 square feet in Australia, according to Morningstar, and this saturation exhibits itself in the proliferation of shopping malls.
Over the past 45 years, the number of malls in the U.S. has grown 300%. According to the International Council of Shopping Centers (ICSC), there are currently 1,221 malls in the U.S. versus just 305 in 1970. Malls gained popularity and more than doubled in number between 1970 and 1980, from 305 to 707. From 1980 to 1990, mall growth continued at a rate of 36%, and there were 965 malls in the U.S. in 1990. Growth slowed to 13% from 1990 to 2000 and fell to 10% from 2000 to 2010. Although the pace of mall development has slowed, the continued and consistent growth overall has created an abundance of malls in the U.S.
[caption id="attachment_75083" align="aligncenter" width="580"] Source: ICSC[/caption]
All Malls Are Not Created Equal: Just 20% of A Malls Generate 72% of All Mall Sales
Malls are classified from A–D in the retail real estate industry based on sales per square foot. The ICSC does not further classify its super-regional and regional malls by type in terms of A–D types and there is no universally accepted method for calculating sales per square foot in the industry. Therefore, there may be some variation among REITs on how each classifies A-D malls.
The table below shows Podell Real Estate Advisors’ regional mall classifications based on sales per square foot.
[caption id="attachment_75084" align="aligncenter" width="580"] Source: Podell Real Estate Advisors[/caption]
The graph below shows the distribution of U.S. malls by quality grade, broken down into public and private ownership.
[caption id="attachment_75085" align="aligncenter" width="580"] Source: ICSC/Green Street Advisors/Brookfield/NaREIT[/caption]
Over the past 10 years, A malls have seen sales productivity increases of over 10%, whereas B and C malls have seen increases in only the low-to-mid-single digits. According to commercial real estate group CoStar, sales per square foot at A+ malls have grown by more than 50% during the period.
Approximately 20% of the malls in the U.S. are classified as A malls, 55% are B malls, and 25% are C and D malls. Fluctuations may exist among REIT portfolios depending upon individual REIT classifications of A-D malls.
Changes in Store Traffic and Other Metrics Remain Negative
Retail store traffic has been on the decline for several years, and this trend continued through the end of 2018. In the table below, we see a continued year-over-year decline in sales, traffic and the number of transactions at brick and mortar stores through November 2018.
These changes in traffic and sales have serious consequences for landlords, who sometimes are paid based on a share of their tenants’ sales.
[caption id="attachment_75086" align="aligncenter" width="800"] Source: RetailNext[/caption]
Public REIT Owners Are Better Positioned than Private REIT Owners
Retail REITs in the U.S. have fared surprisingly well in terms of operational performance, likely due to their typically investing in properties in higher-income areas, which have not felt the impact of store closures as acutely as other areas. Also, many retail REITs own malls and open-air shopping centers that have effectively strategized to deal with the changing environment.
Figure 6 above shows that the public REITS have more malls clustered in the A and B categories, whereas private owners have more malls classified as grade C and D.
Funds from Operations (FFO) Appear to Have Peaked
FFO is considered a better measure of REIT performance than net income because it discounts the influence of depreciation. FFO is calculated by adding depreciation expense back into net income, along with a few other adjustments, to give investors a more accurate picture of a REIT’s cash flow.
FFO for U.S. equity REITs in the second quarter of 2018 grew to $16.4 billion, which represented a 5.5% rise quarter over quarter and a 6% rise year over year. For retail REITs specifically, FFO grew by more than 10% over the five-year period ended 2017, highlighting positive operational performance, although there was a flattening toward the end, which can be seen in the graph below.
Regional mall REITs contributed the highest share toward total FFO of retail REITs between 2000 and 2017, followed by shopping center REITs and freestanding REITs. In 2017, FFO from shopping center REITs declined by 2.9% year over year, whereas FFO from regional mall and freestanding REITs grew by 1.2% and 9.2%, respectively.
[caption id="attachment_75088" align="aligncenter" width="800"] Source: NaREIT T-Tracker[/caption]
Store Openings and Closures Are Affecting the Retail Mix
Retail REITs have countered the challenging retail environment by reexamining and reshaping tenant mixes. Many REITs have welcomed new tenants, to ensure that occupancy rates remain high, and factored in shoppers’ desire for experiences when choosing tenants. Retail REITs are also investing in improvements to properties to enhance appeal to shoppers.
In 2018, Coresight Research tracked 5,524 store closures in the U.S., down from 8,139 store closures in 2017. By sector, apparel specialist stores led the pack with 766 closures; Payless ShoeSource contributed 408 of these closures. Toys “R” Us closed the most stores in the U.S. in 2018.
See also our report Reviewing 2018 U.S. and U.K. Store Closures.
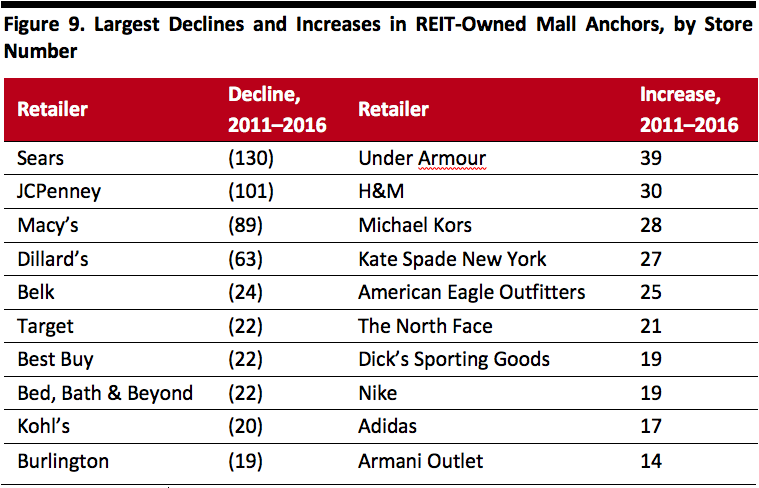
The table below depicts the largest declines and increases in REIT-owned mall anchors over the 2011–2016 period.
Largest Number of Store Closures
- Sears, JCPenney, Macy’s and Dillard’s, which had the highest number of anchor stores in mall REITS in 2006, 2011 and 2016, were also the retailers that saw the highest numbers of store closures over the 2011–2016 period.
- With the growth of e-commerce, many department stores and household goods retailers that sell products customers can more easily buy online have seen a high number of store closures.
- Some fashion and clothing stores, including Under Armour, H&M and Michael Kors, also show a large increase over the period.
- A common theme among all the retailers whose mall store numbers have increased is that they sell products that shoppers choose carefully, based on size, fit and appearance. Those categories tend to attract more in-store traffic and their sales are less affected by e-commerce than are sales in some other categories.
Source: ICSC/NaREIT[/caption]
Retail REITs Are Welcoming More Non-Traditional Occupants, Particularly Food
There is a growing trend among mall REITs to lease out more space in their properties to non-traditional tenants such as banks, fitness centers, coworking spaces and entertainment centers.
In August, Macerich announced that it will team up with coworking company Industrious to bring shared office spaces into some of its shopping centers, while Brookfield Properties Retail Group signed a deal with coworking space WeWork in 2017.
Simon Property Group has redeveloped department stores in malls that have closed into hotels, fitness centers, entertainment centers and modern dining outlets.
Taubman centers has strategically added destination retailers and anchors such as Sea Life Aquarium, Legoland, RH Gallery, Round1, Sports Monster and Aquafield to its centers.
Mall owners have been focusing less on apparel and more on food and beverage outlets as potential traffic drivers in recent years. In European malls, food service accounts for up to 25% of gross leasable area and it accounts for up to 40% in Asian malls, but U.S. malls may not be able to support that level of food and beverage outlets: Many industry experts think there is a high-teens ceiling on how much mall space can realistically be allocated to food service in the U.S. market. Food service currently accounts for 5%–10% of gross leasable area in U.S. malls.
Sector Momentum
Sector Size and Growth
The U.S. REIT industry has a total market capitalization of more than $1 trillion and holds more than $3 trillion in gross real estate assets. According to the Internal Revenue Service, there are around 1,100 U.S. REITs that have filed tax returns. Of these, as of December 2018, 226 REITs feature on the FTSE NaREIT All REITs Index with 186 trading on the NYSE.
[caption id="attachment_75094" align="aligncenter" width="580"] Source: NAREIT/Coresight Research[/caption]
Headwinds and Tailwinds
Sector Headwinds
- The continuing headwind for retail remains the relentless growth in e-commerce sales, which is driving declines in store traffic.
- Interest rate hikes, slower demand for housing and growing economic uncertainty represent impediments to growth for REITs in 2019.
- Other headwinds include rising vacancy rates and the effect of the loss of anchor stores in malls.
- Robust job growth, consumer spending and business activity is driving demand for most types of commercial real estate, which represents a cause for optimism to an extent for 2019.
- Other tailwinds include declining vacancy rates and increasing rents, as well as the change towards a mix of more stable tenants such as restaurants and away from big-box retail.
Source: Taubman Centers/Statista[/caption]
Despite challenging times, top-tier retail REITs reported positive performance in 2017 because of strategies they adopted in anticipation of the difficult environment.
The table below evaluates retailers covered in this report based on revenues, margins, net income, and compares their sales by segment and geography.
Company Summaries
[caption id="attachment_75097" align="aligncenter" width="800"] *Includes Brookfield Property Group employees and operating employees employed by affiliated and/or portfolio companies owned by Brookfield or Brookfield-sponsored funds.**Less than 0.5%
+As of January 14, 2019
§As of December 1, 2018
‡Quarter ended December 31, 2018
†Operating income
Source: Company reports/S&P Capital IQ/Coresight Research[/caption] Innovators and Disruptors The challenging environment for REITs in recent times has led to the adoption of innovative strategies by proactive REITs. As discussed previously in this report, REITs have started welcoming new and non-traditional tenants into their properties. Mixed use mall properties, coworking spaces and food services have risen in prominence. Retail REITs have also focused on enhancing the experiential element in its centers. Simon Property Group, Brookfield, Macerich and Taubman Centers have led innovation in these areas. Among non-retail REITs, Innovative Industrial Properties Inc. (Innovative), the only publicly traded cannabis REIT in the U.S. has emerged as one of the best performing U.S. REITs in 2018. The company, which was founded in December 2016, owns properties in eight states. With marijuana being a controlled substance, growers face difficulty in securing space with regular landlords, presenting and opportunity for Innovative, as the lone cannabis REIT, to charge higher rents. The company raised $119.6 million in its fourth round of funding in October 2018. Sector Outlook 2017 was a year of consolidation, and in 2018, various factors, especially rising interest rates, contributed to making it a tough climate for REITs. In 2019 further interest rate hikes, slower demand for housing and growing economic uncertainty are likely to dominate the REIT landscape, which will mean testing times ahead for REITs, with weaker REITs particularly vulnerable.