albert Chan
ESG Issues
Salesforce kicked off the meeting with a panel on environmental, social and governance (ESG) issues. The company spent a significant part of last year’s meeting on its core values—trust, customer success, innovation and equality—and says those values are woven into the company’s strategy, under the slogan “values create values.”
Meeting Overview
This year’s meeting discussed four major categories plus financials:
- Markets
- Drivers
- Strategies
- Innovation
- Margins and cash
Raises FY20 Guidance, Introduces FY21 Guidance and Introduces FY24 Revenue Target
At the start of the meeting, Salesforce offered new, raised guidance:
- Raised FY20 revenue guidance to $16.99–$17.00 billion from $16.75–$16.90 billion previously.
- Initiated FY21 revenue guidance of $20.8-$20.9 billion (up 22%–23%).
- Set a goal of doubling revenues again to $35 billion by FY24 (a 20% CAGR).
Markets
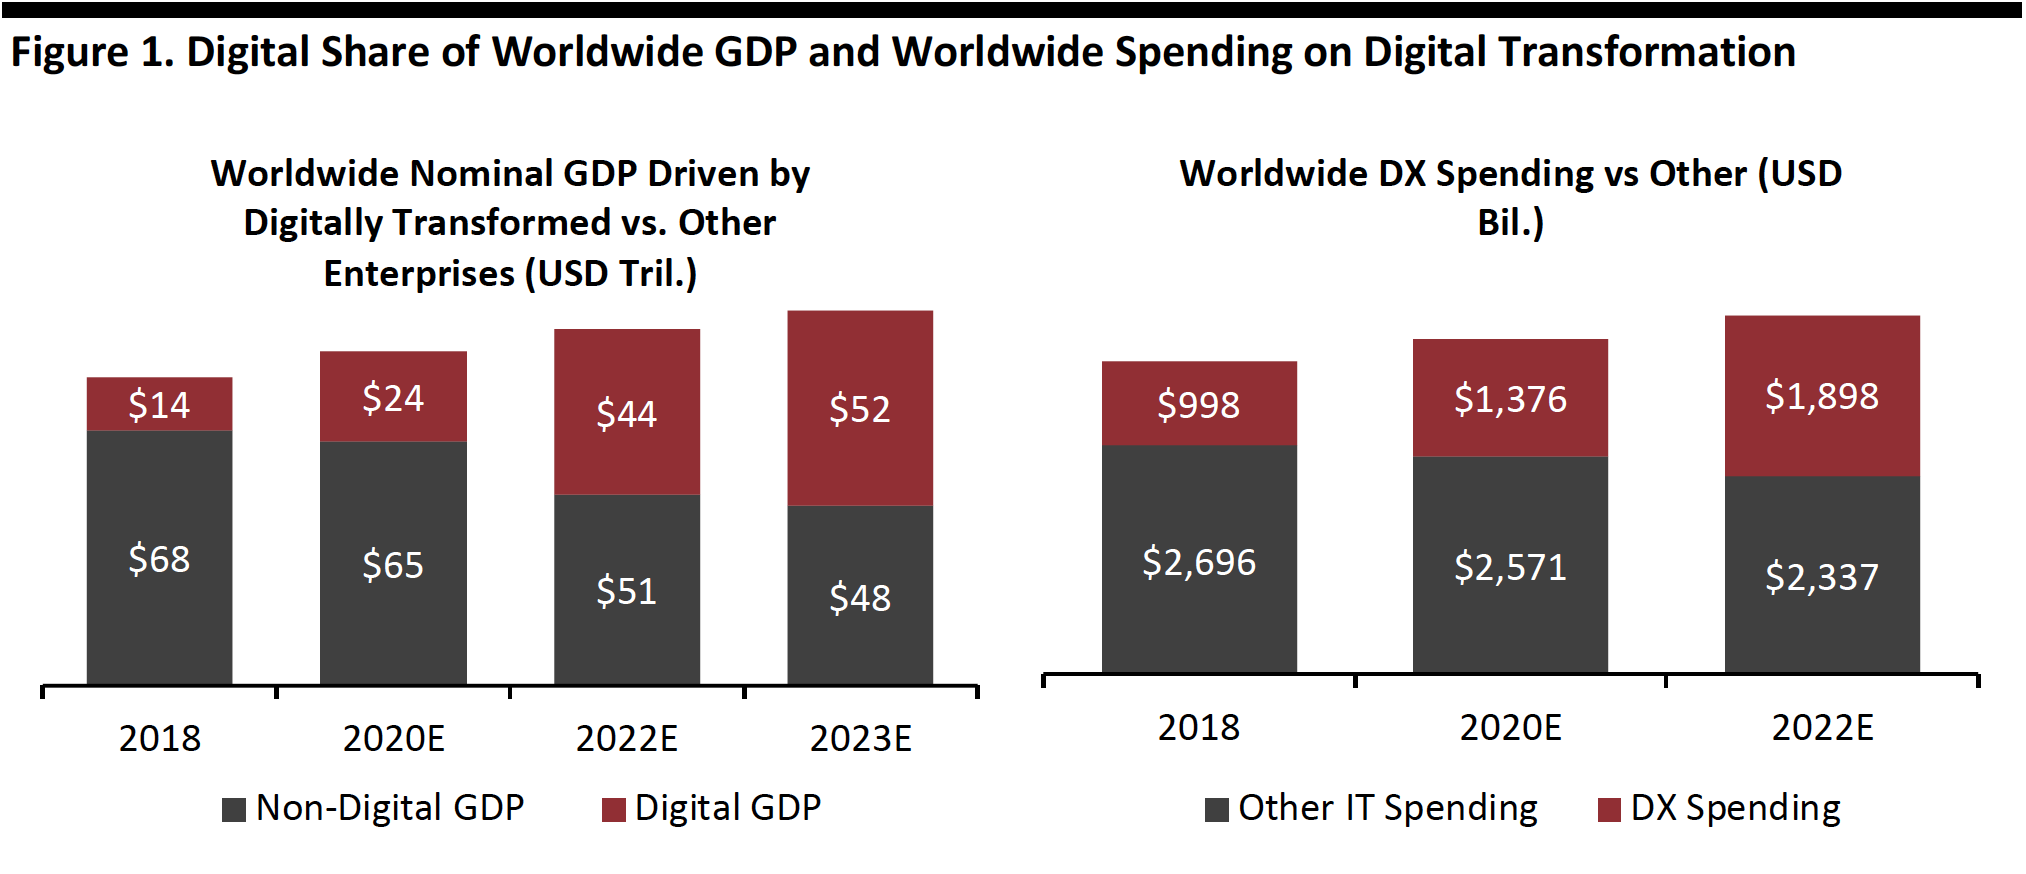
The share of global GDP that comes from companies that Salesforce considers to be “digitally transformed” is expected to approach 50% by 2023, and spending on digital transformation is growing rapidly.
- The share of global GDP contributed by companies that have digitalized their businesses is expected to grow at a 30% CAGR during 2018-2023E.
- Digital transformation spending is expected to grow at a 17.4% CAGE during 2018-2022E.
 Source: Salesforce/IDC[/caption]
Salesforce claims to have accumulated a first-mover advantage for future growth and innovation, investing $24 billion over the past 18 months on organic growth and acquisitions.
The company estimates its addressable market to be $168 billion, with individual categories growing at CAGRs ranging from 7%-13% during 2017–2023E.
[caption id="attachment_100404" align="aligncenter" width="700"]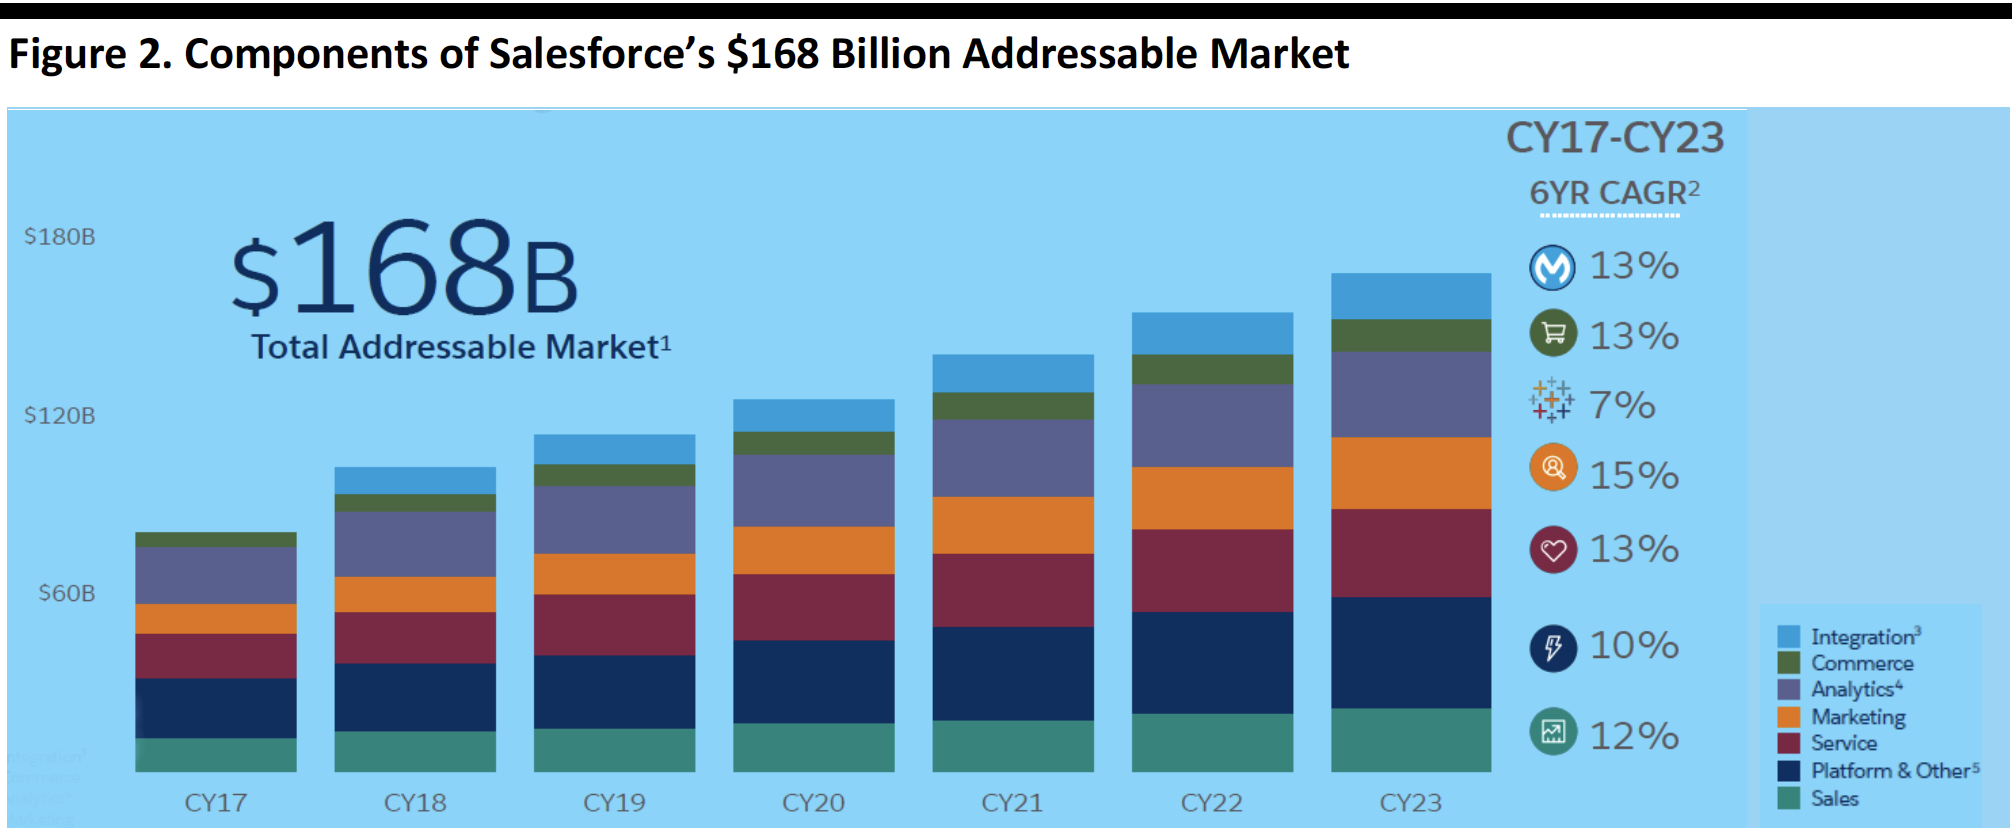 Source: Salesforce/Gartner[/caption]
Salesforce remains the global leader in CRM, with a 17.3% market share in 1H19 according to IDC, and remains well-positioned with 40% of its customers adopting multi-cloud infrastructure.
Growth Drivers
Salesforce’s growth drivers include the following:
- The company tripled sales capacity since FY14 and productivity remains constant, driving revenue growth.
- Salesforce addresses multiple management tiers within an enterprise, targeting digital transformation, different industry verticals, the opportunity from multiple clouds, the move to the cloud and solving essential business problems.
- The company is also driving growth through new customer acquisition, and selling within its installed base, including selling new products plus additional seats and upgrades.
Growth Strategies
Salesforce’s growth strategy is based on growth among enterprises, new geographies and verticals.
Enterprises
Salesforce grew enterprise revenues to 67% of total revenues in FY20, up from 58% in FY16, as shown below.
[caption id="attachment_100405" align="aligncenter" width="700"]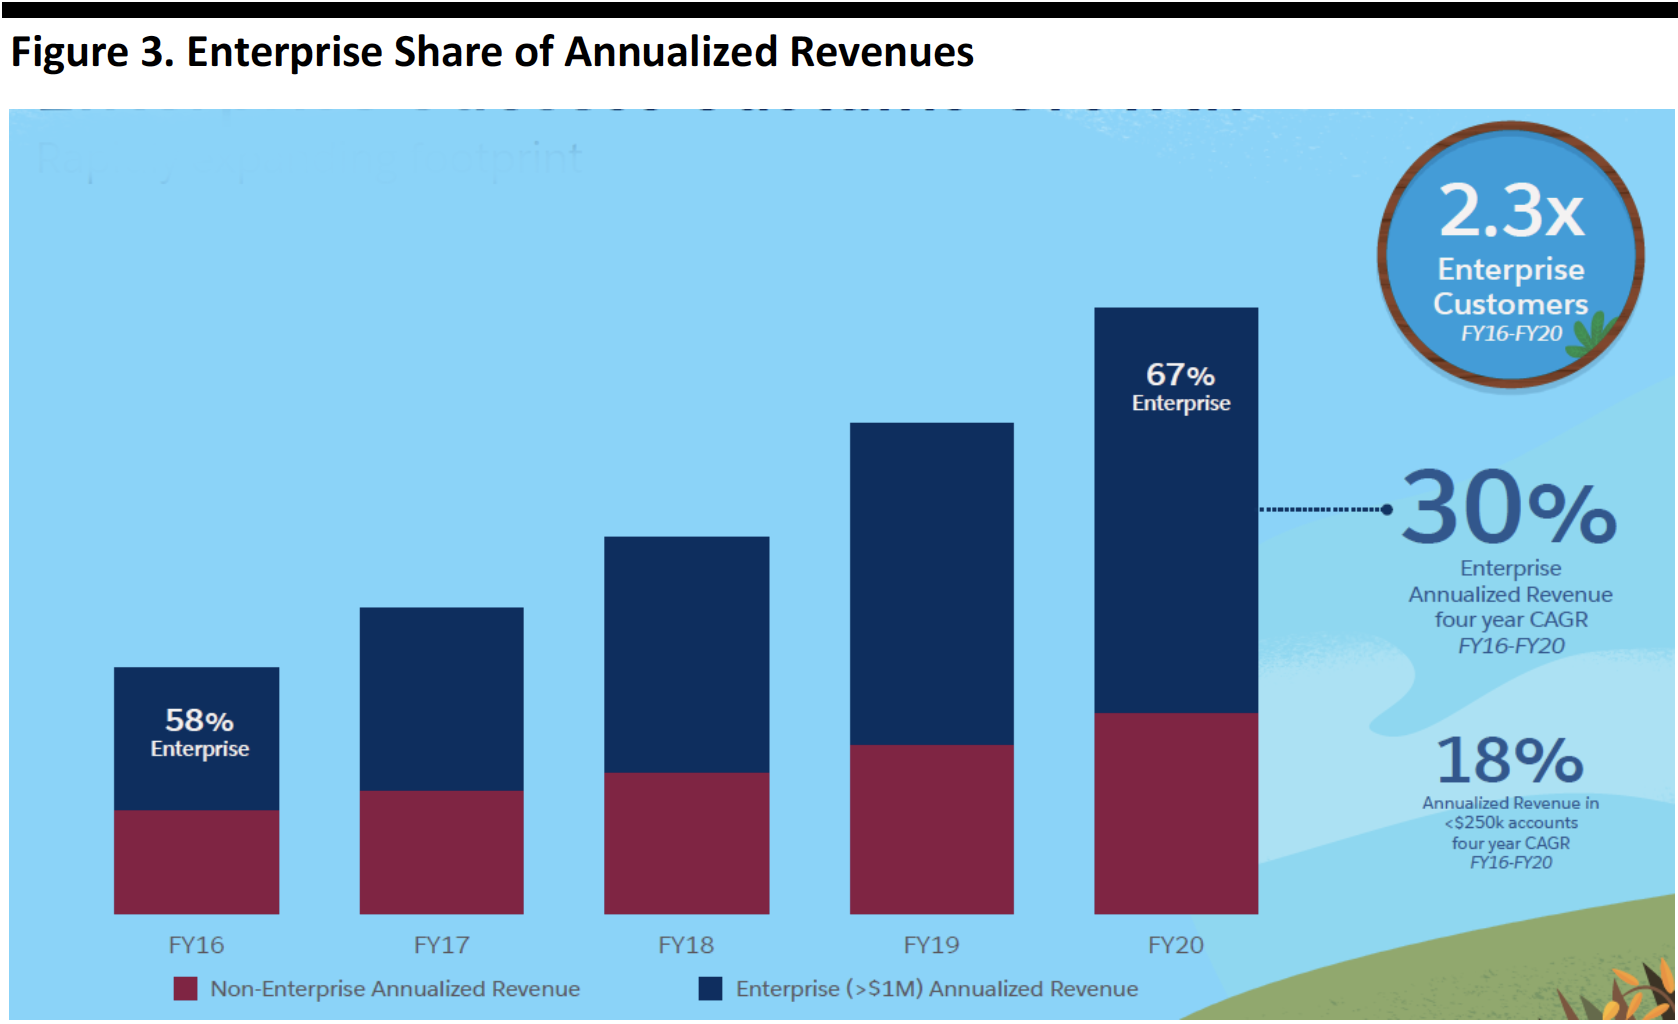 Source: Company reports[/caption]
Salesforce characterized its enterprise strategy as “land and expand,” meaning win the customer and then sell more products and services over time.
Verticals
Salesforce has achieved this growth by targeting high-growth verticals, such as technology. In the figure below, we see that technology accounts for three of the top 10 accounts by revenue in FY20, and retail accounts for two of the top 10.
[caption id="attachment_100406" align="aligncenter" width="700"] Source: Company reports[/caption]
Additional growth drivers include partnerships with system integrators and independent software vendors, as well as consultants who gain knowledge and expertise from the company’s Trailhead platform and from strategic technology partners (illustrated below).
[caption id="attachment_100407" align="aligncenter" width="700"]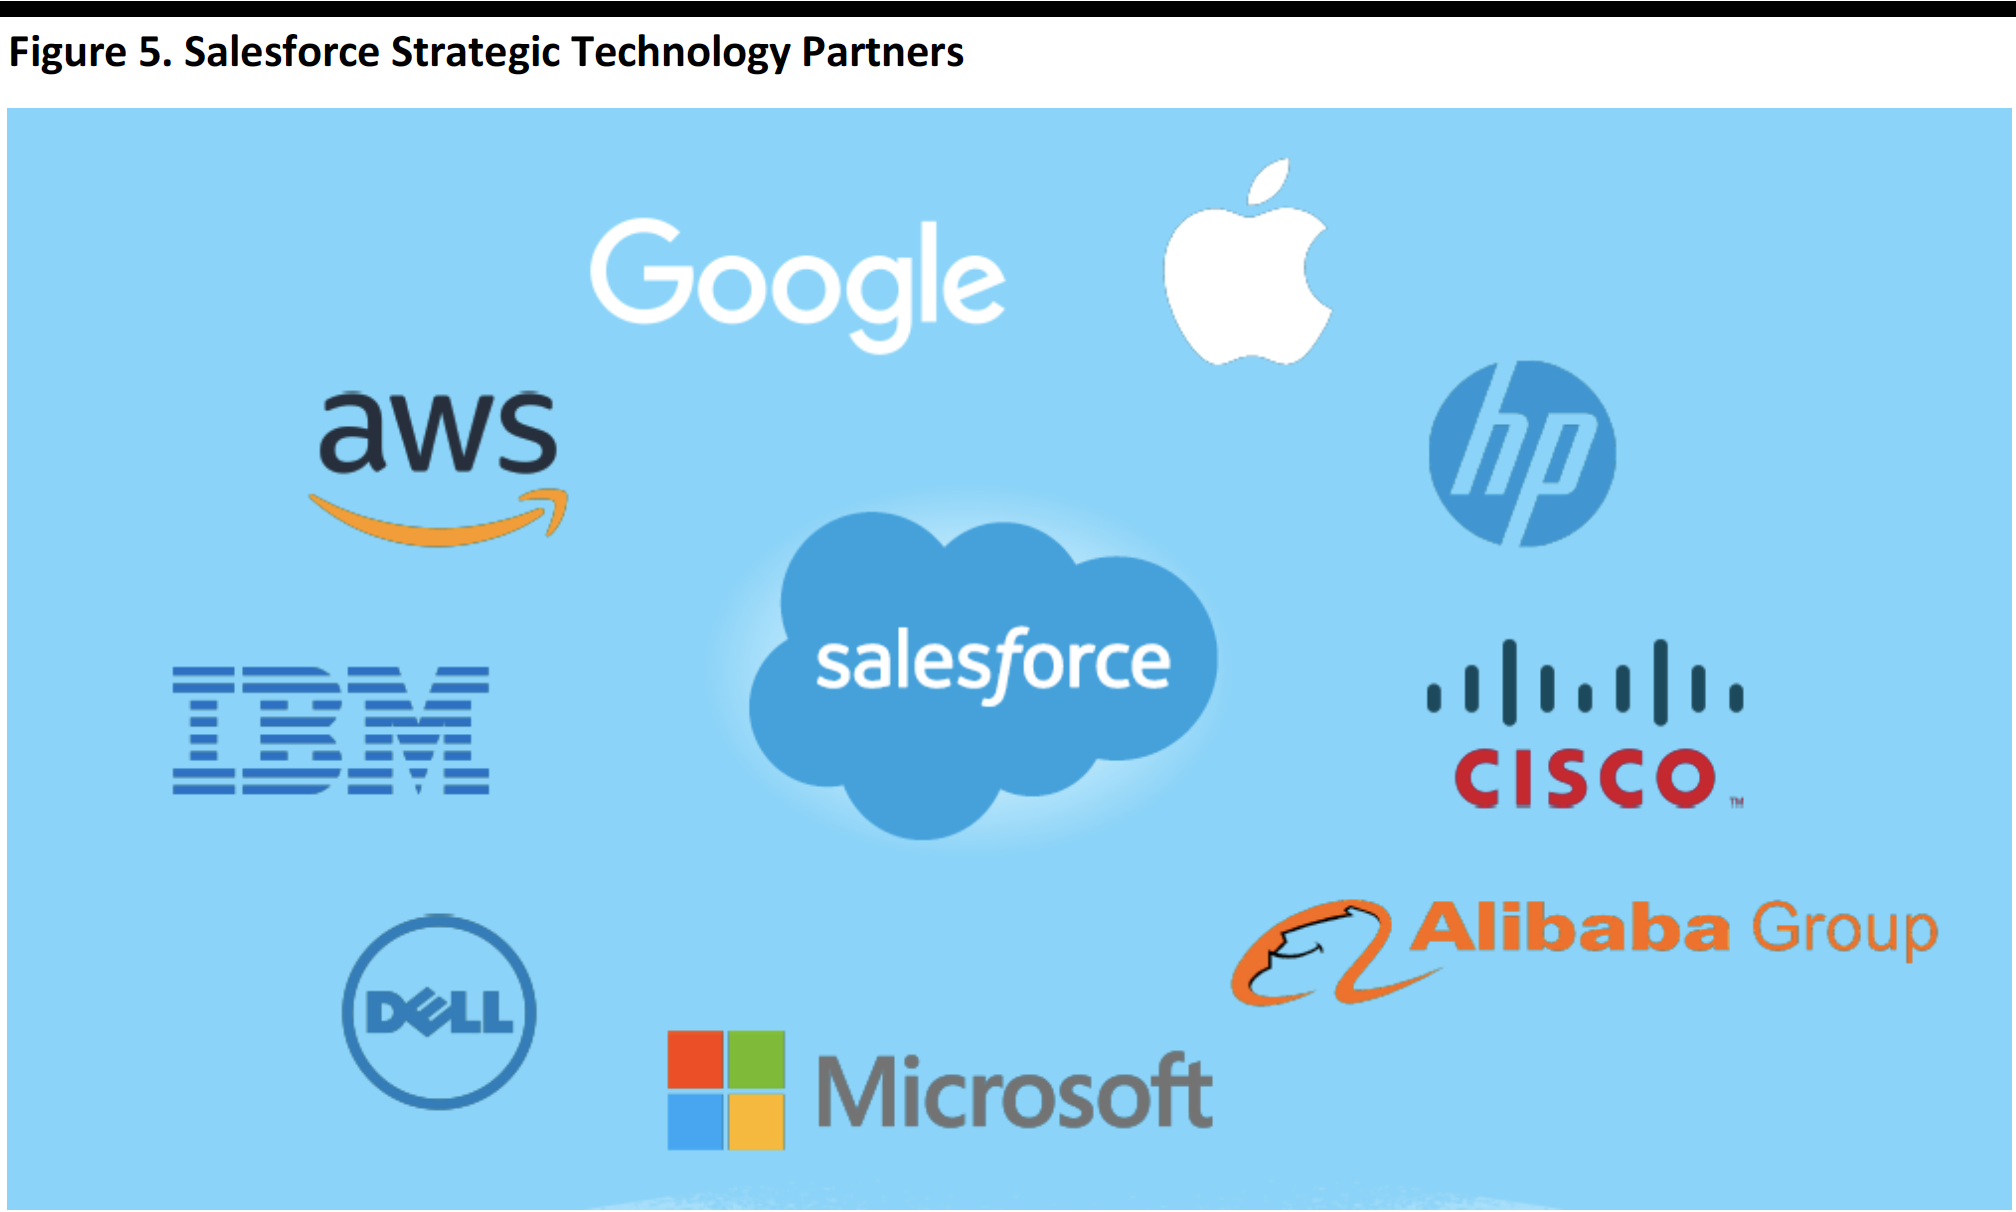 Source: Company reports[/caption]
The figure below shows how Salesforce has transitioned its customer mix into high-growth categories.
[caption id="attachment_100408" align="aligncenter" width="700"]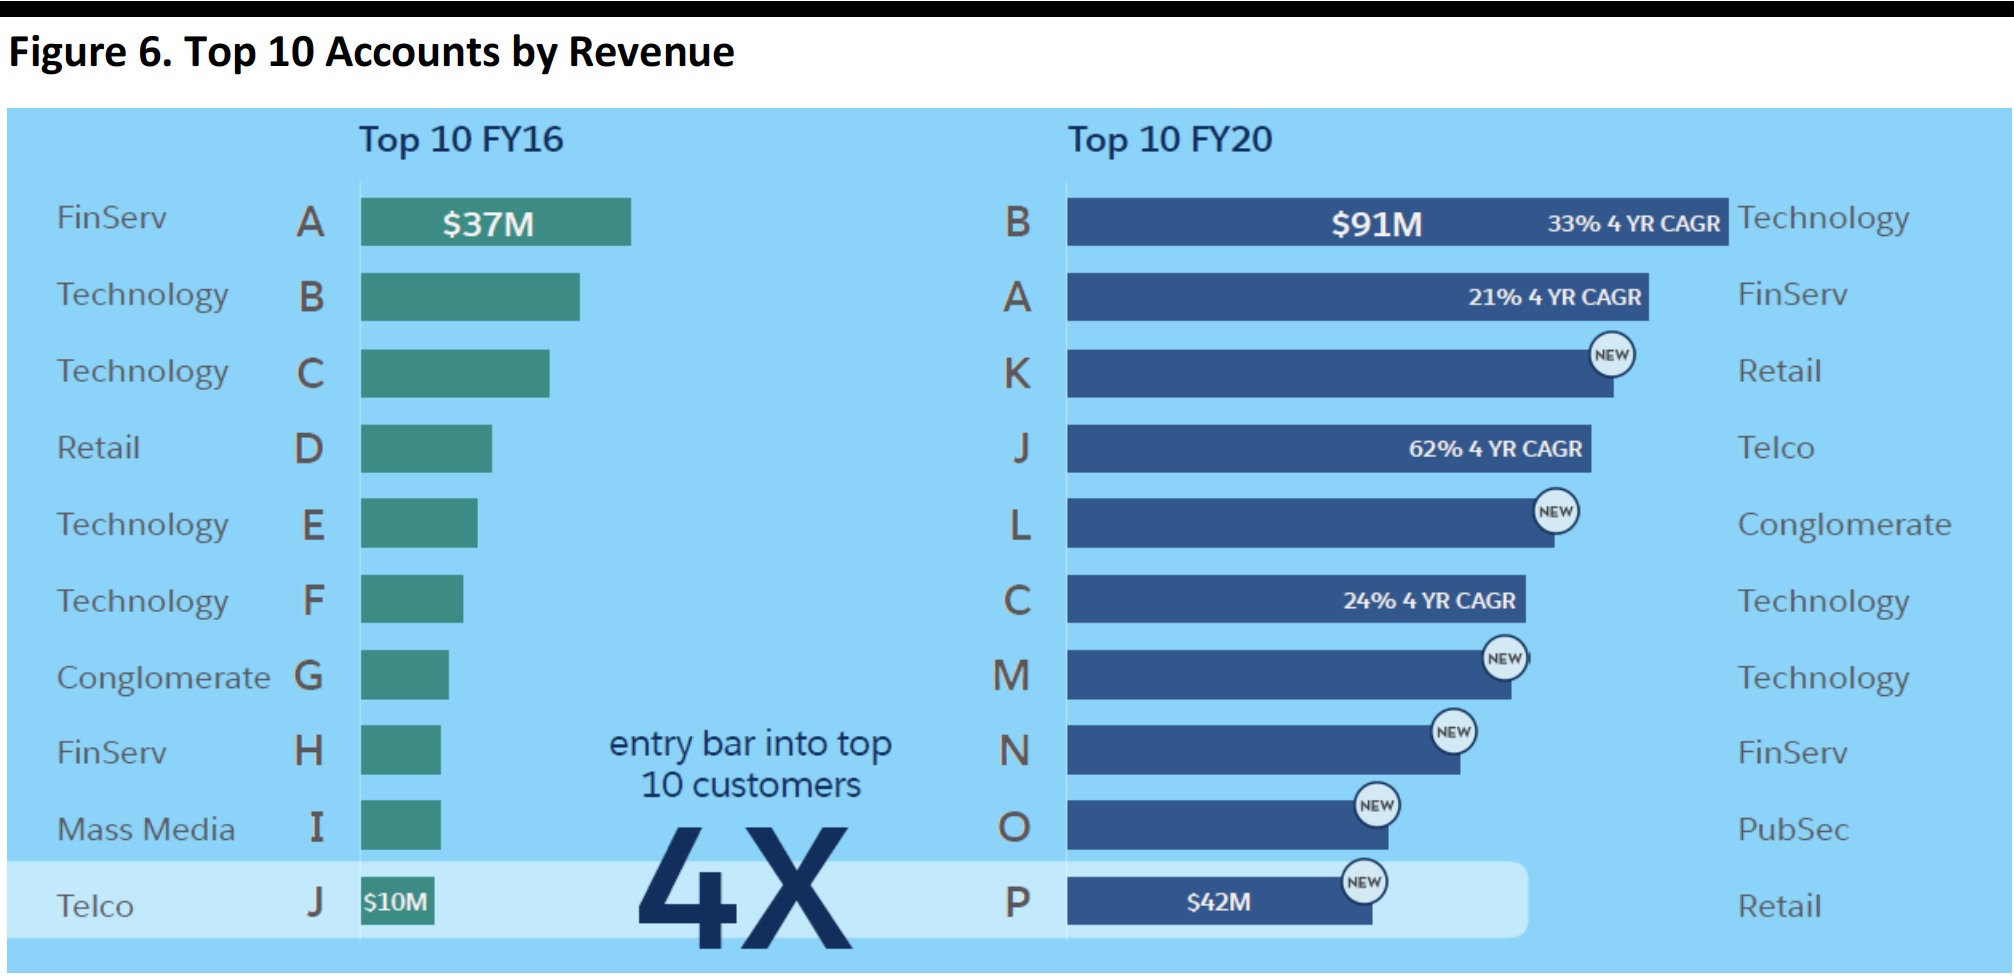 Source: Company reports[/caption]
Geographies
Finally, Salesforce has grown international revenue contribution from 29% in FY16 to 34% in FY20.
Innovation
Salesforce claims to offer a more complete product portfolio for its customers, including organic and acquired platforms.
[caption id="attachment_100409" align="aligncenter" width="700"]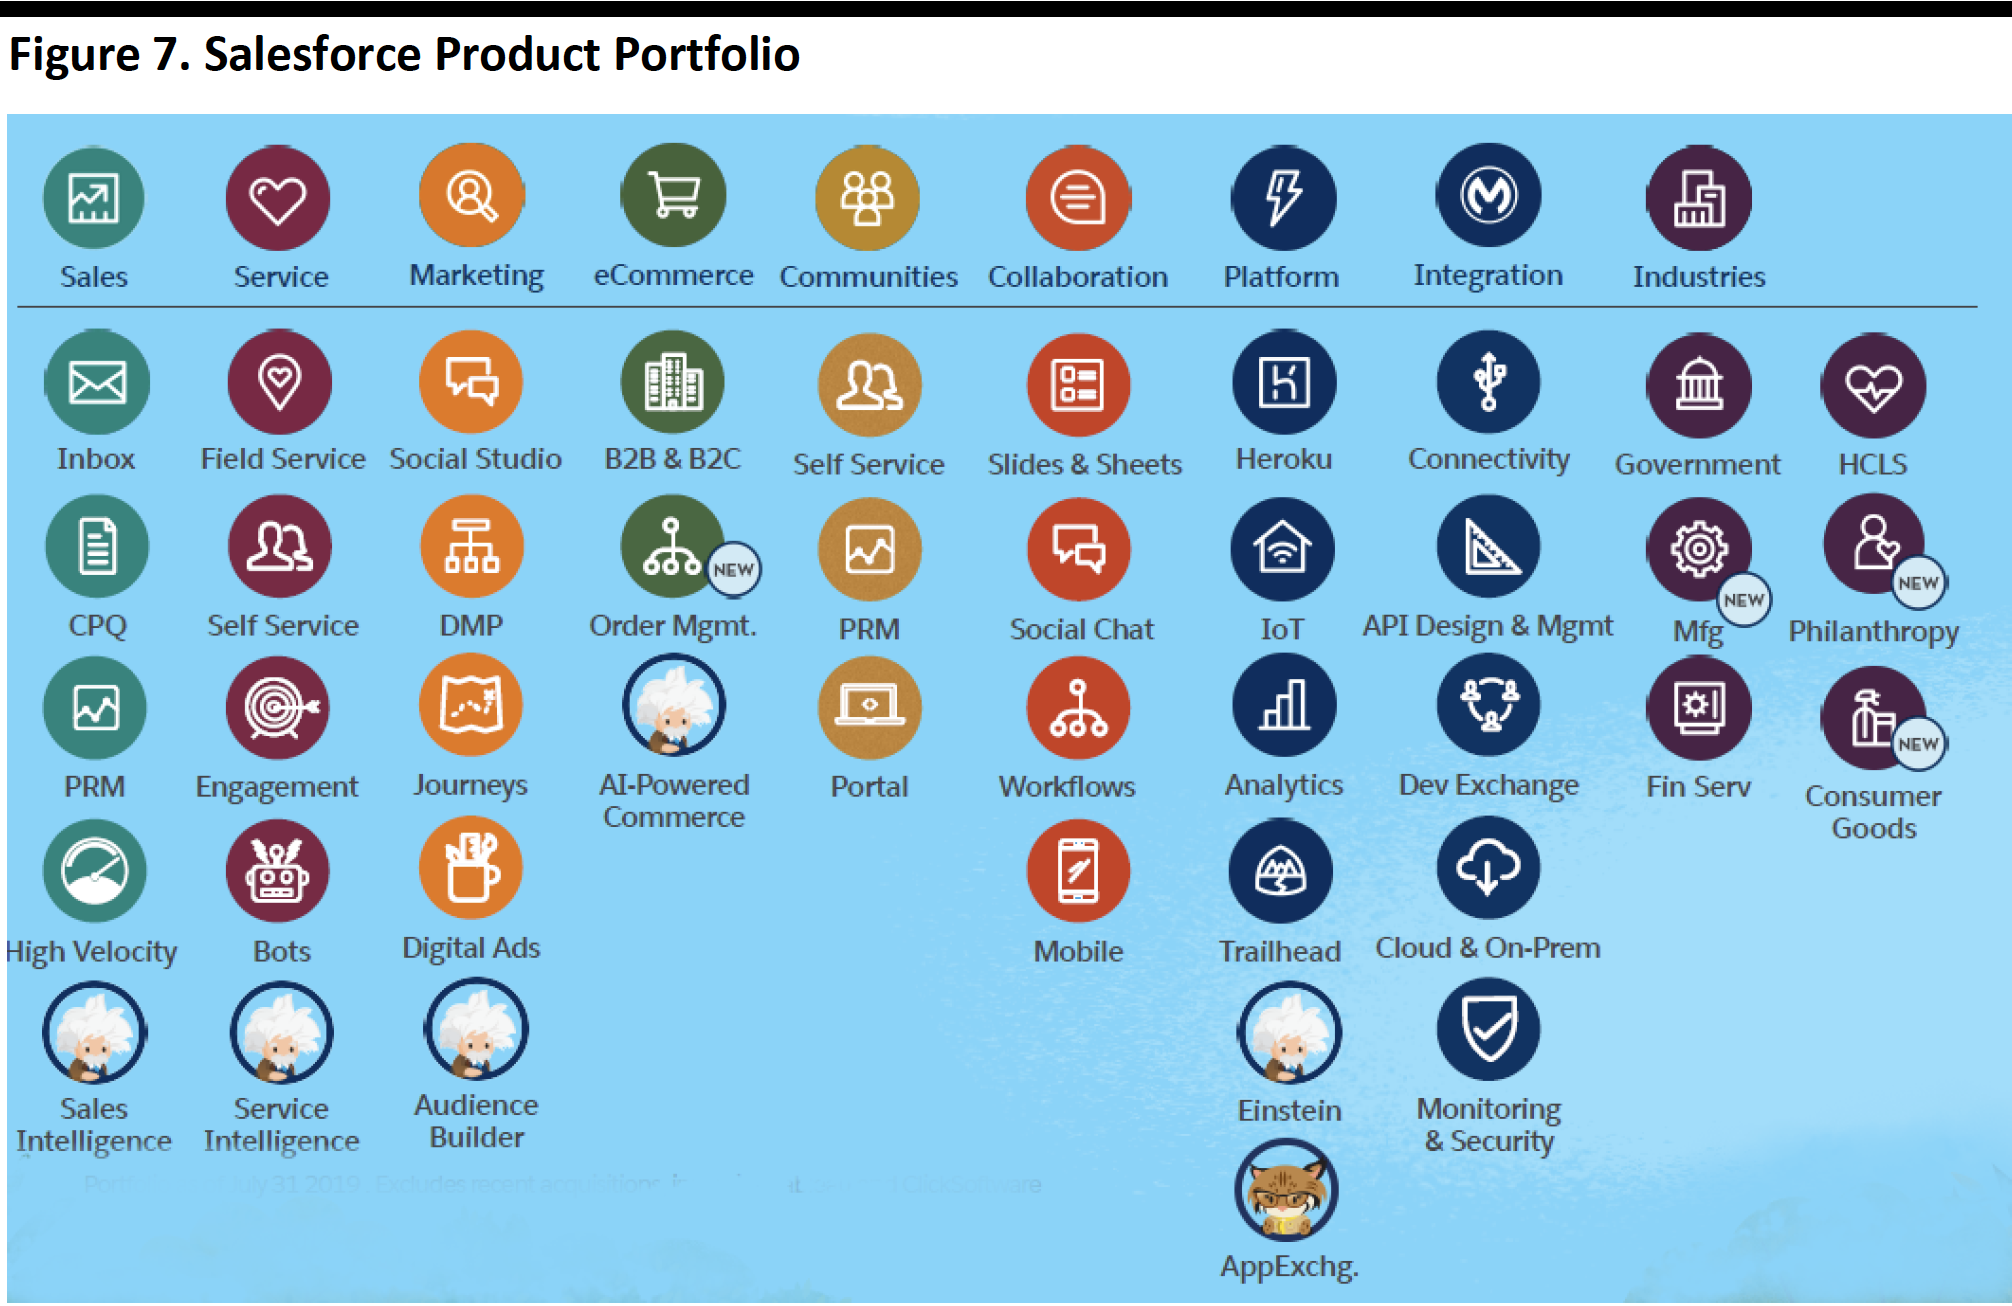 Note: Portfolio as of July 31, 2019. Excludes recent acquisitions, including Tableau and ClickSoftware
Source: Company reports[/caption]
Management laid out its acquisition criteria and explained the rationale for and financial impact of three selected acquisitions.
[caption id="attachment_100411" align="aligncenter" width="700"]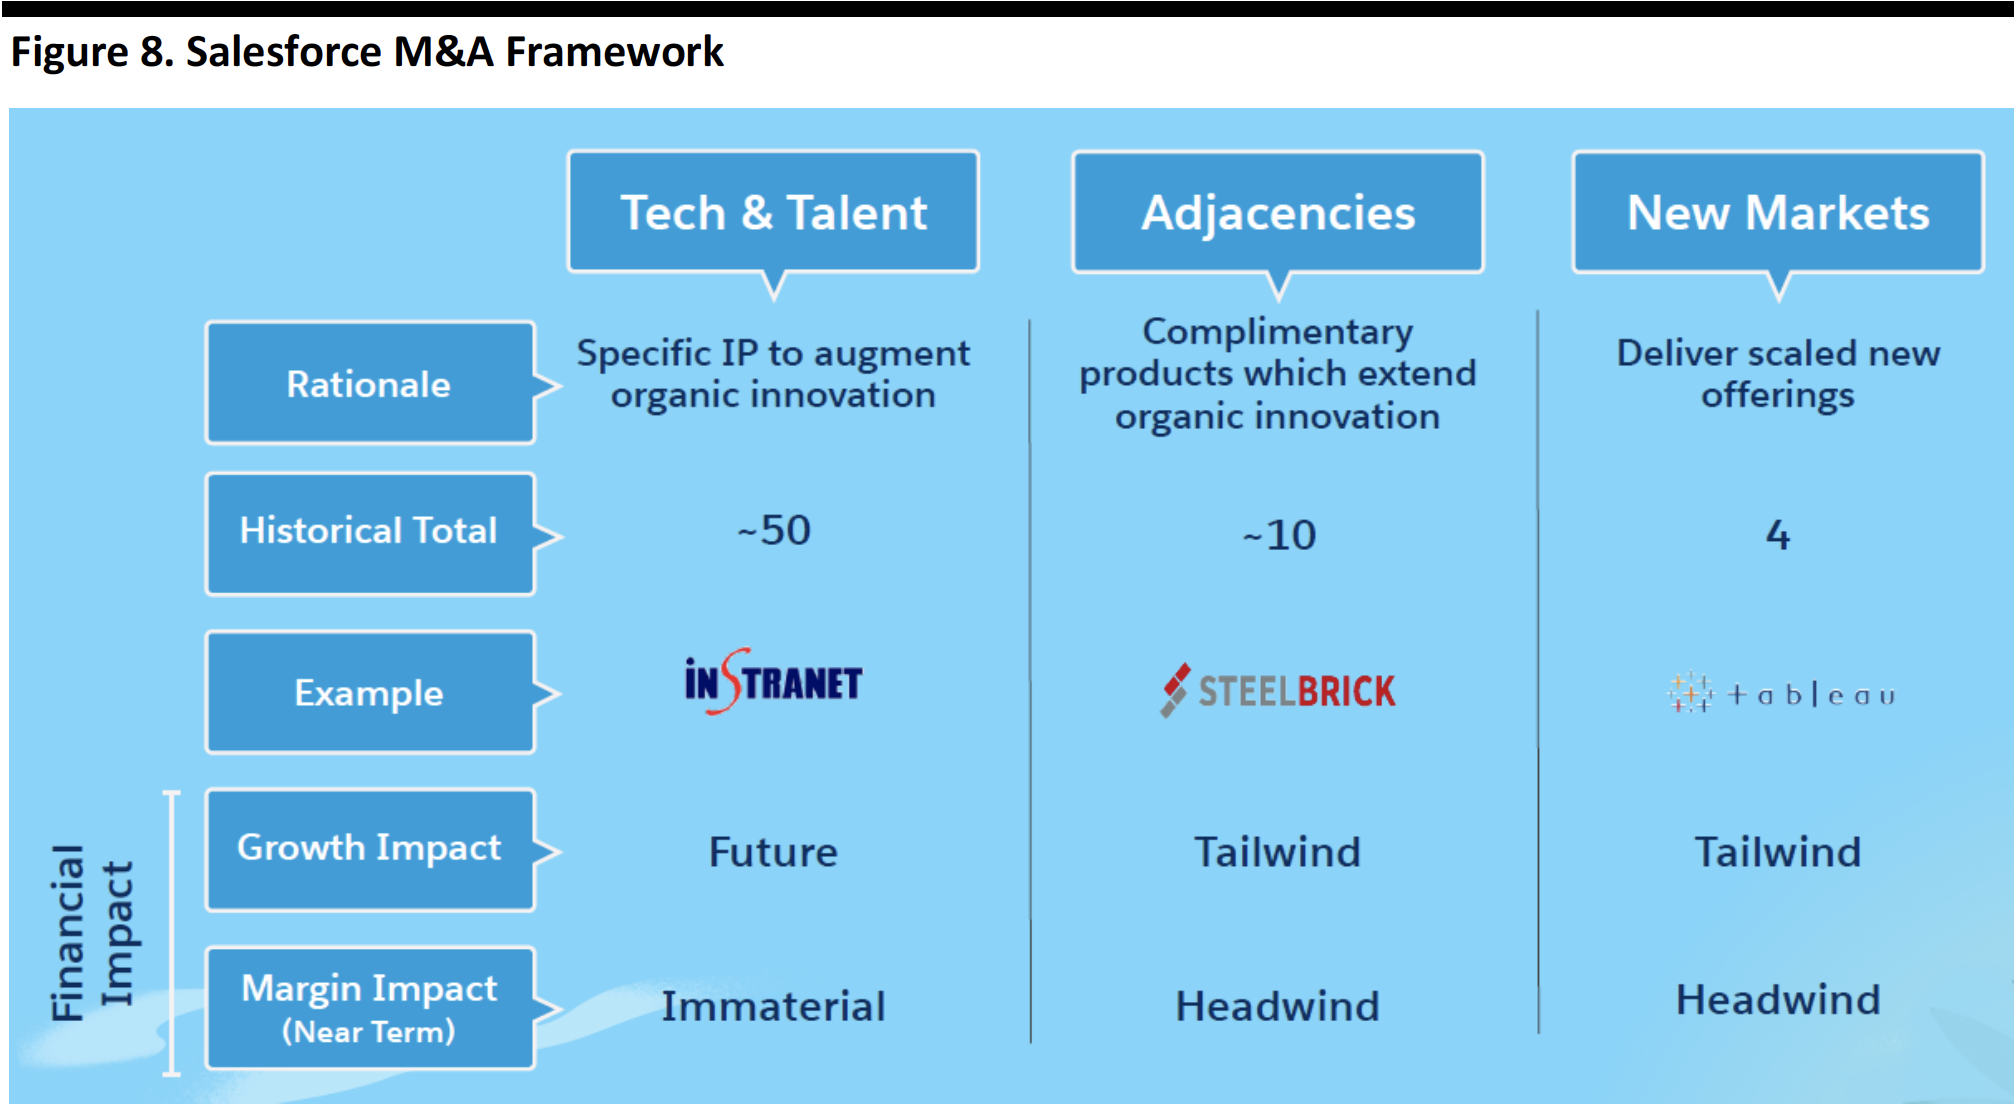 Source: Company reports[/caption]
The figure below shows where acquisitions fit in Salesforce’s product portfolio.
[caption id="attachment_100412" align="aligncenter" width="700"]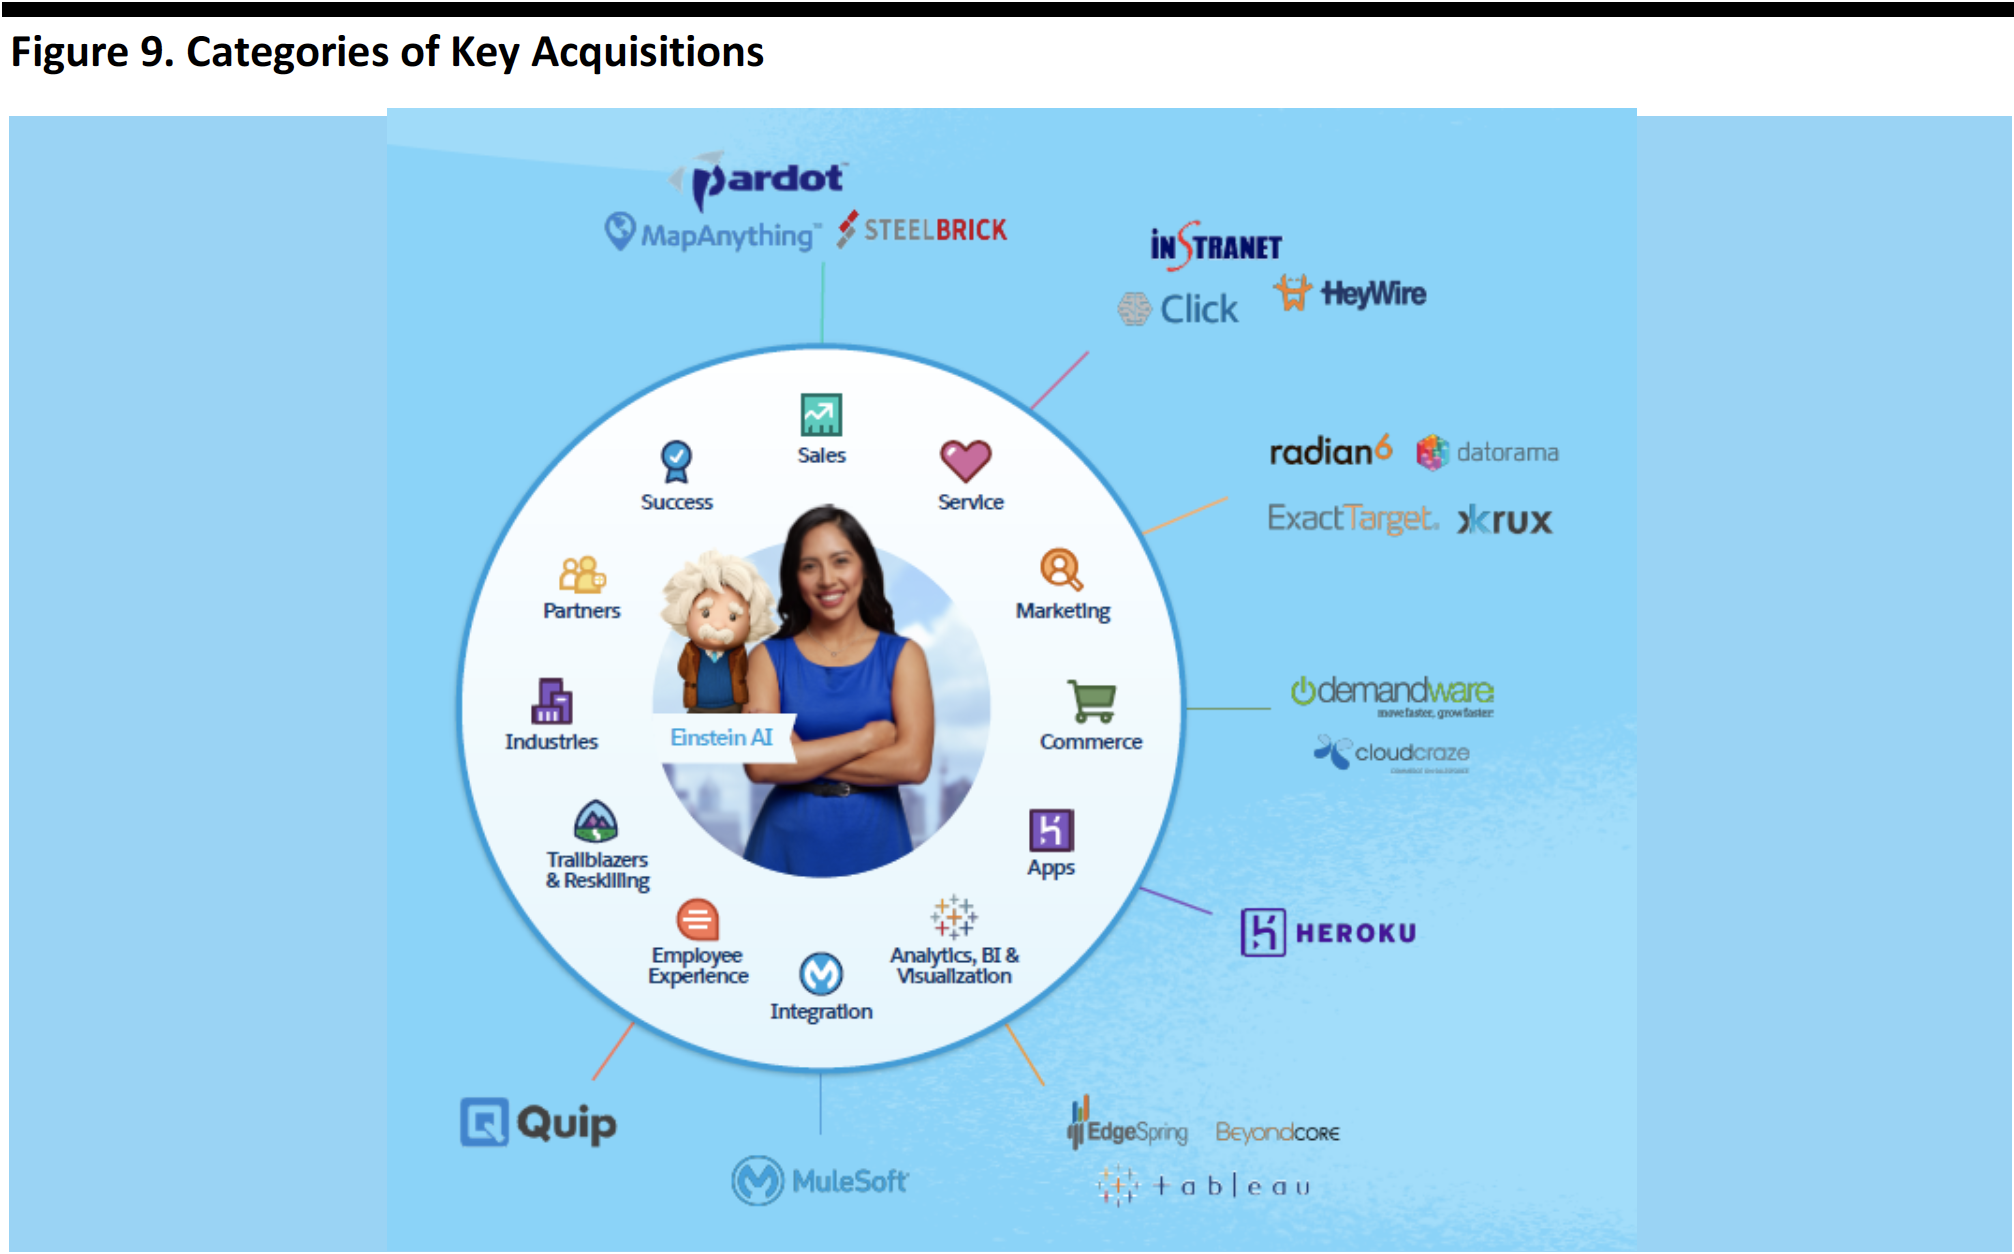 Source: Company reports[/caption]
Margins and Cash
Salesforce SVP of Investor Relations John Cummings offered investors a tutorial on unit economic margins.
The company defines unit economic value as: revenue – (cost to serve $1 over the economic lifetime) – (cost to book $1 of recurring revenue) x (attrition—the expected life of $1 of recurring revenue + growth rate).
The figure below breaks down unit economic margins by major product category, along with the associated growth rates.
[caption id="attachment_100413" align="aligncenter" width="700"]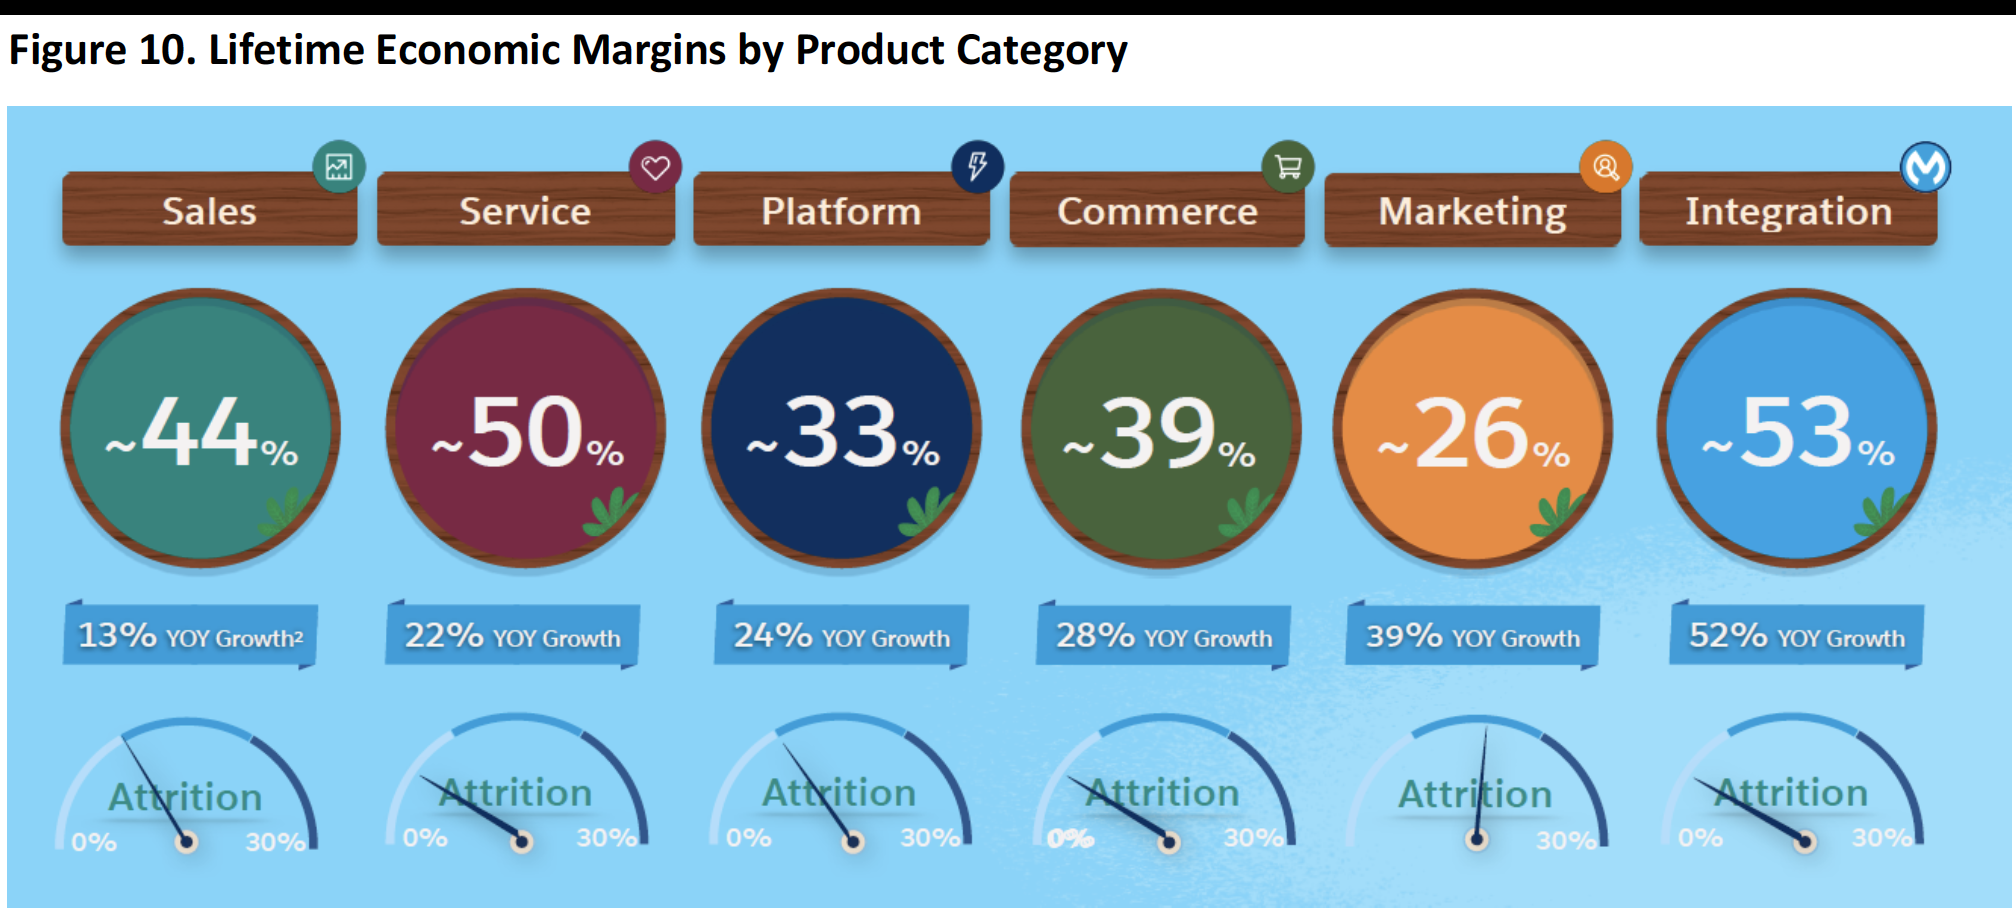 Source: Company reports[/caption]
Finally, Salesforce expects an expansion of adjusted operating margins in FY21, with organic margin improvement partially offset by a tailwind from the acquisition of salesforce.org and prior-year acquisitions, as depicted below.
[caption id="attachment_100414" align="aligncenter" width="700"]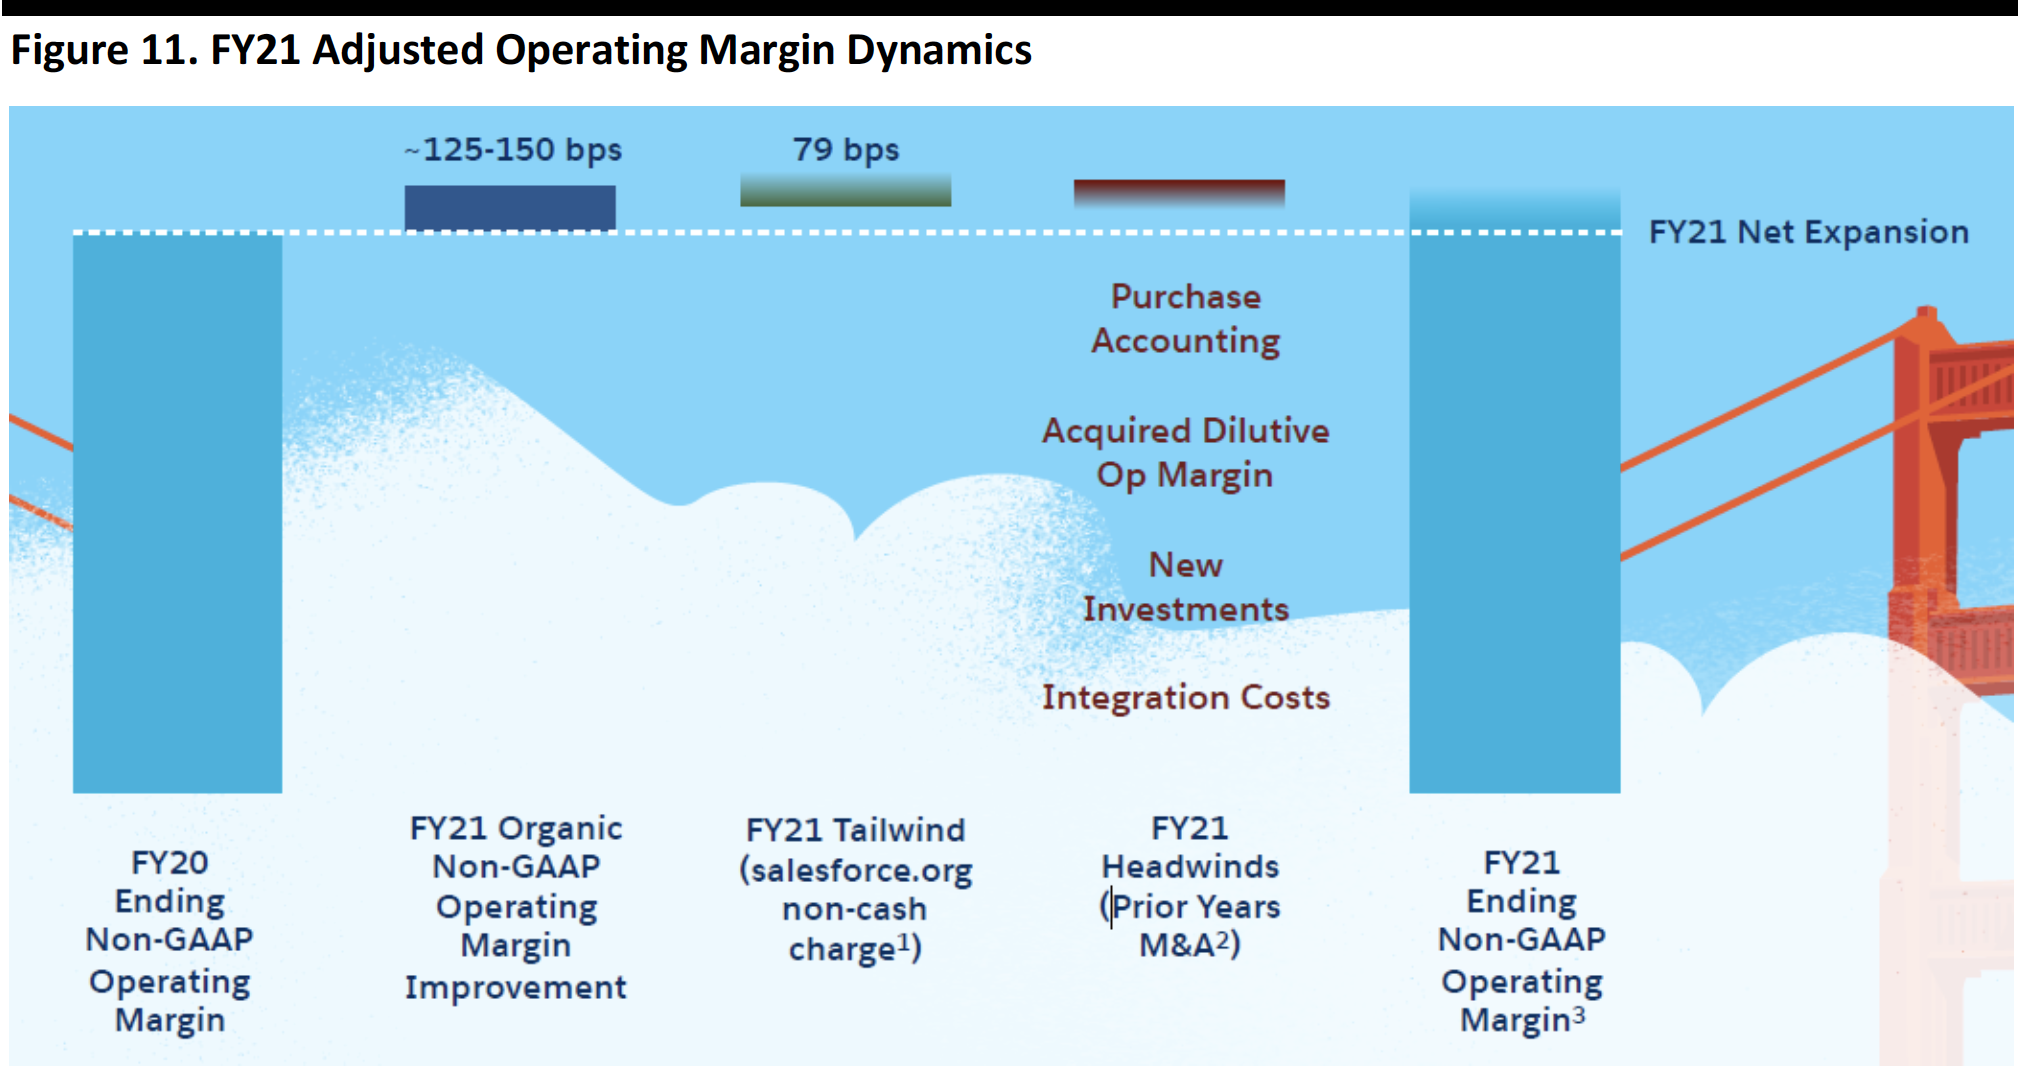 Source: Company reports[/caption]