
DIpil Das
Introduction
Although tech capital spending is essential for retailers to provide positive customer expenses, it is also a use of cash; retailers can turn off capital spending rapidly in order to preserve cash, and many have disclosed their intention to do so. In this report, we analyze retailer capital spending in the US—but do not focus on retailer expenses for tech services such as cloud computing, system integration and other IT services—and consider whether trends from the GFC of 2007–2009 indicate the likely pattern of capex during and after the 2020 coronavirus crisis. This report looks back to the GFC because it represents a recent major disruption to the global economy and capital spending, offering parallels with the coronavirus outbreak. We estimate that cuts in capital amounted to more than $100 billion during the GFC, starting in financial markets and spreading to the broader economy. The coronavirus pandemic has hit retailers directly, initiating sudden shutdowns in retail, travel and hospitality, which will also cause damage through the broader economy. As they are unable to generate in-store revenue due to forced store closures, many retailers are now heading towards bankruptcy filings. For this reason, the capex decline due to the current crisis is likely to be much larger than the 33% decline during the GFC, particularly as stores remained open during the GFC. As capex can be turned off, it can be turned back on again. Although capex declined for three successive years during the GFC (2007–2009), capex growth exceeded 10% for two of the following three years (2010–2012) and grew at average or better rates during 2010–2015, returning to pre-GFC levels. The appendix of this report examines the capital spending of six major US retailers—JCPenney, Kohl’s, Nordstrom, Target and Walmart—which disclose the tech and non-tech components of their capital spending. It also looks at spending excluding Walmart, whose capex exceeds the total of the other retailers combined. This report forms part of our RetailTech series, which examines themes, trends and companies in the retail-technology space.Retail Capex Is Likely Headed Sharply Downward in 2020
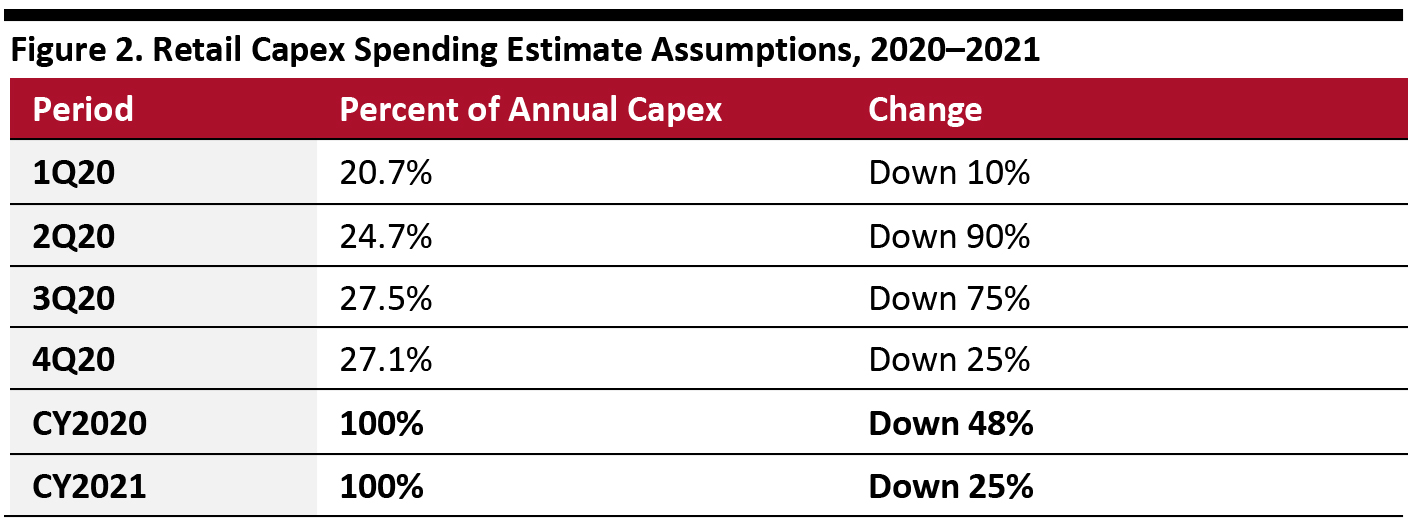
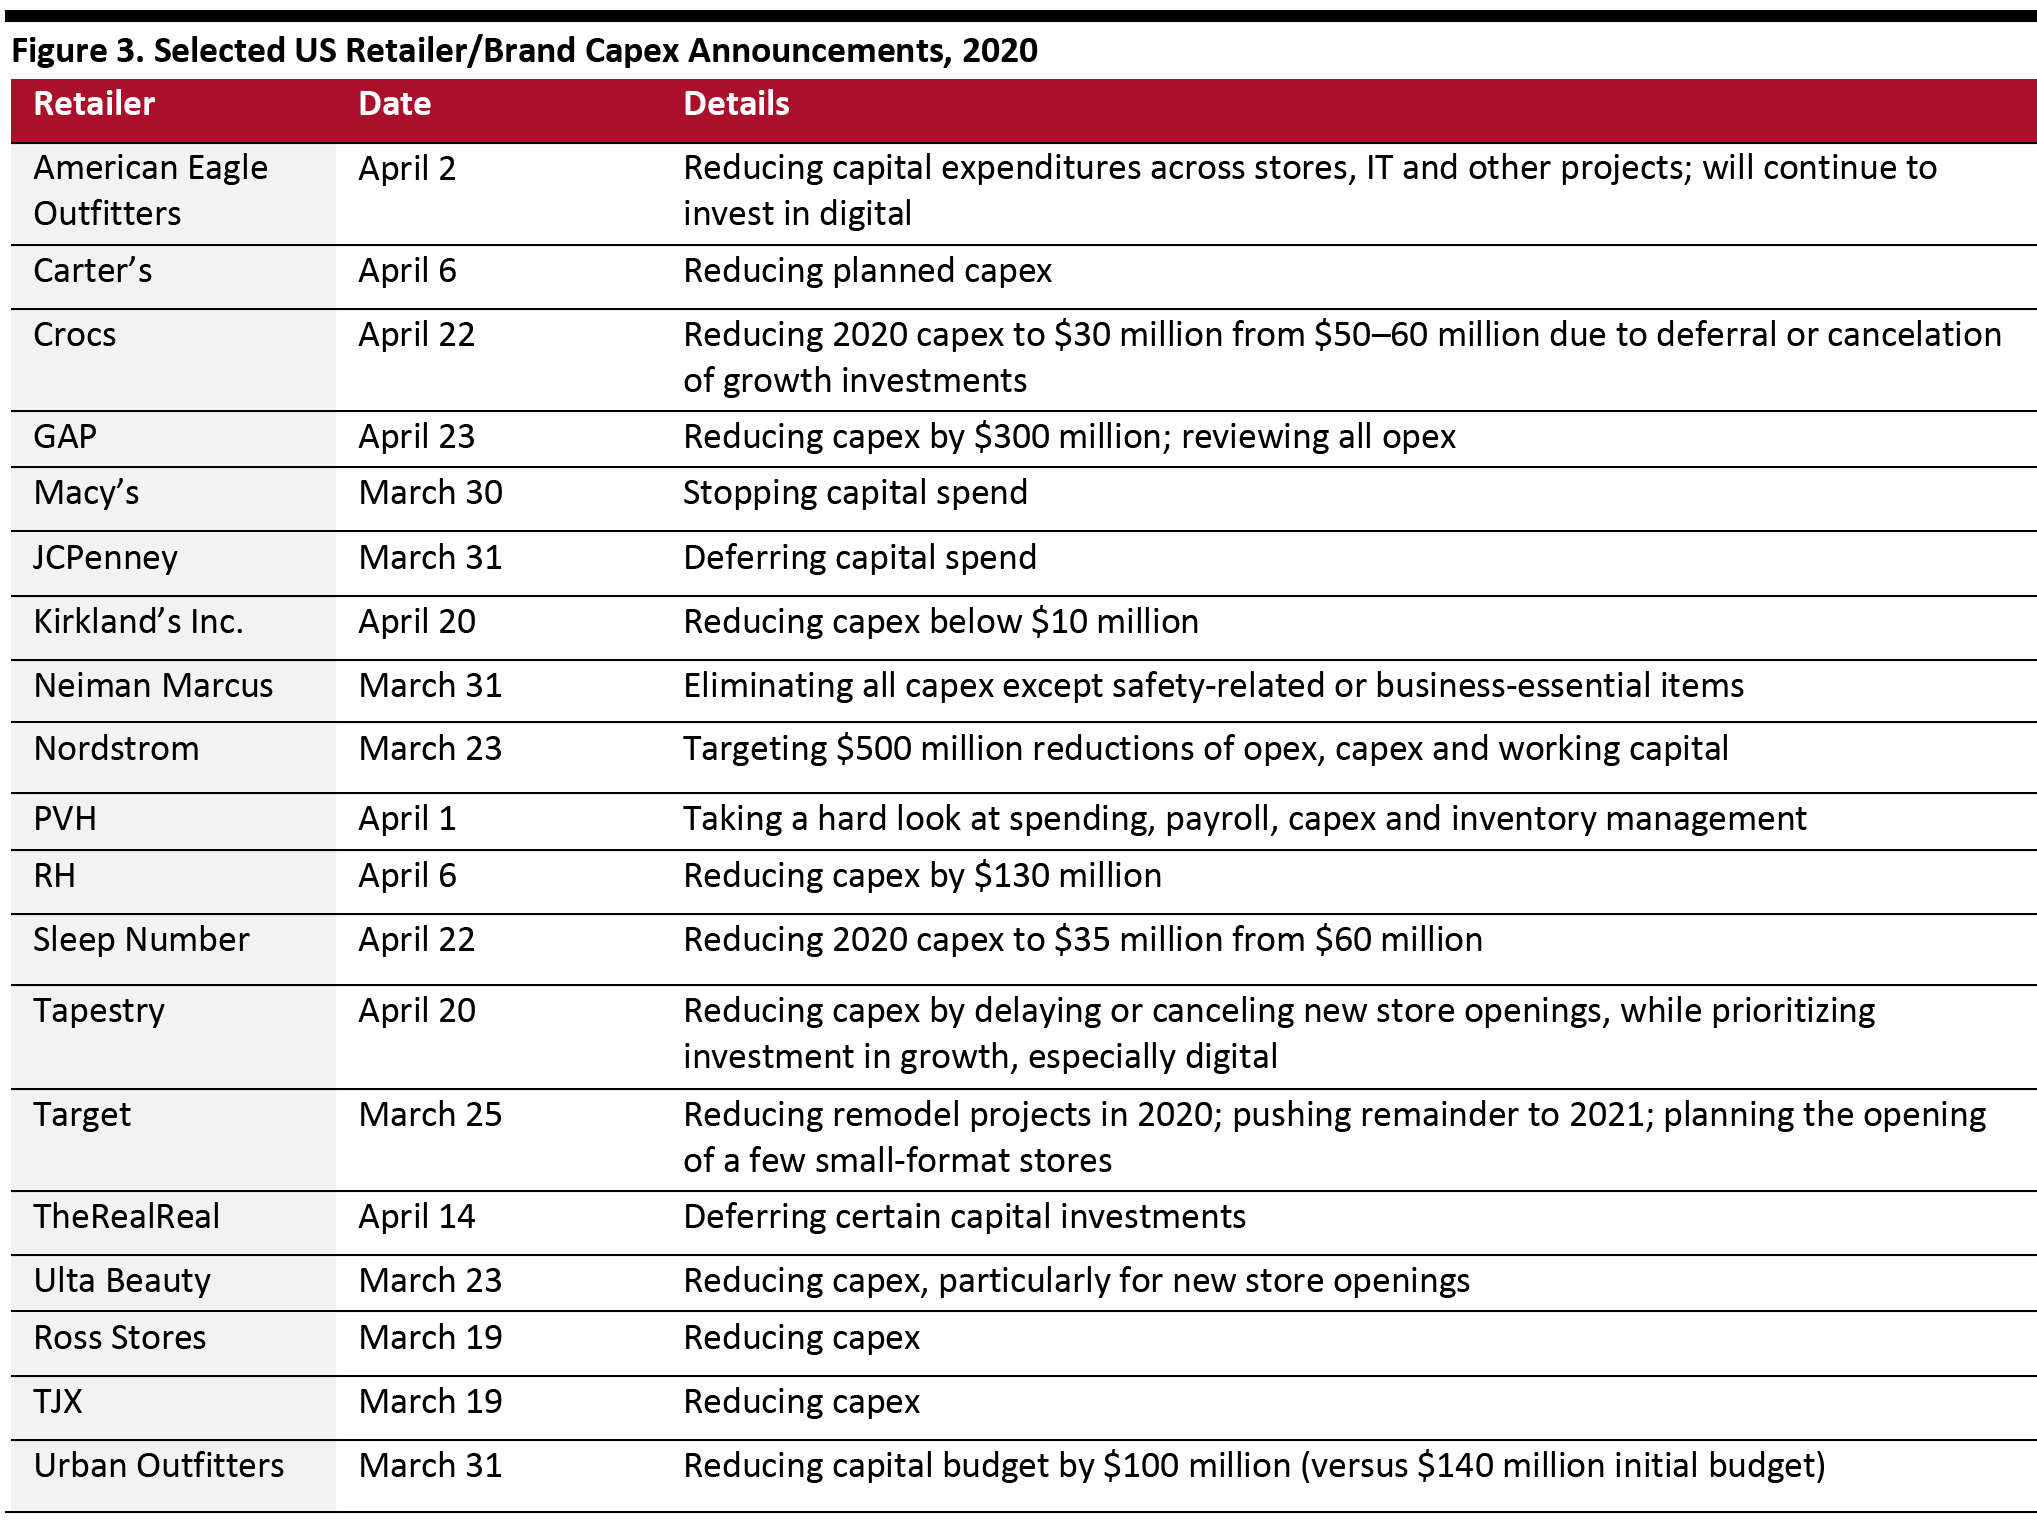
As of the time of the writing of this report, many retail stores in the US remain closed, and employees have been furloughed due to the global outbreak of the coronavirus. A number of retailers have drawn on their revolving credit lines and have specifically announced that they are canceling or postponing capital spending, or even stopping it outright in the case of department-store chain Macy’s. That major retailers are reducing capital spending in order to preserve cash does not bode well for spending in general. This is particularly true in the case of technology investment, which is considered very important in elevating the consumer experience but unfortunately represents a lower priority than survival for retailers at this time. We estimate that retail capex in the US could decline by 48% in 2020—and by another 25% in 2021, as there will be fewer retailers in existence and the operations of those that survive the coronavirus crisis will be greatly impacted by the damage inflicted in 2020. These estimates depend on the timing and slope of a recovery in retail, which has already began in some US states but is unlikely to start until June at the earliest in New York City. Figure 1 outlines annual capex data since 2014 and estimates for 2020 and 2021—the base assumptions for which are shown in Figure 2. [caption id="attachment_108700" align="aligncenter" width="700"]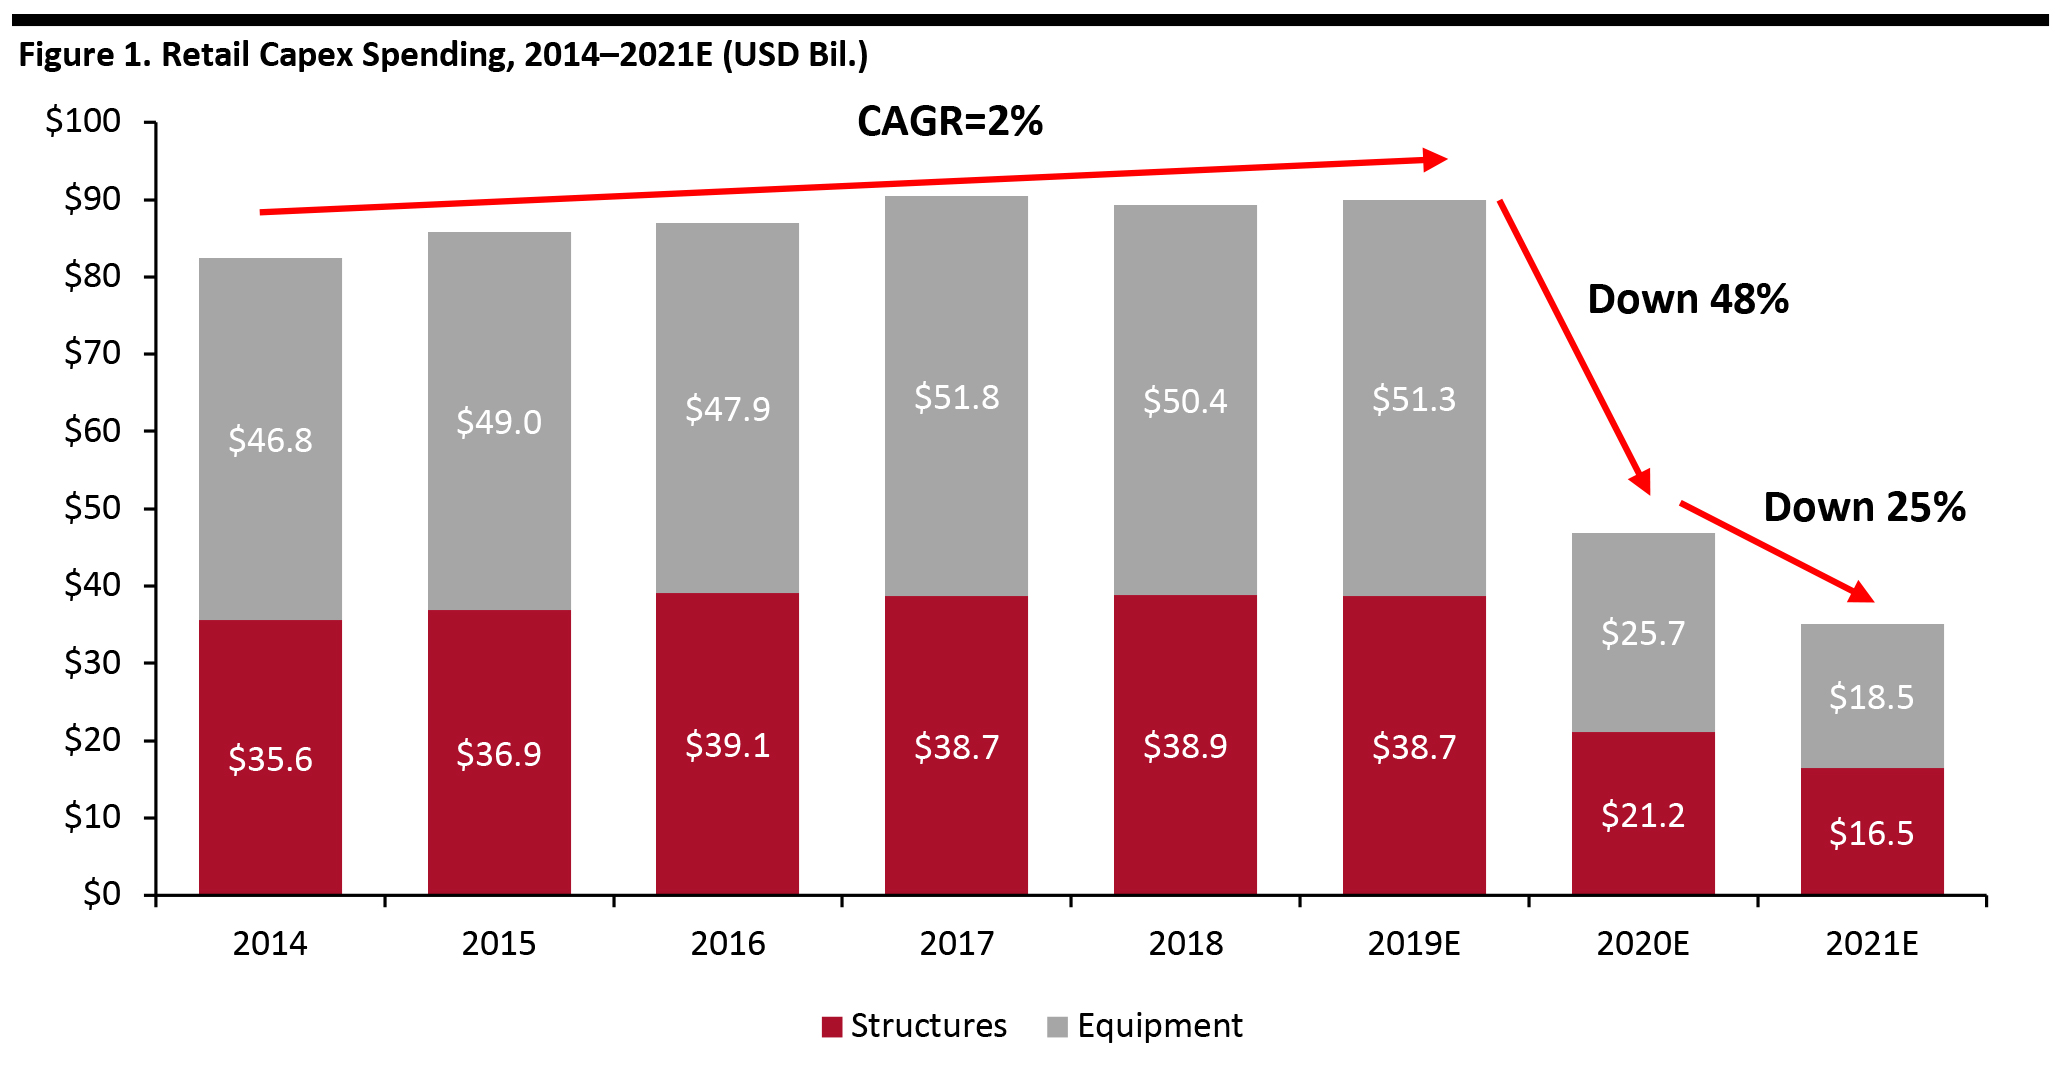 Note: Data available through 2018
 Source: US Census Bureau/Coresight Research [/caption] [caption id="attachment_108701" align="aligncenter" width="700"]
 Source: Coresight Research[/caption]
The above calculations assume that store closures happened too late in the first quarter of 2020 to affect spending but resulted in little spending activity in the second quarter. We expect stores to open in some form in the third quarter of the year—albeit to a limited extent—with some ability to spend returning in the fourth quarter. We estimate that spending on equipment will fall less rapidly than on structures, due to retailers embracing online channels and expanding their e-commerce presence. Our 2021 estimate uses our fourth-quarter 2020 estimate of down 25% as a baseline.
Several US retailers have already announced cuts to capex, opex (operating expenses) and other financial items. Selected announcements are shown in Figure 3.
Source: Coresight Research[/caption]
The above calculations assume that store closures happened too late in the first quarter of 2020 to affect spending but resulted in little spending activity in the second quarter. We expect stores to open in some form in the third quarter of the year—albeit to a limited extent—with some ability to spend returning in the fourth quarter. We estimate that spending on equipment will fall less rapidly than on structures, due to retailers embracing online channels and expanding their e-commerce presence. Our 2021 estimate uses our fourth-quarter 2020 estimate of down 25% as a baseline.
Several US retailers have already announced cuts to capex, opex (operating expenses) and other financial items. Selected announcements are shown in Figure 3.
 Source: Company reports
Comparison of Coronavirus Outbreak to the GFC
There are several significant similarities and differences between the effects and trajectory of the coronavirus pandemic and the GFC, the most recent broad-based economic shock for which data is readily available. The GFC was characterized by a shock arising from the financial and housing markets, which spread into the broader economy, including retail. The rationale for analyzing this data is to explore how severely retail capex can be pulled back due to an external shock. We compare the similarities and differences of the two events in Figure 4. [caption id="attachment_108703" align="aligncenter" width="700"]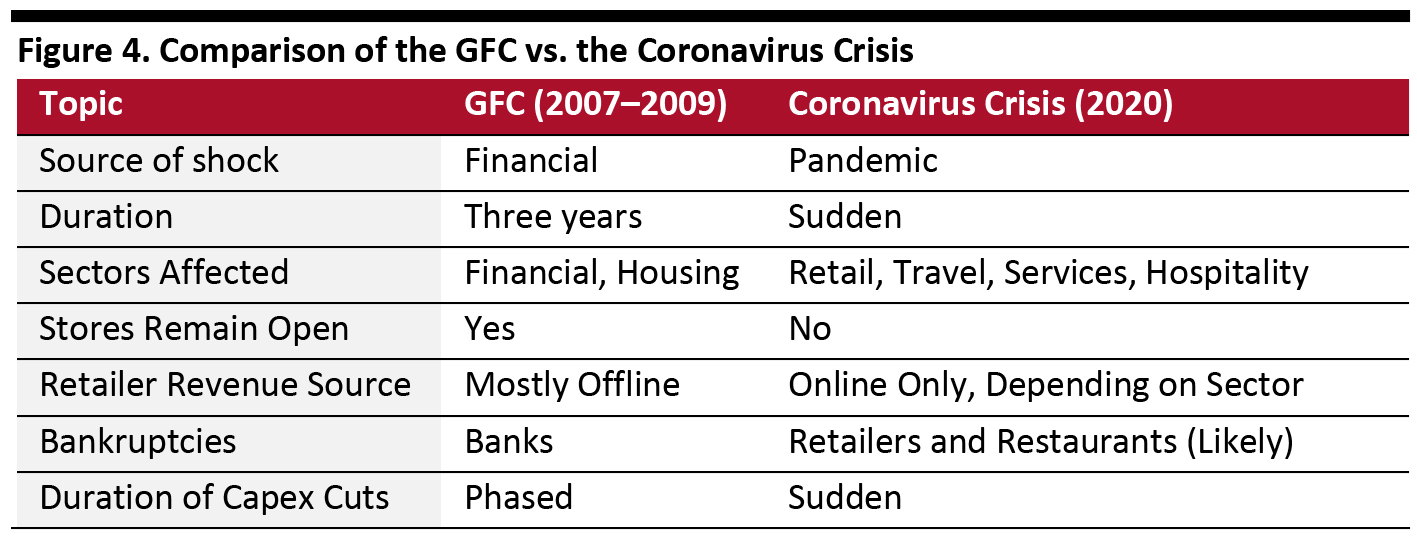 Source: Coresight Research[/caption]
Capex Trends during the GFC
Retail capex was one of the casualties of the GFC: Capex started to decline in 2007 and did not return to growth until 2010. In Figure 5, we present a timeline of key GFC events in the US along with developments in China during the same period for reference. We also include annual GDP growth for both countries, illustrating that in contrast to the US, which went into recession during the GFC, China only experienced a slowdown, with its GDP growing less than 10% for two successive years. [caption id="attachment_108704" align="aligncenter" width="700"]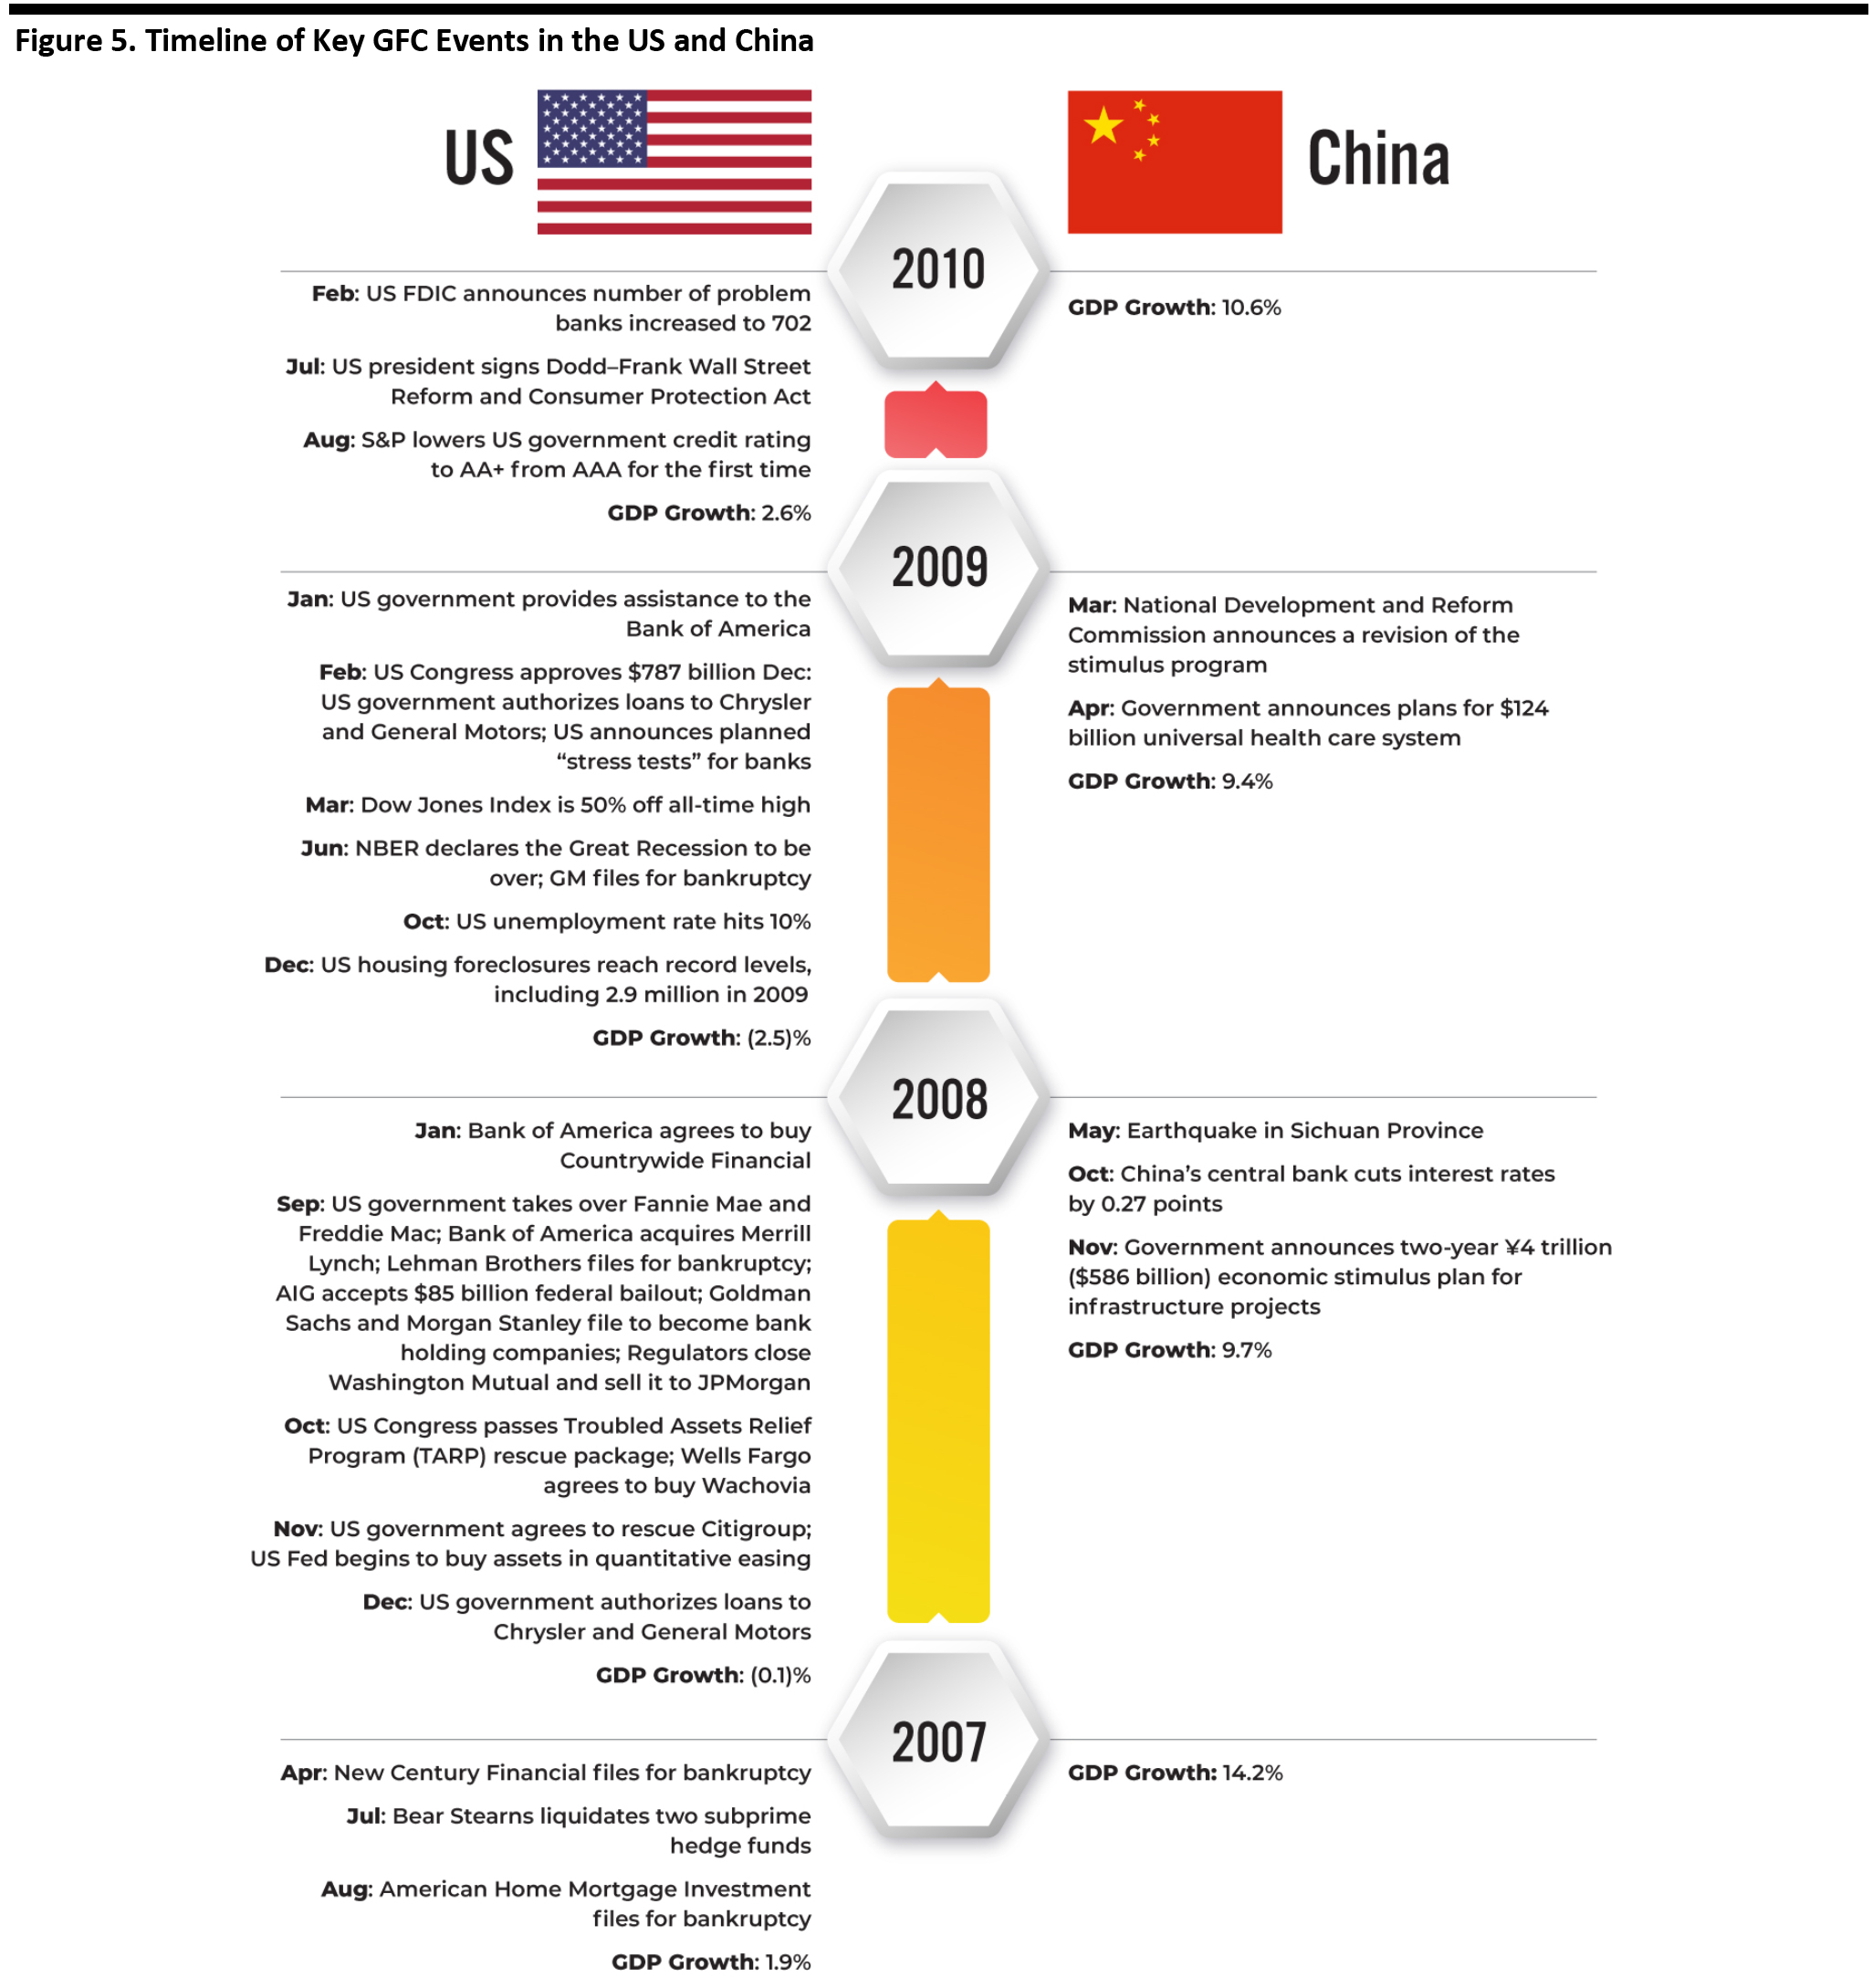 Source: Coresight Research/World Bank [/caption]
Looking at changes in US retailer capex surrounding the GFC, we see that capex declined in 2007, and declines grew successively deeper in 2008 and 2009 (see Figure 6). We calculate a 33% decline in total capex from 2006 to the trough in 2019.
Capex began to rebound in 2010, and increased 33% from the trough in 2009 to a more normalized level in 2012. We note that capex for structures declined faster than for equipment in two of the three years in the 2007–2009 period.
[caption id="attachment_108705" align="aligncenter" width="700"]
Source: Coresight Research/World Bank [/caption]
Looking at changes in US retailer capex surrounding the GFC, we see that capex declined in 2007, and declines grew successively deeper in 2008 and 2009 (see Figure 6). We calculate a 33% decline in total capex from 2006 to the trough in 2019.
Capex began to rebound in 2010, and increased 33% from the trough in 2009 to a more normalized level in 2012. We note that capex for structures declined faster than for equipment in two of the three years in the 2007–2009 period.
[caption id="attachment_108705" align="aligncenter" width="700"]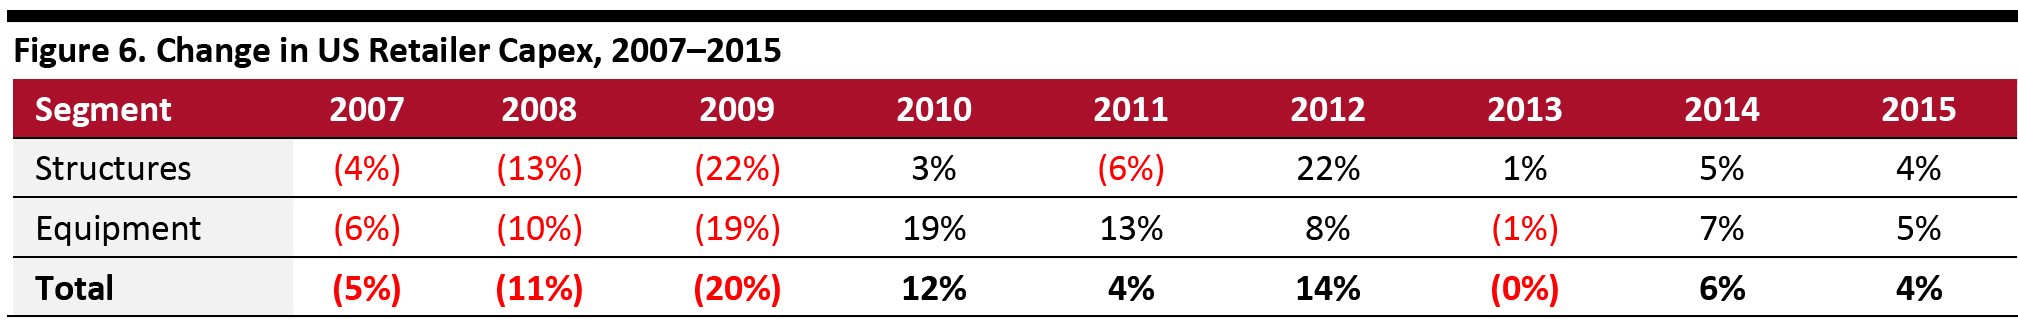 Source: US Census Bureau/Coresight Research[/caption]
In terms of “lost capex” in the US due to the GFC—which estimates capital spending that did not occur due to projects being scaled back, downsized or postponed—we calculate it as the difference between a straight line before the GFC (i.e., 2006) and when spending had returned to prior levels (i.e., 2015). We therefore estimate that lost capex totaled more than $103 billion over that period (as shown in Figure 7), the equivalent of more than a single year’s capex.
[caption id="attachment_108706" align="aligncenter" width="700"]
Source: US Census Bureau/Coresight Research[/caption]
In terms of “lost capex” in the US due to the GFC—which estimates capital spending that did not occur due to projects being scaled back, downsized or postponed—we calculate it as the difference between a straight line before the GFC (i.e., 2006) and when spending had returned to prior levels (i.e., 2015). We therefore estimate that lost capex totaled more than $103 billion over that period (as shown in Figure 7), the equivalent of more than a single year’s capex.
[caption id="attachment_108706" align="aligncenter" width="700"]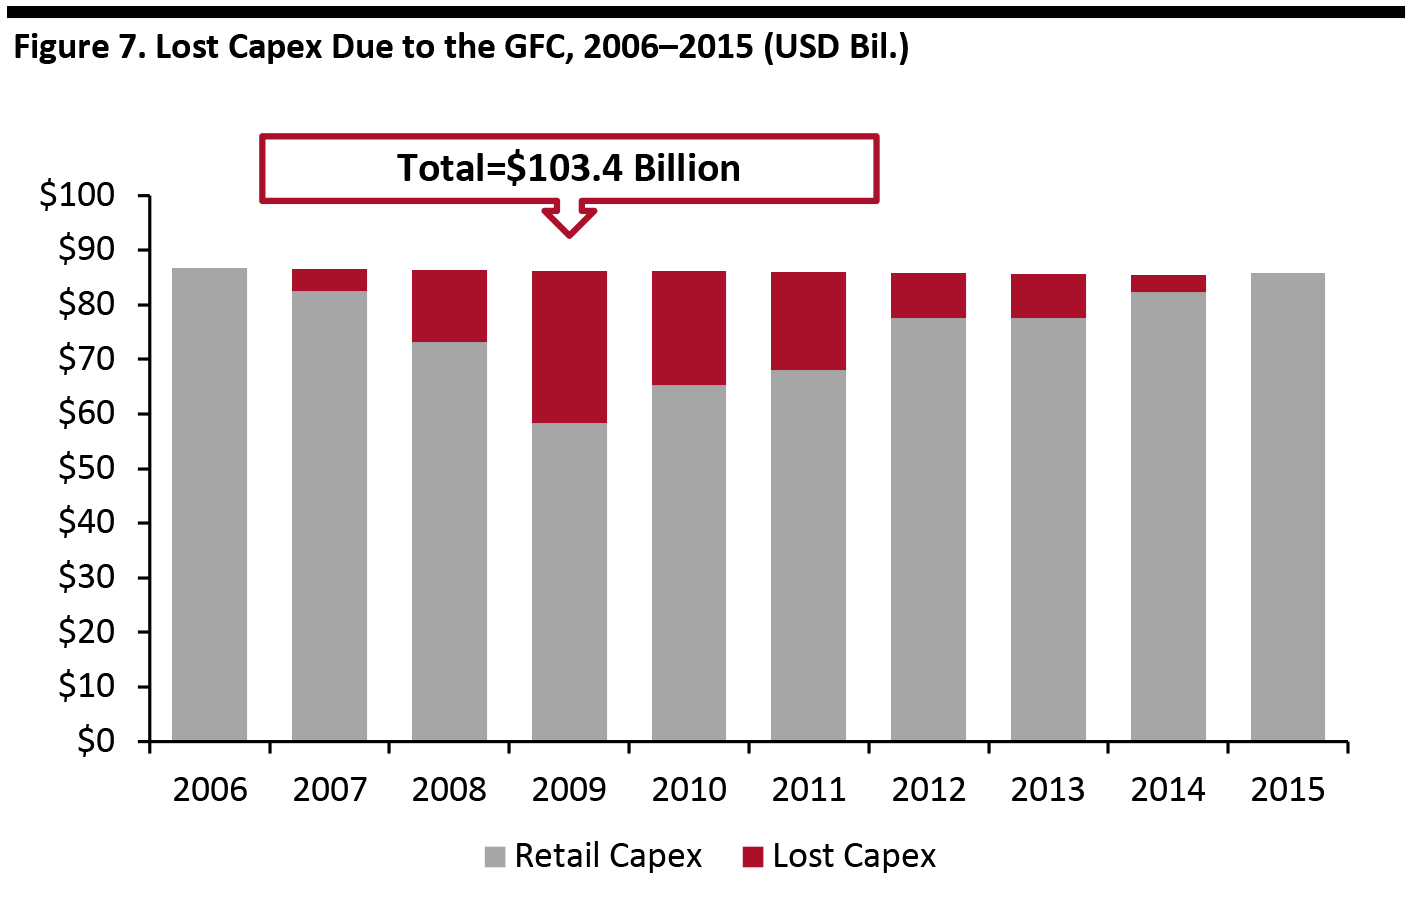 Source: US Census Bureau/Coresight Research[/caption]
Conclusion
While arising from a crisis in the housing and financial markets, the GFC caused ripples through the US and global economy, resulting in a recession in which retail capital spending declined 33% over three years. The coronavirus outbreak happened suddenly and hit retailers directly, driving many of their revenues to de minimus levels and forcing them to slash discretionary spending. The combination of lack of revenues, slashing spending to ensure survival and the elimination of capital spending through bankruptcy and liquidation could drive an even greater reduction in capex due to the coronavirus crisis than the GFC—and in a shorter time frame.Other Coresight Research
Please see our Introduction to Retail TechAppendix
Pre-Coronavirus Outlook US retail capex was on track to remain at the $90 billion level in 2020 before the outbreak of the coronavirus. Figure 8 shows US retailer capex broken down in terms of structures versus equipment for 2015–2020E prior to the current crisis. We see that capex was set to maintain its plateau at about $90 billion from 2017. Total capex was estimated to grow at a modest 1.5% CAGR during 2014–2020E, with capex for equipment growing slightly faster than for structures. [caption id="attachment_108707" align="aligncenter" width="700"]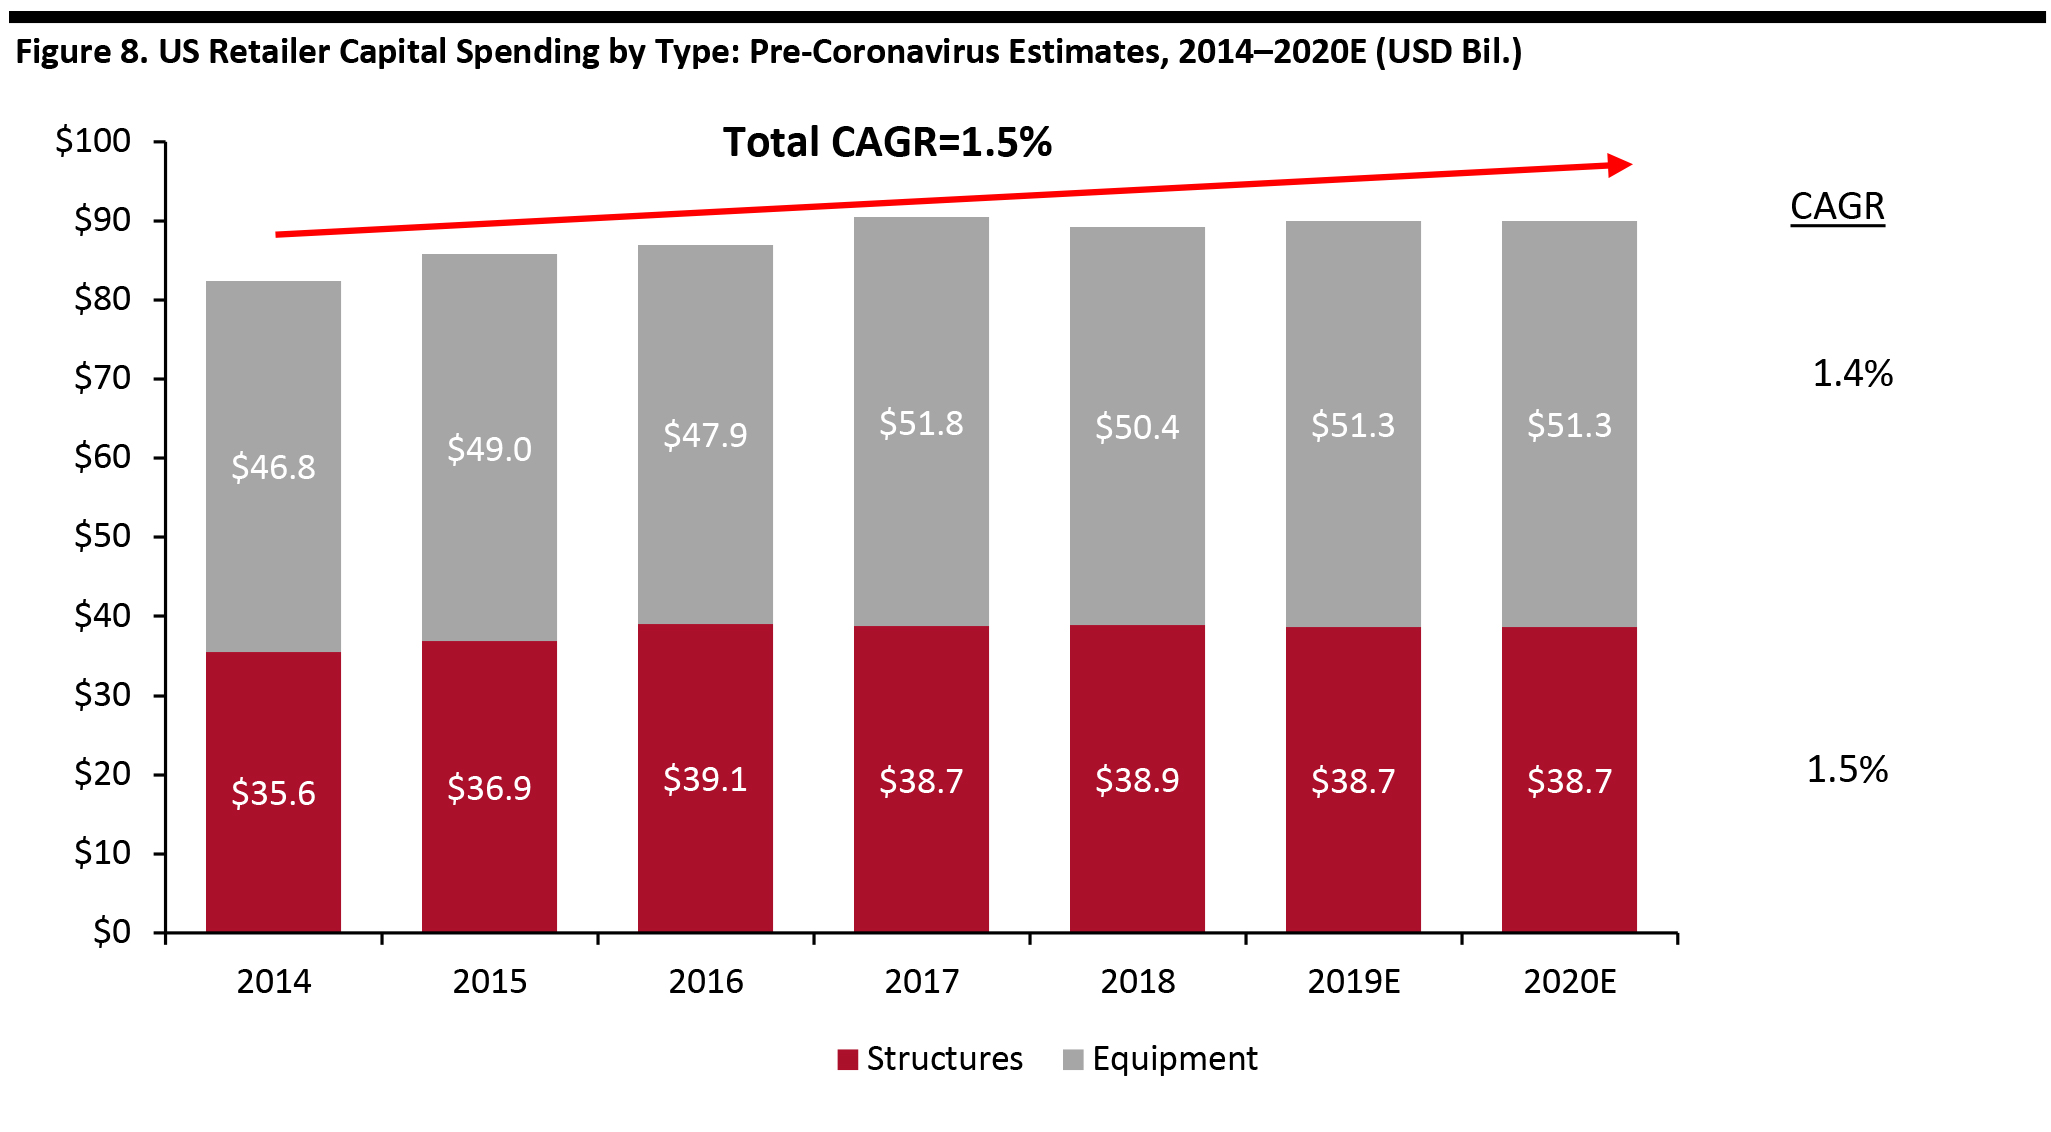 Note: Data available through 2018.
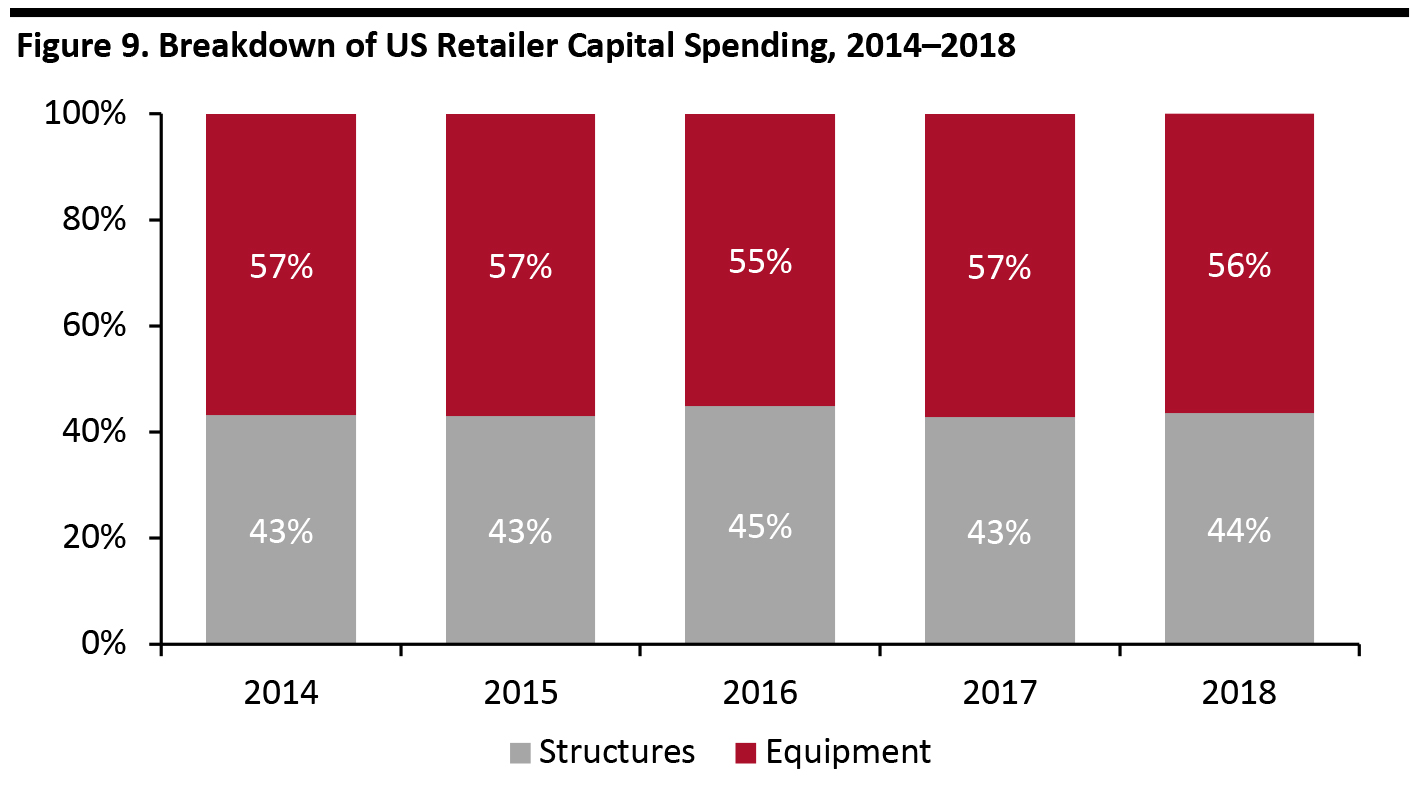
 Source: US Census Bureau/Coresight Research [/caption] Figure 9 shows the allocation between capex for structures versus equipment between 2014 and 2018 (the most recent five-year period for which data is available), with structures averaging 43% of capex over the five years and equipment averaging 57%. [caption id="attachment_108708" align="aligncenter" width="700"]
 Source: US Census Bureau/Coresight Research[/caption]
Capex Analysis for Selected Retailers
We analyze tech and non-tech capex for six leading US retailers—JCPenney, Kohl’s, Nordstrom, Target, TJX and Walmart—which break down their $17 billion in total capital spending. The growth rate in these retailers’ capex exceeds that of the overall industry, and their tech capex growth exceeds that of non-tech capex.
Figure 10 shows 2019 and 2020E capex for these retailers. We can see that Walmart’s capital spending dominates that of its peers.
[caption id="attachment_108709" align="aligncenter" width="700"]
Source: US Census Bureau/Coresight Research[/caption]
Capex Analysis for Selected Retailers
We analyze tech and non-tech capex for six leading US retailers—JCPenney, Kohl’s, Nordstrom, Target, TJX and Walmart—which break down their $17 billion in total capital spending. The growth rate in these retailers’ capex exceeds that of the overall industry, and their tech capex growth exceeds that of non-tech capex.
Figure 10 shows 2019 and 2020E capex for these retailers. We can see that Walmart’s capital spending dominates that of its peers.
[caption id="attachment_108709" align="aligncenter" width="700"]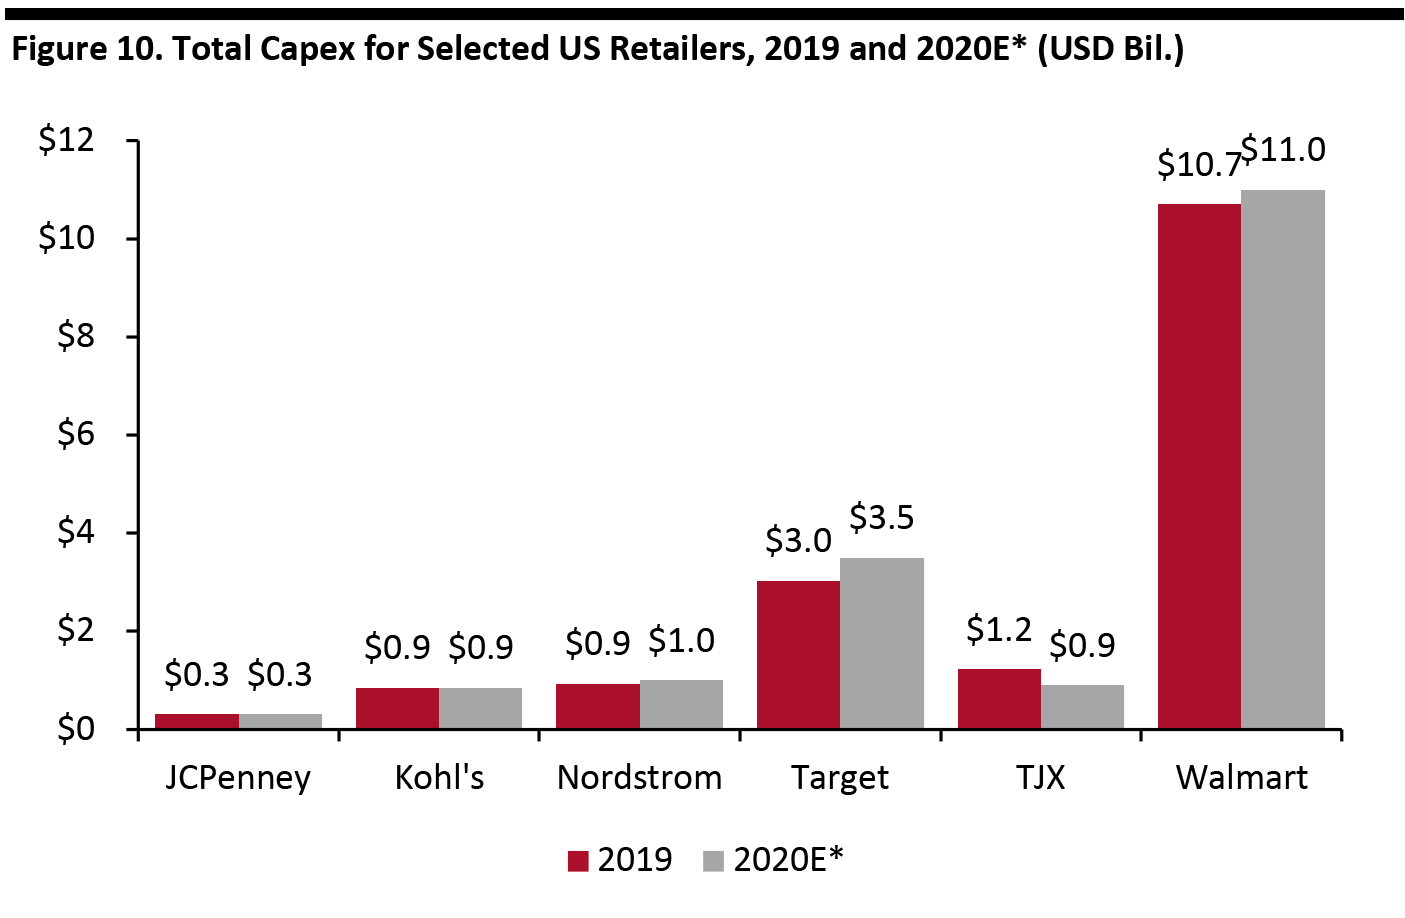 *2020 figures are pre-coronavirus estimates based on company guidance
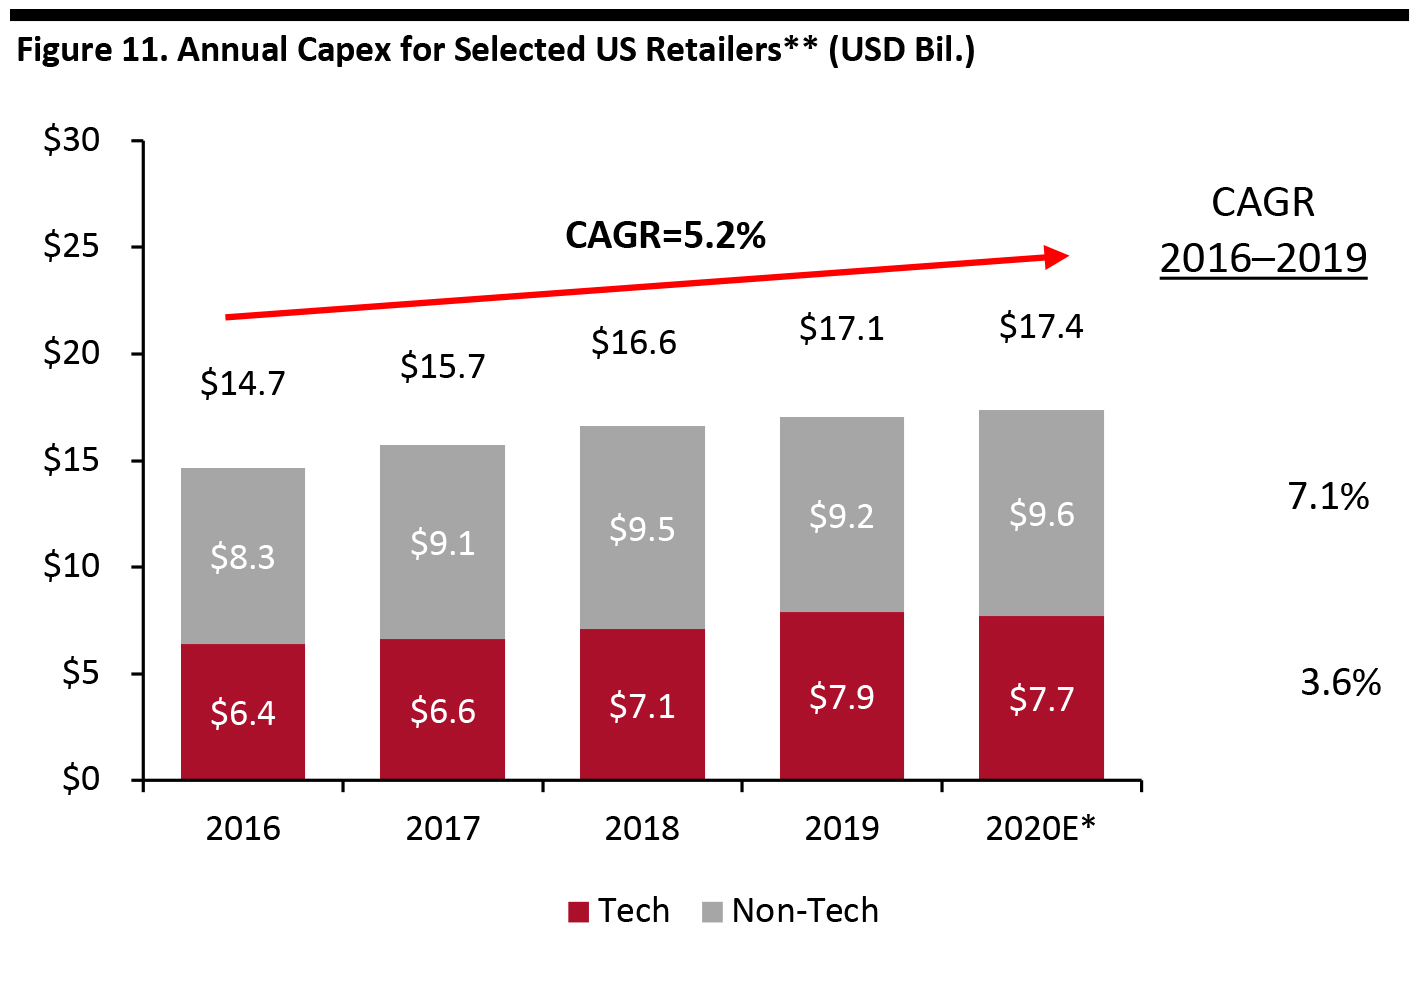
 Source: Company reports/Coresight Research [/caption] Figure 11 shows retailer capex for selected retailers broken down into tech and non-tech components during 2016–2020E, using pre-coronavirus estimates. Over this five-year period, total capex was expected to grow at a 5.2% CAGR, comprising a 7.1% CAGR for tech capex and a 3.6% CAGR for non-tech capex. [caption id="attachment_108710" align="aligncenter" width="700"]
 *2020 figures are pre-coronavirus estimates based on company guidance **Selected retailers are JCPenney, Kohl’s, Nordstrom, Target, TJX and Walmart
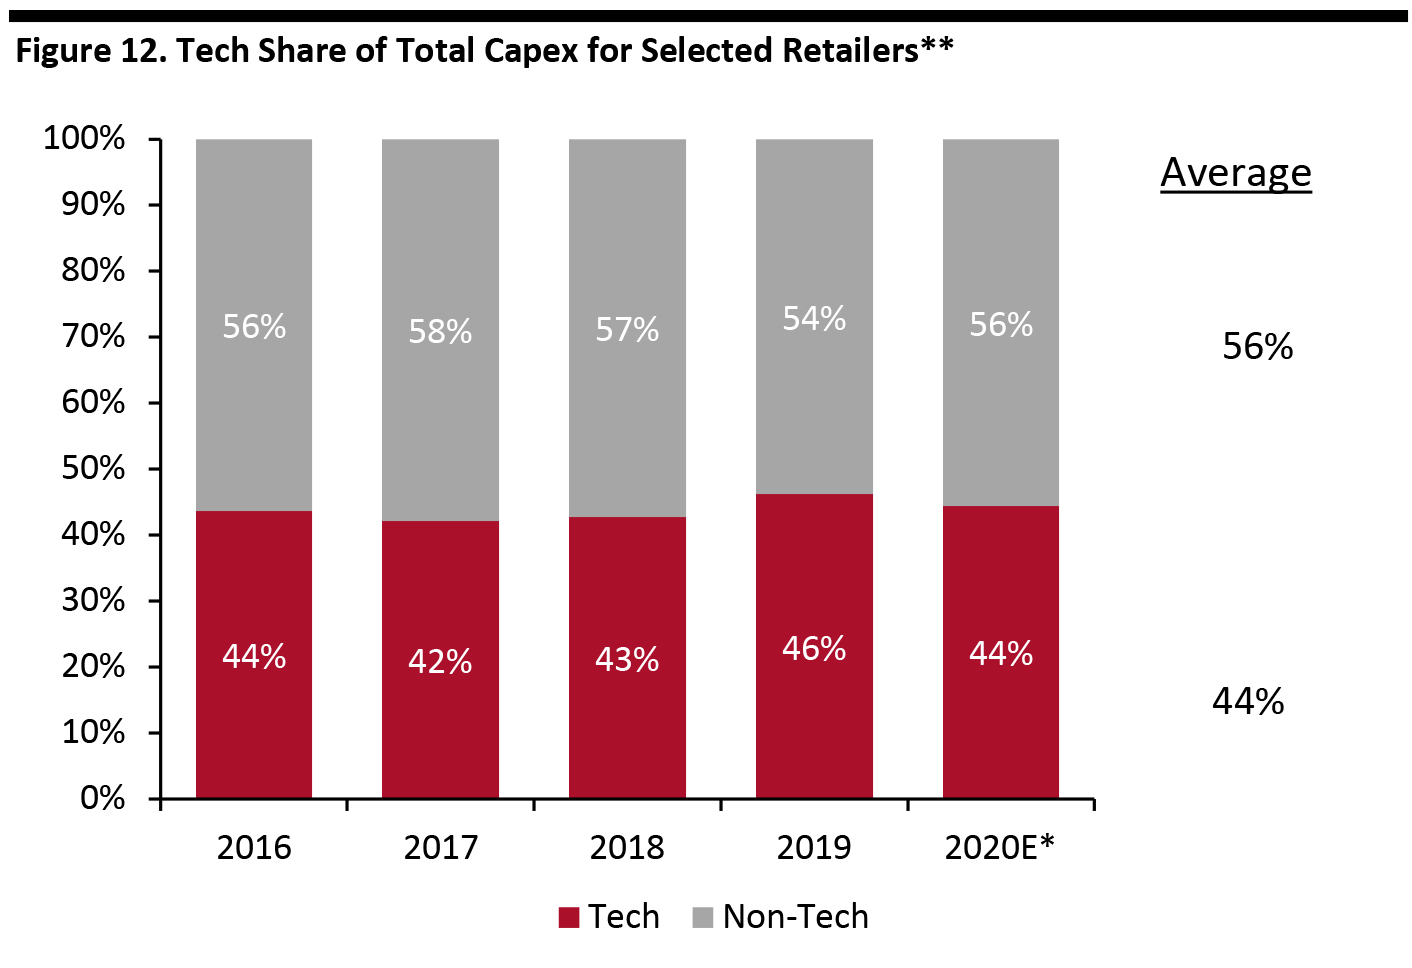
 Source: Company reports/Coresight Research [/caption] Figure 12 breaks down the share of tech and non-tech capex, showing that tech capex was estimated to average 44% of total capex during 2016–2020E based on pre-coronavirus expectations. [caption id="attachment_108711" align="aligncenter" width="700"]
 *2020 figures are pre-coronavirus estimates based on company guidance **Selected retailers are JCPenney, Kohl’s, Nordstrom, Target, TJX and Walmart
 Source: Company reports/Coresight Research [/caption] Capex Seasonality The analysis below analyzes how a retailer’s capex budget is allocated throughout the year, based on a quarterly average over the 2016–2019 period. Figure 13 illustrates how capex falls by quarter for the selected group of retailers and for the group of retailers excluding Walmart, whose capex exceeds the total of the other retailers combined. The two datasets present generally the same pattern—capex is the lowest in the first quarter and rises throughout the year, peaking in the third quarter—with the exception that the fourth quarter is has the lowest capex percentage of the year for Walmart. [caption id="attachment_108712" align="aligncenter" width="700"]
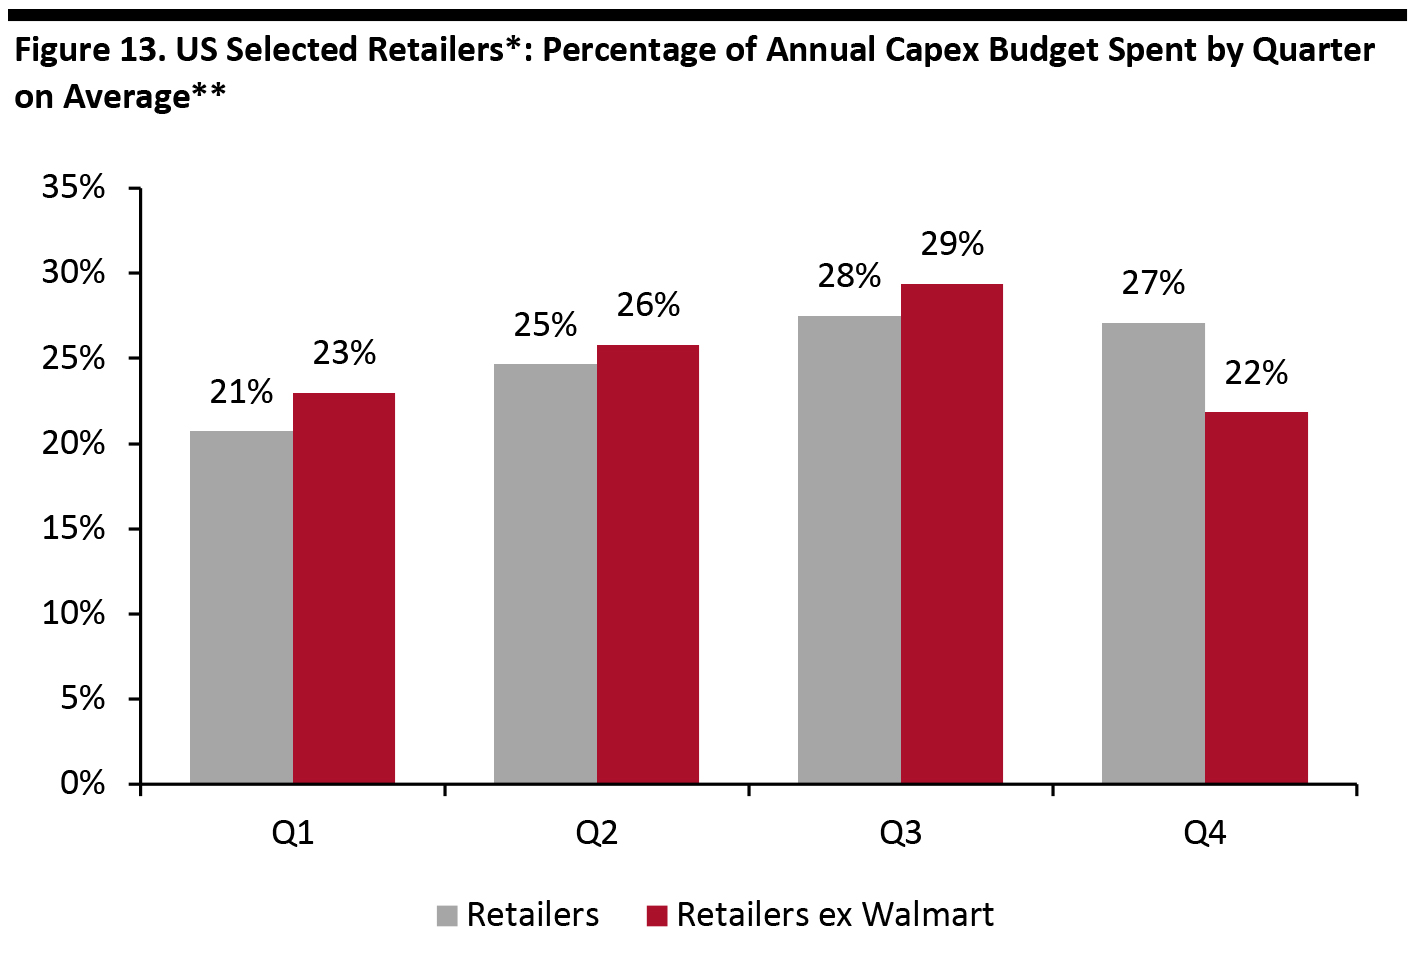 *Selected retailers are JCPenney, Kohl’s, Nordstrom, Target, TJX and Walmart
 **Data from 2016–2019
Source: Company reports/Coresight Research [/caption]