DIpil Das
What’s the Story?
This report presents Coresight Research’s updated Retail Robustness Index (RRI), which evaluates the 100 largest US retailers (by revenue) on their ability to weather the dramatic demand shifts amid the Covid-19 crisis in the US. In this quarterly update, we evaluate retailers based on financial health, sales capacity, product mix and management tenure, as of the end of October 2021.Why It Matters
Notwithstanding robust US retail sales figures and retailers’ strengthening financial position, retailers continue to face a constantly evolving set of challenges. We developed this index as a tool for evaluating retailers’ ability to persevere in the current environment.The Retail Robustness Index: In Detail
Changes in the Overall RRI In this update, the average score across the full index increased by 2.4 points to 54.0, owing to improvements in financial health and sales capacity offset by the effect of a couple of management changes:- Financial health—Financial health scores increased by 6.6 points since July, as retailers’ financials have improved from ongoing robust retail sales.
- Sales Capacity—Sales capacity overall has reached its highest level since we began the RRI, at 98.2 (see Figure 1) due to more stores being fully open following previous pandemic-led closures.
- Management tenure—This metric increases with the passage of time.
Figure 1. Retail Robustness Index and Its Components, by Month [caption id="attachment_135312" align="aligncenter" width="726"]
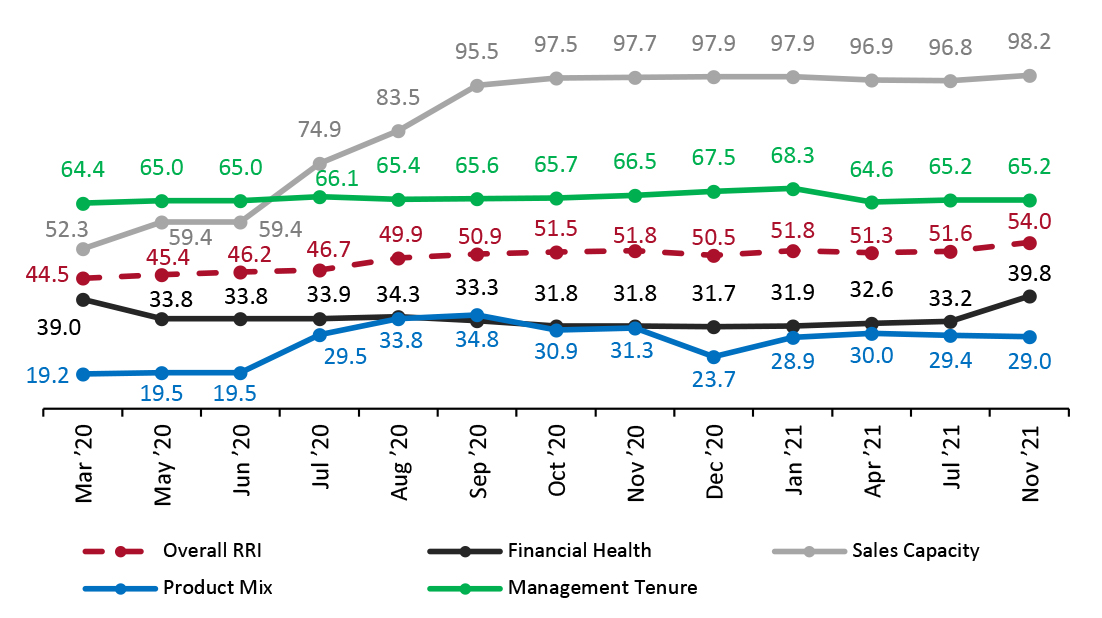 The index includes new weightings and methodologies for sales capacity and product mix starting in July 2020
 Source: Coresight Research [/caption] RRI Outlook RRI scores are likely to trend up through January 2022, as temporary store closures come to a complete end and retailers experience a sales boost amid the holiday shopping season. However, this positive outlook assumes that retailers will mitigate the impacts of ongoing supply chain issues and that the US will not see a resurgence in the spread of Covid-19. Top 10 Retailers by RRI Ranking Figure 2 presents the 10 retailers that rank highest in our October RRI (with scores accurate as of the end of October 2021). We saw Stitch Fix experience the greatest improvement in score to take second place in the rankings, while three retailers entered the top 10.
Figure 2. Changes in Retail Robustness Index: Top 10 Retailers [wpdatatable id=1402 table_view=regular]
Score changes are rounded from the metric calculations, rather than derived from the absolute score numbers shown in the table Source: Coresight Research Commentary on Score Changes Compared to the July 2021 index, 85 of the 100 companies in our October update received higher scores, seven scores remained flattish, seven companies experienced score declines and one company was replaced: At Home Group was acquired on July 22 and has been replaced by big and tall retailer Destination XL. We outline the five largest score changes—which were largely driven by management changes—since the July update below:
- Sally Beauty (decrease of 18 points). The total score decreased primarily due to a change in the CEO position, which more than offset an increase in financial health.
- Shoe Carnival (decrease of 17 points). The total score decreased primarily due to a change in the CEO position, which more than offset an increase in financial health.
- Conn’s (decrease of 16 points). The total score decreased primarily due to a change in the CEO position, which more than offset an increase in financial health.
- Nike (increase of 14 points). The total score increased due improvements in sales capacity, financial strength and management tenure.
- Stitch Fix (increase of 13 points). The total score increased primarily due to an improvement in financial health. In its most recent fiscal quarter (the fourth quarter of fiscal 2021), the company reported a net profit, as compared to a net loss in the year-ago quarter.
Figure 3. Retail Robustness Index, by Segment [caption id="attachment_135313" align="aligncenter" width="725"]
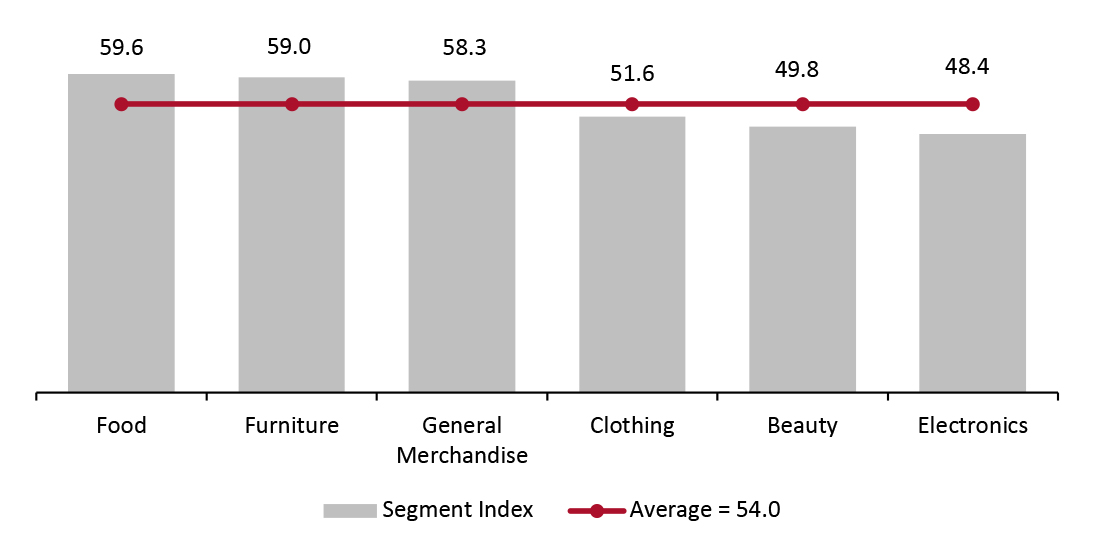 Source: Coresight Research[/caption]
- Foodand furniture rank highest in robustness due to retailers benefitting from the essential nature of both during the pandemic, including increases in preparing food at home and consumers investing in improvements in their working-living spaces.
- Clothing and beauty rank below average in terms of robustness, due to the heavy financial damage retailers experienced amid store closures. Both categories are still feeling the effect of delays in returning to the office and consumer reluctance to enter public spaces. See our weekly US Consumer Tracker survey reports for more on consumer sentiment and behavior.
- The electronics category ranks below average in robustness, despite the surge in electronics purchases for working and consuming entertainment at home, which has been extended by delays in returning to the office.
Figure 4. Coresight Research Retail Robustness Index: Full List [wpdatatable id=1403 table_view=regular]
Figures may fluctuate due to rounding—score changes are rounded from the metric calculations, rather than derived from the absolute score numbers shown in the table; Green represents an increase from the previous update, while red represents a decrease. Source: Company reports/S&P Capital IQ/Coresight Research
Appendix
Analysis Methodology The Coresight Research RRI evaluates the 100 largest US retailers (by revenue) based on their ability to weather the current shifts in demand due to the coronavirus crisis. Appendix Figure 1 outlines the components and weighting of the index.Appendix Figure 1. Coresight Research Retail Robustness Index: Components and Weighting [wpdatatable id=1404 table_view=regular]
Source: Coresight Research Additional notes on the Coresight Research RRI:
- The index is a model for retail robustness based on selected weights and factors and relies on certain assumptions and estimates.
- The environment is evolving dramatically at a fast pace: Figures are thought to be accurate as of writing but may change as companies continue to report quarterly earnings.
- The index is not a predictor of investment performance. Retailers with higher financial-health scores are much less likely to file for bankruptcy than retailers with low scores.
- Retailer financial health (40%): Represents a retailer’s financial state and ability to handle financial challenges.
Commentary: Many retailers have drawn on their credit lines and/or issued debt offerings and reduced expenditures, which bolsters their financial position. One component of this score is the market value of a company’s stock, which affects its ability to raise additional capital.
- Sales capacity (20%): Represents a retailer’s ability to sell products.
Commentary: This score is based on the percentage of each retailer’s stores that are currently open.
- Product mix (20%): Determines the relative benefit of a retailer’s product categories.
Commentary: The score is calculated from a weighted average based on Coresight Research weekly consumer surveys.
- Management tenure (20%): Reflects the number of years that the CEO has served in the position.
Commentary: CEOs who have occupied their positions for longer should be better acquainted with the company and better equipped to navigate the current environment.
Appendix Figure 2 below shows the ratio of “buying more” to “buying less” for selected categories.Appendix Figure 2. Ratio of “Buying More” to “Buying Less” for Selected Categories [wpdatatable id=1405 table_view=regular]
October data from Coresight Research’s US Consumer Tracker dated October 11, 2021 July data from Coresight Research’s US Consumer Tracker dated July 6, 2021 Source: Coresight Research