DIpil Das
This report presents Coresight Research’s updated Retail Robustness Index (RRI), which evaluates the 100 largest US retailers (by revenue) on their ability to weather the dramatic demand shifts due to the coronavirus crisis in the US.
We evaluate retailers based on financial health, sales capacity, product mix and management tenure.
Discussion
In this update, the average score across the full index increased by 0.7 points to 51.5, from 50.9 in September, primarily owing to a higher number of open stores more than offsetting declines in financial health and product mix. Many retailers continue to experience losses from low sales volume. While the retail Q2 reporting season is largely complete, around 20% of the companies are scheduled to release earnings later in October. None of the included retailers filed for bankruptcy in September. Retailers are likely now resolved to get through the crucial holiday season; yet given the volatility in consumer preferences and the weakened financial state of many retailers, subsequent filings are highly possible.
Monthly Changes of Overall Retail Robustness Index
Figure 1 shows the changes in the overall RRI and its components since March 2020. We outline the components and methodology later in this report.
[caption id="attachment_117322" align="aligncenter" width="700"]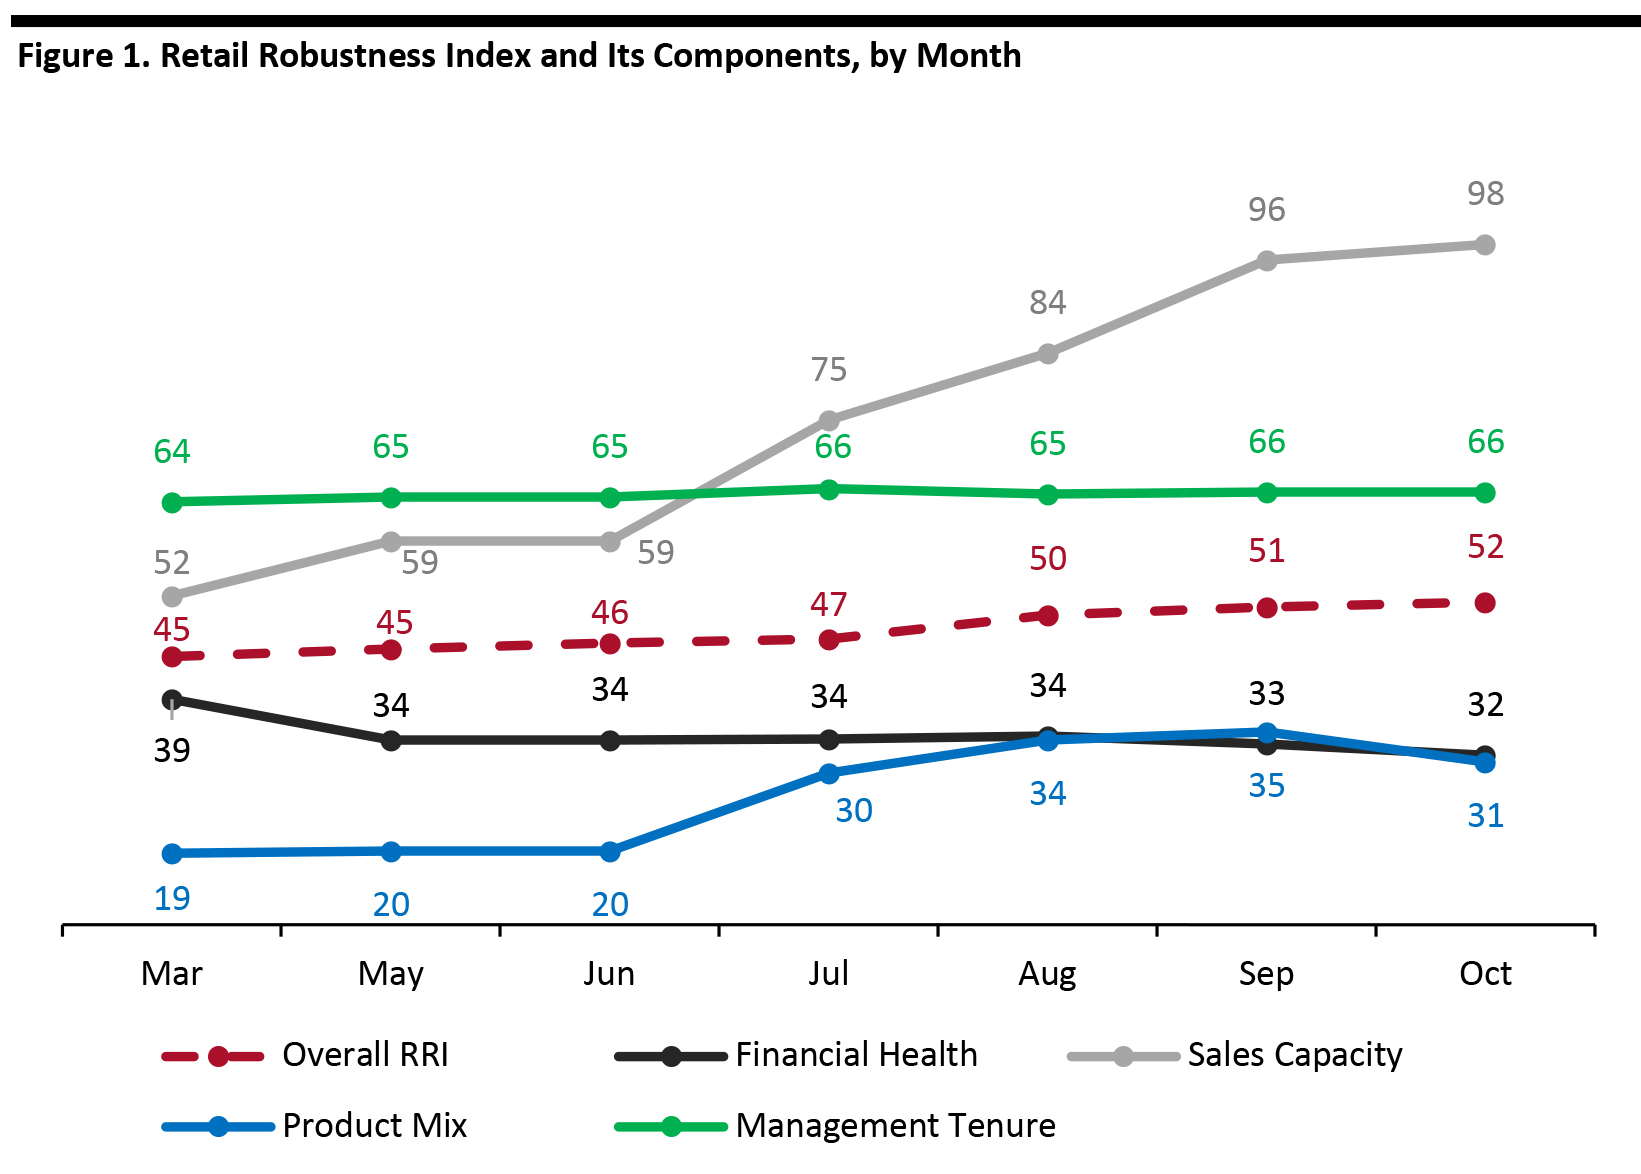 Note: The index includes new weightings and methodologies for sales capacity and product mix starting in July 2020.
 Source: Coresight Research [/caption] The main driver of higher RRI scores has been sales capacity, which has increased over the past five months due to store reopenings. Financial health has declined gradually in the past two months as lower sales volumes and unprofitability take their toll on retailers’ finances. In addition, consumer shopping preferences have shown some recent volatility and changed markedly during the month, with fewer consumers saying that they are buying food or nonalcoholic beverages (likely due to some ability and desire to return to restaurants), as well as a decrease in the percentage of respondents saying they are buying less electronics, appliances, and beauty products, cosmetics or fragrances, according to our most recent weekly consumer survey. October RRI Outlook The RRI is likely to increase slightly in October, due to continued reports of store reopenings, somewhat offset by continued retailer net losses. Consumer shopping preferences could continue to show volatility, as the holidays approach. October includes events such as the 10.10 Shopping Festival, Amazon Prime Day and several large retailers have encouraged consumers to shop early to secure their desired gifts and practice social distancing ahead of peak shopping periods. Top 10 Retailers by RRI Ranking Figure 2 presents the 10 retailers that rank highest in our index as of the start of September 2020. The overall changes in most of the top 10 RRI scores were modest, with companies in the top 10 swapping positions, due to a lack of updated financial data and little change in the percentage of stores open.
Figure 2. Changes in Retail Robustness Index: Top 10 Retailers [wpdatatable id=497 table_view=regular]
Note: Differences in score changes are rounded. Source: Coresight Research Commentary on Score Changes Some retailers saw more pronounced score changes, which we outline below.
- American Eagle Outfitters (increase of 7 points): The score increased due to a higher sales capacity (from store reopenings).
- Lululemon (increase of 6 points): The score increased due to a higher sales capacity (from store reopenings).
- Designer Brands (decrease of 6 points): The score decreased due to a lower financial health score, owing to a net loss in the most recent earnings report and a 23% decline in the stock price in September.
- RH (increase of 5 points): The score increased due to a higher sales capacity (from store reopenings).
- Williams-Sonoma (increase of 5 points): The score increased due to a higher sales capacity (from store reopenings).
 Source: Coresight Research[/caption]
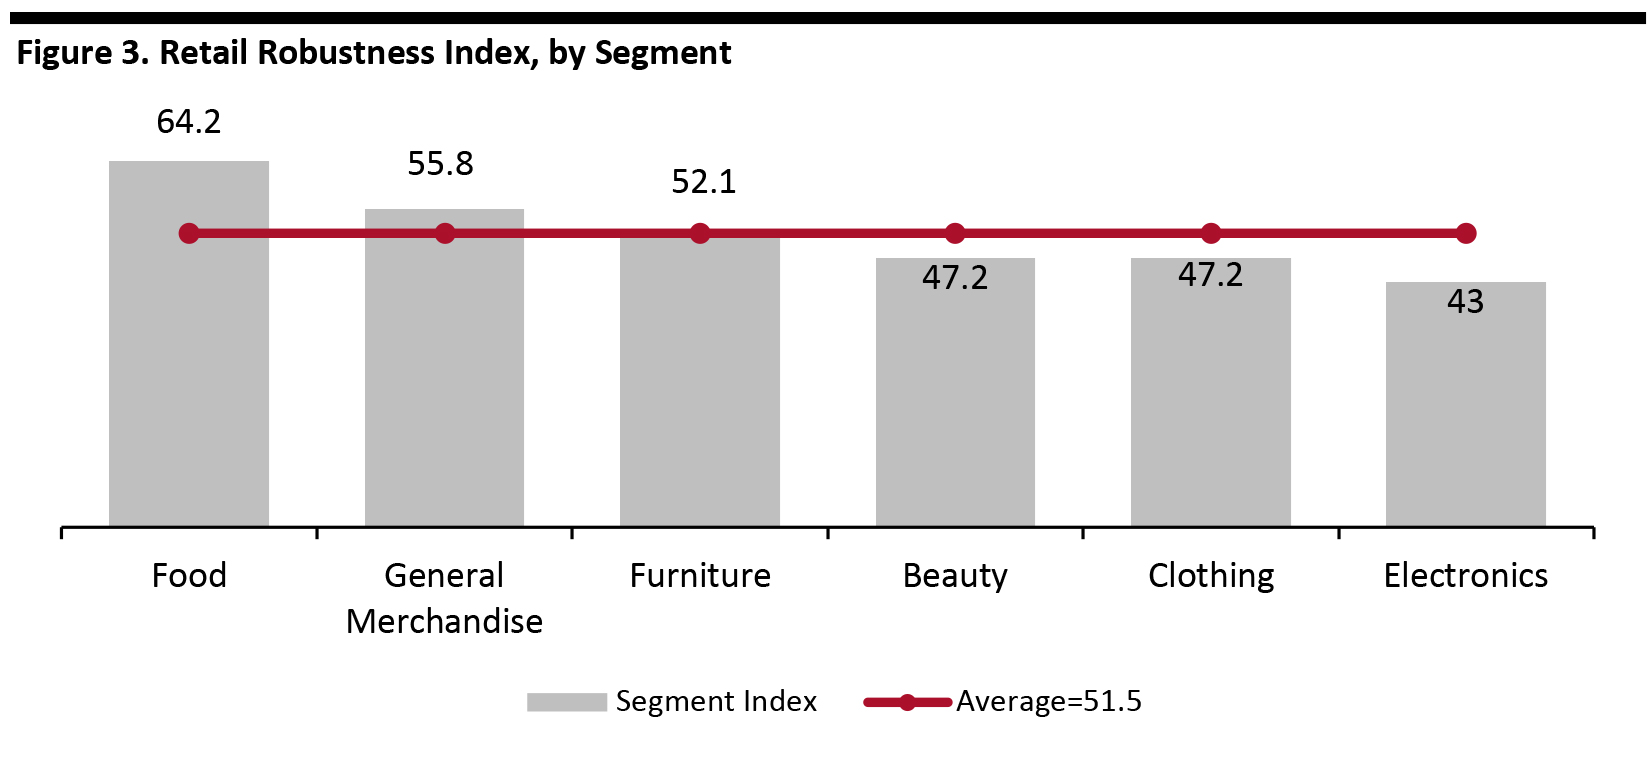
- Food ranks the highest due to its high product mix and availability, since it is an essential category.
- Beauty ranks below average despite the inclusion of essential health and wellness products in this category as consumers are currently buying less of these products than before the crisis.
- Electronics and clothing rank below average due to consumers currently purchasing less in these product categories compared to before the pandemic.
Figure 4. Coresight Research Retail Robustness Index: Components and Weighting [wpdatatable id=453 table_view=regular]
Source: Coresight Research A more detailed discussion of the index methodology is included in the appendix of this report. Additional notes on the Coresight Research Retail Robustness Index:
- The index is a model for retailer robustness based on selected weights and factors and relies on certain assumptions and estimates.
- The environment is evolving dramatically at a fast pace: Figures are thought to be accurate as of writing but may change as companies continue to report quarterly earnings.
- The index is not a predictor of investment performance. Retailers with higher financial-health scores are much less likely to file for bankruptcy than retailers with low scores.
Figure 5. Coresight Research Retail Robustness Index: Full List [wpdatatable id=496 table_view=regular]
Figures may fluctuate due to rounding; Green represents an increase from the previous update in August, while red represents a decrease. Source: Company reports/S&P Capital IQ/Coresight Research
Appendix
Retail Robustness Index Methodology The individual components are discussed further below.- Retailer financial health (40%): Represents a retailer’s financial state and ability to handle financial challenges. Commentary: Many retailers have drawn on their credit lines and/or issued debt offerings and reduced expenditures, which bolsters their financial position. One component of this score is the market value of a company’s stock, which affects its ability to raise additional capital.
- Sales capacity (20%): Represents a retailer’s ability to sell products. Commentary: This score is based on the percentage of each retailer’s stores that are currently open.
- Product mix (20%): Determines the relative benefit of a retailer’s product categories. Commentary: The score is calculated from a weighted average based on Coresight Research weekly consumer surveys.
- Management tenure (20%): Reflects the number of years that the CEO has served in the position. Commentary: CEOs who have occupied their positions for longer should be better acquainted with the company and better equipped to navigate the current environment.