DIpil Das
What’s the Story?
This report presents Coresight Research’s updated Retail Robustness Index (RRI), which evaluates the 100 largest US retailers (by revenue) on their ability to weather the dramatic demand shifts amid the Covid-19 crisis in the US. In this quarterly update, we evaluate retailers based on financial health, sales capacity, product mix and management tenure.Why It Matters
Notwithstanding robust US retail sales figures and retailers’ strengthening financial position, retailers continue to face a constantly evolving set of challenges. We developed this index as a tool for evaluating retailers’ ability to persevere in the current environment.The Retail Robustness Index: In Detail
In this update, the average score across the full index increased by 0.3 points to 51.6, owing to increases in financial health and management tenure more than offsetting declines in product mix:- Financial health—Financial health scores increased by 0.6 points since January, as retailers’ financials have benefited from the sales and profits generated during the important holiday selling season.
- Management tenure—This metric increases with the passage of time, yet Amazon, BJ’s Wholesale Club, Gamestop and Ulta Beauty experienced changes in the CEO position since our April update.
Figure 1. Retail Robustness Index and Its Components, by Month [caption id="attachment_130157" align="aligncenter" width="724"]
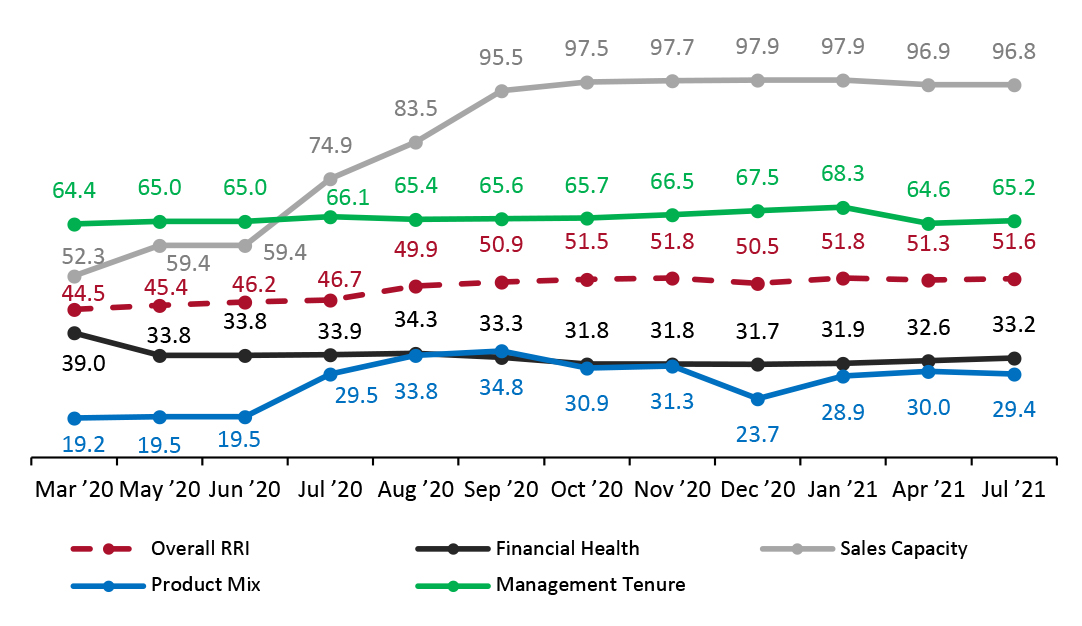 The index includes new weightings and methodologies for sales capacity and product mix starting in July 2020
 Source: Coresight Research [/caption] RRI Outlook RRI scores have largely reached a measure of stability, with minor volatility from temporary store closures and shifts in consumer shopping behavior. Many retailers prudently raised capital at the outset of the outbreak, enabling them to benefit from the holiday selling season and into 2021. Retailers are now benefiting from continuing robust retail sales including a resurgence in apparel purchases, though consumer purchase preferences are shifting again as many consumers prepare for various forms of a return to schools and offices. Top 10 Retailers by RRI Ranking Figure 2 presents the 10 retailers that rank highest in our index as of the start of July 2021. For the most part, changes in scores were negligible. The largest change was Deckers rising from 23rd place to ninth due to an improvement in its financial health score; the other score changes were minimal.
Figure 2. Changes in Retail Robustness Index: Top 10 Retailers [wpdatatable id=1114 table_view=regular]
Score changes are rounded from the metric calculations, rather than derived from the absolute score numbers shown in the table Source: Coresight Research Commentary on Score Changes As highlighted above, the slight increase in the RRI overall was driven by an increase in management tenure, offset by a slight decrease in scores due to changes in product mix. In the recent Coresight Research weekly consumer survey published July 6, figures for consumers buying less of selected categories declined across the board. Compared to the April 2021 index, 40 of the 100 companies received higher scores, 53 scores remained flattish, six companies experienced score declines and one company was replaced (with The Michaels Companies by Tilly’s). The changes were generally driven by changes in financial health and management tenure. We outline the five largest score changes since the April update below:
- Ulta Beauty (decrease of 20 points). The total score decreased primarily due to a change in the CEO position.
- Amazon.com (decrease of 19 points). The total score decreased primarily due to a change in the CEO position.
- Murphy USA (decrease of 10 points). The total score decreased due to a substantial increase in the amount of debt on the company’s balance sheet.
- Deckers Outdoor (increase of 9 points). The total score increased due to an improvement in the company’s financial health score due to recent improvements in sales and profits.
- Gamestop (decrease of 9 points). The total score decreased primarily due to a change in the company’s CEO position.
Figure 3. Retail Robustness Index, by Segment [caption id="attachment_130158" align="aligncenter" width="726"]
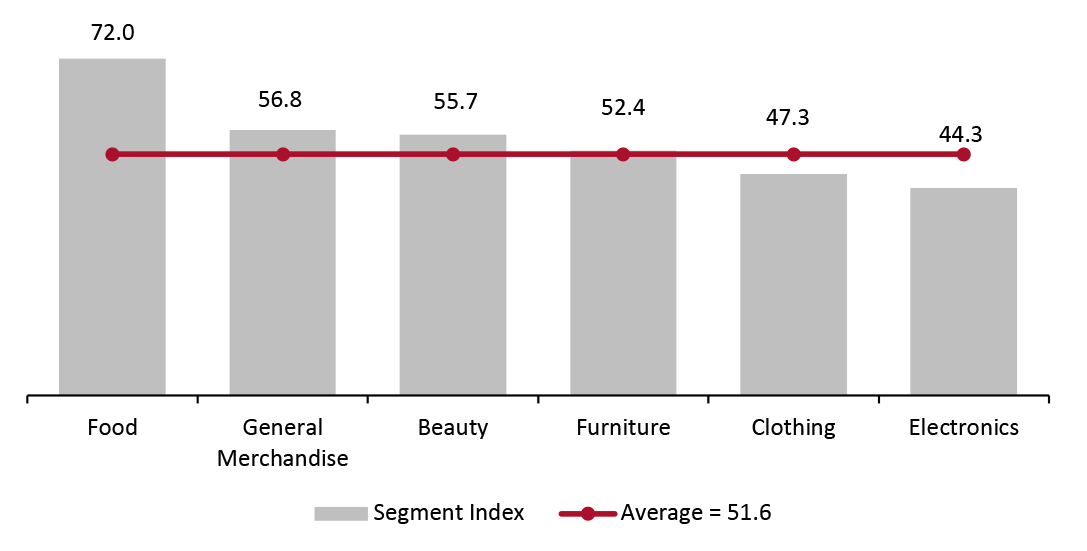 Source: Coresight Research[/caption]
- Food ranks the highest due to its high product mix and availability since it is an essential category, though its relative outperformance has declined year to date as consumers shift purchases toward restaurants and away from grocery.
- Beauty now ranks above average, owing to the robustness of companies in the category, despite a greater proportion of respondents in our US Consumer Tracker reports still saying that, compared to pre-pandemic, they are currently buying less in the beauty, cosmetics and fragrances category than those stating they are buying more.
- Clothing and electronics rank below average due to fewer consumers saying they are purchasing more in these categories than before the pandemic, yet the percentage of consumers saying they are purchasing less in these (and all the above-mentioned) categories declined in the most recent survey.
Figure 4. Coresight Research Retail Robustness Index: Full List [wpdatatable id=1115 table_view=regular]
Figures may fluctuate due to rounding—score changes are rounded from the metric calculations, rather than derived from the absolute score numbers shown in the table; Green represents an increase from the previous update, while red represents a decrease. Source: Company reports/S&P Capital IQ/Coresight Research
Appendix
Analysis Methodology The Coresight Research RRI evaluates the 100 largest US retailers (by revenue) based on their ability to weather the current shifts in demand due to the coronavirus crisis. Appendix Figure 1 outlines the components and weighting of the index.Appendix Figure 1. Coresight Research Retail Robustness Index: Components and Weighting [wpdatatable id=1116 table_view=regular]
Source: Coresight Research Additional notes on the Coresight Research RRI:
- The index is a model for retail robustness based on selected weights and factors and relies on certain assumptions and estimates.
- The environment is evolving dramatically at a fast pace: Figures are thought to be accurate as of writing but may change as companies continue to report quarterly earnings.
- The index is not a predictor of investment performance. Retailers with higher financial-health scores are much less likely to file for bankruptcy than retailers with low scores.
- Retailer financial health (40%): Represents a retailer’s financial state and ability to handle financial challenges.
- Sales capacity (20%): Represents a retailer’s ability to sell products.
- Product mix (20%): Determines the relative benefit of a retailer’s product categories.
- Management tenure (20%): Reflects the number of years that the CEO has served in the position.
Appendix Figure 2. Ratio of “Buying More” to “Buying Less” for Selected Categories [wpdatatable id=1117 table_view=regular]
July data from Coresight Research’s US Consumer Tracker dated July 6, 2021 Source: Coresight Research