DIpil Das
What’s the Story?
This report presents Coresight Research’s updated Retail Robustness Index (RRI), which evaluates the 100 largest US retailers (by revenue) on their ability to weather the dramatic demand shifts amid the coronavirus crisis in the US. We evaluate retailers based on financial health, sales capacity, product mix and management tenure.Why It Matters
Retailers are facing a perfect storm of challenges, with steady increases in e-commerce penetration and heightened competition, and these challenges were exacerbated by the closure of nonessential stores and lockdowns affecting consumer shopping behaviors. There have been large numbers of store-closure announcements and bankruptcy filings during the past several years, and the Covid-19 crisis is intensifying the pressure on retailers. We developed this index as a tool for evaluating retailers’ ability to persevere in the current environment.The Retail Robustness Index: In Detail
In this update, the average score across the full index increased by 1.3 points to 51.8, rebounding to the November level, owing to product mix reverting to previous levels plus modest increases in scores for financial health and management tenure. Due to a mix of a higher number of stores open offset by some temporary closures, scores for sales capacity were flat, while management-tenure scores inched up. No major retailers have filed for bankruptcy protection since our last update in December 2020. but we believe that additional filings are likely in the near future as retailers calculate their performance during the holidays and create their forecasts for 2021. Many retailers likely held on through the crucial holiday season, and that performance will have a large impact on their footprint in the future. The first quarter in retail ends in January, and financial reporting will begin in February. Monthly Changes in the Overall Retail Robustness Index Figure 1 shows the changes in the overall RRI and its components since March 2020. We outline the components and methodology later in this report and in the appendix.Figure 1. Retail Robustness Index and Its Components, by Month [caption id="attachment_121487" align="aligncenter" width="725"]
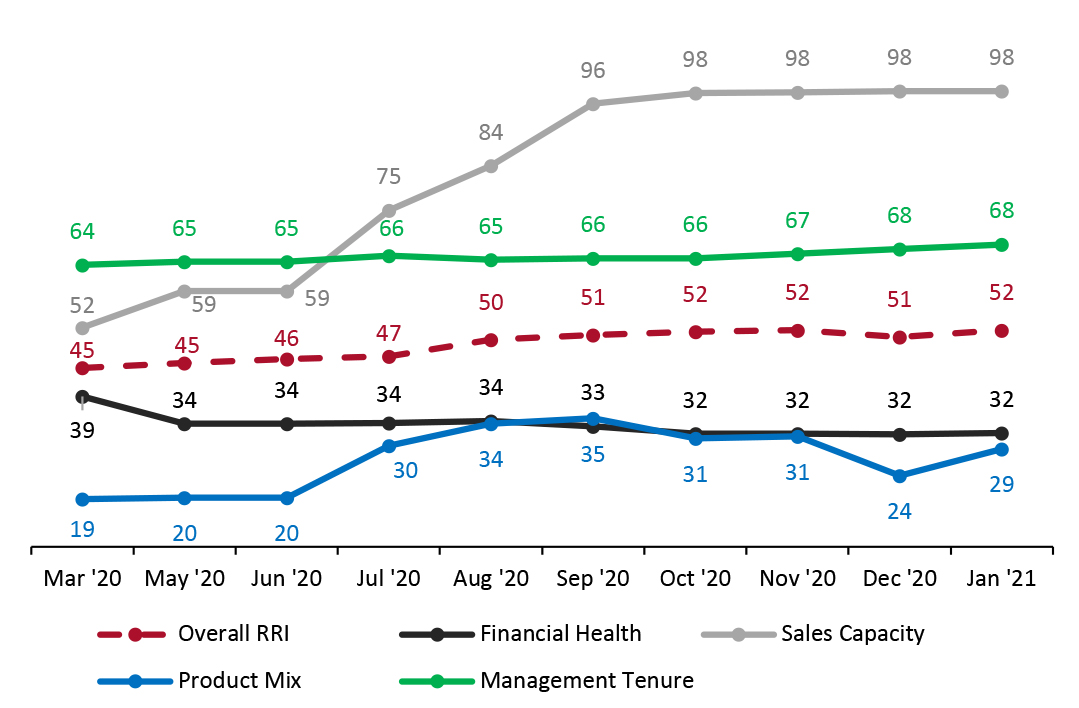 Note: The index includes new weightings and methodologies for sales capacity and product mix starting in July 2020
 Source: Coresight Research [/caption] During the past several months, the primary metric driving higher RRI scores has been sales capacity, continuing its positive trend due to store reopenings. Product mix took a step downward in November but rebounded in December, based on data from our most recent proprietary survey of US consumers, dated December 21. This volatility is likely due to the influence of the holidays on consumer spending expectations. RRI Outlook Looking forward, we are likely to see big changes in the RRI index as retailers begin to report fourth-quarter 2020 earnings from February. These results are likely to echo the patterns we saw throughout the course of last year, with essential retailers and those that had made substantial investments in e-commerce and fulfillment infrastructure thriving, while those in nonessential categories without strong e-commerce platforms face substantial challenges. We expect seasonal store-closure and bankruptcy announcements to resume in January when retailers close the books on 2020 and determine the outlook for 2021. Top 10 Retailers by RRI Ranking Figure 2 presents the 10 retailers that rank highest in our index as of the start of January 2021. For the most part, changes in scores were modest, and the retailers comprising the top 10 remained the same as our previous update in December, with only the top four shuffling positions.
Figure 2. Changes in Retail Robustness Index: Top 10 Retailers [wpdatatable id=672 table_view=regular]
Note: Score changes are rounded from the metric calculations, rather than derived from the absolute score numbers shown in the table Source: Coresight Research Commentary on Score Changes Score changes were predominantly driven by shifts in consumer buying preferences. In our most recent US consumer survey, we saw increases in the ratios of consumers saying they are buying more (rather than less) food, beauty products and clothing than pre-crisis, which benefited retailers serving those categories (see the appendix for further explanation). Compared to the December 2020 index, 54 of the 100 companies received higher scores, 29 scores remained flat and 17 companies experienced score declines. We outline the five largest score changes below:
- Pool Corp (increase of 8 points). The total score increased primarily due to an increase in the financial health score. A slight decrease in the product-mix score was offset by a slight increase in the management-tenure score.
- Gildan Activewear (increase of 7 points). The total score increased due to an increase in the financial health score.
- L Brands (increase of 7 points). The total score increased due to an increase in the product-mix score.
- Big Lots (increase of 6 points). The total score increased due to an increase in the product-mix score.
- Dollar Tree (increase of 6 points). The total score increased due to an increase in the product-mix score.
Figure 3. Retail Robustness Index, by Segment [caption id="attachment_121488" align="aligncenter" width="725"]
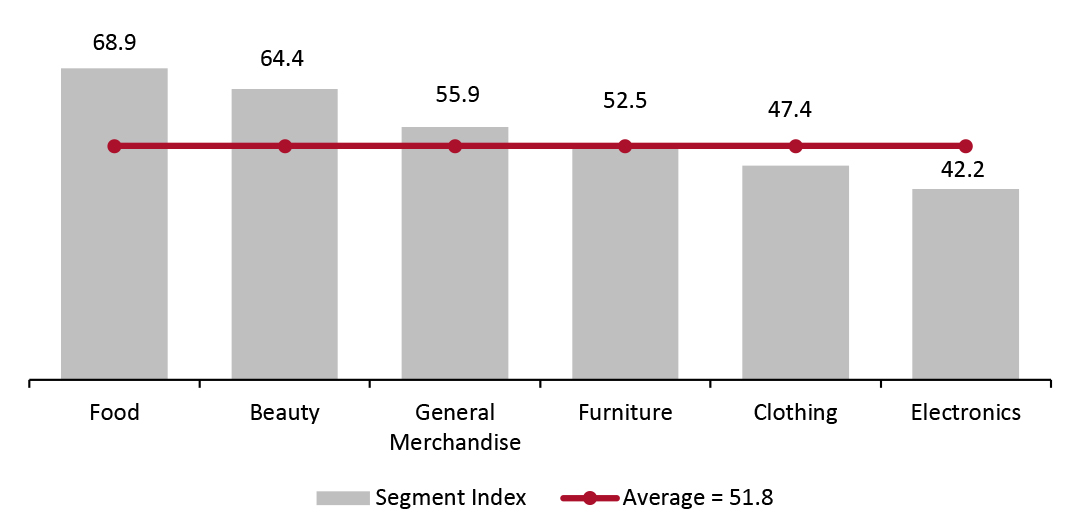 Source: Coresight Research[/caption]
- Food ranks the highest due to its high product mix and availability since it is an essential category.
- Beauty continues to rank above average, with the share of consumers buying less beauty having passed a new low.
- Clothing and electronics rank below average due to consumers currently purchasing less in these product categories compared to before the pandemic.
Figure 4. Coresight Research Retail Robustness Index: Full List [wpdatatable id=673 table_view=regular]
Note: Figures may fluctuate due to rounding—score changes are rounded from the metric calculations, rather than derived from the absolute score numbers shown in the table; Green represents an increase from the previous update, while red represents a decrease. Source: Company reports/S&P Capital IQ/Coresight Research
Appendix
Analysis Methodology The Coresight Research RRI evaluates the 100 largest US retailers (by revenue) based on their ability to weather the current shifts in demand due to the coronavirus crisis. Appendix Figure 1 outlines the components and weighting of the index.Appendix Figure 1. Coresight Research Retail Robustness Index: Components and Weighting [wpdatatable id=674 table_view=regular]
Source: Coresight Research Additional notes on the Coresight Research RRI:
• The index is a model for retail robustness based on selected weights and factors and relies on certain assumptions and estimates.
• The environment is evolving dramatically at a fast pace: Figures are thought to be accurate as of writing but may change as companies continue to report quarterly earnings.
• The index is not a predictor of investment performance. Retailers with higher financial-health scores are much less likely to file for bankruptcy than retailers with low scores.
The individual components are discussed further below.• Retailer financial health (40%): Represents a retailer’s financial state and ability to handle financial challenges.
Commentary: Many retailers have drawn on their credit lines and/or issued debt offerings and reduced expenditures, which bolsters their financial position. One component of this score is the market value of a company’s stock, which affects its ability to raise additional capital.
• Sales capacity (20%): Represents a retailer’s ability to sell products.
Commentary: This score is based on the percentage of each retailer’s stores that are currently open.
• Product mix (20%): Determines the relative benefit of a retailer’s product categories.
Commentary: The score is calculated from a weighted average based on Coresight Research weekly consumer surveys.
• Management tenure (20%): Reflects the number of years that the CEO has served in the position.
Commentary: CEOs who have occupied their positions for longer should be better acquainted with the company and better equipped to navigate the current environment.
Appendix Figure 2 below shows the ratio of “buying more” to “buying less” for selected categories.Appendix Figure 2. Ratio of “Buying More” to “Buying Less” for Selected Categories [wpdatatable id=675 table_view=regular]
Source: Coresight Research